Downloaded 155 times


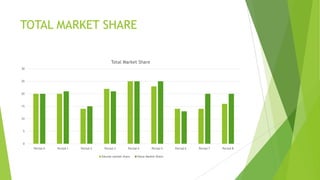
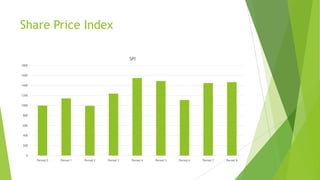
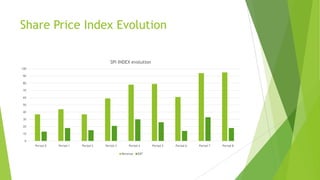
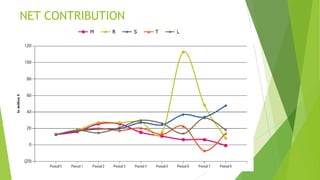
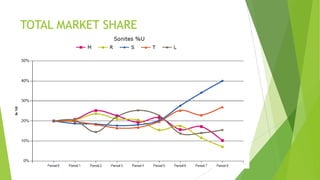
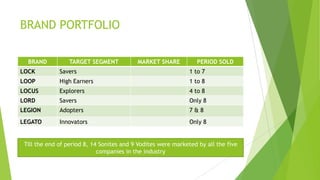
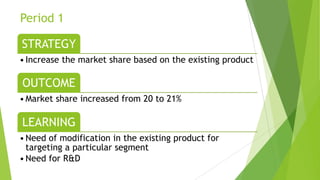
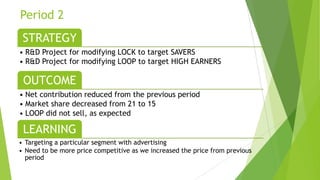


This document contains information about Group B10's performance over 8 periods in a simulated market. It lists the members of Group B10 and provides data on the group's total market share, revenue, expenses, and brand portfolio over time. It also outlines the strategies Group B10 employed in each period, and summarizes the outcomes and lessons learned. The group worked to modify existing products, launch new products to target different segments, and expand into the Vodite market while maintaining their Sonite market share.


