A wide gamut of people including common people with not an idea of portfolio management are lured in to moneymaking with ease.
They want to enjoy capital appreciation apart from hedge against inflation. Investors have an infinite range of securities to choose from.
Apart from the dilemma of risk and return they also face the difficult question of how much to invest and in which share.
Sharpes optimization model pulls the investors out of this dilemma. The model is easier to understand and also requires less calculation on the part of the investor


![William F. Sharpe was born on June 16, 1934 in Boston,
Massachusetts. A friend introduced William F. Sharpe to Harry
Markowitz, thus he proceeded to work closely with him on the
topic Portfolio Analysis Based on a Simplified Model of the
Relationships Among Securities. Harry guided his dissertation,
after which he received the PhD degree in 1961. He was
invited to take a position at the Stanford University Graduate
School of Business, in 1970. He completed a book, Portfolio
Theory and Capital Markets, and Asset Allocation Tools.
William F. Sharpe has also received awards from diverse
constituencies. He is the proud recipient of the American
Assembly of Collegiate Schools of Business award for the field
of business education in 1980 and the Financial Analysts'
Federation Nicholas Molodovsky Award for outstanding
contributions to the [finance] profession in 1989. He received
the Nobel Prize in Economic Sciences with Harry Markowitz
and Merton Miller in 1990.
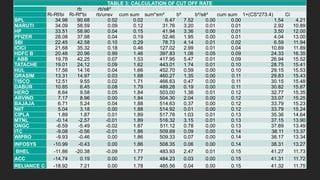
the Single Index Model of portfolio return and risk can
be computed easily.3n+1 calculations, thus only 151
calculations for a portfolio of 50 shares.
.
William Sharpe](https://image.slidesharecdn.com/dr-250627085034-009de3d6/85/REVISITING-SHARPES-SINGLE-INDEX-AND-OPTIMAL-PORTFOLIO-3-320.jpg)