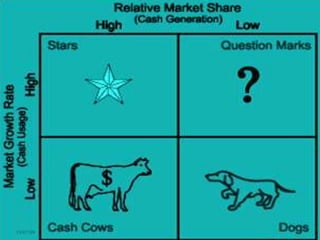
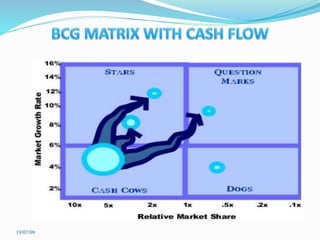
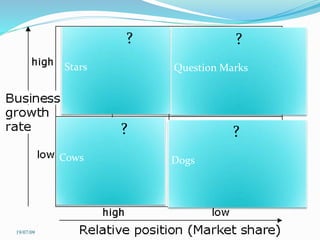
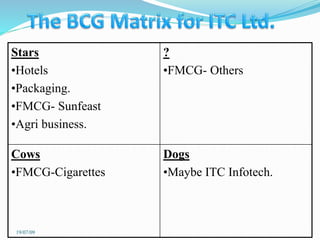
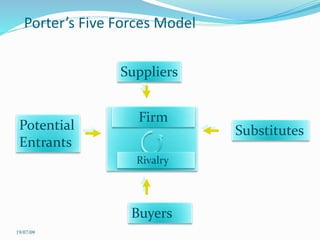
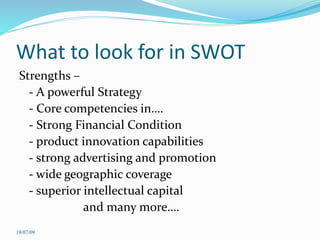
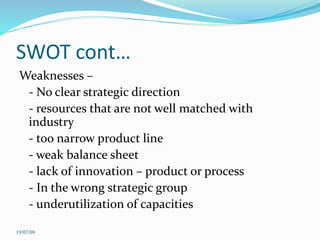
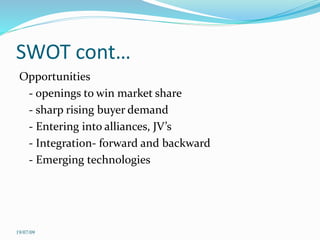
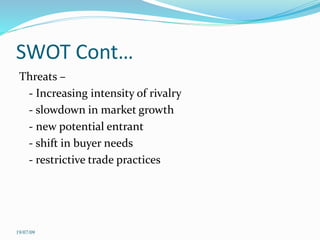
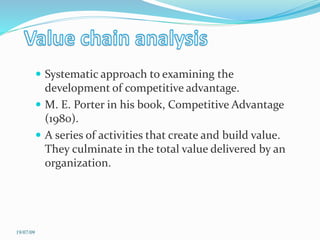
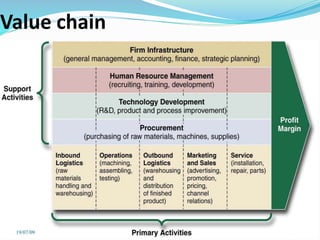
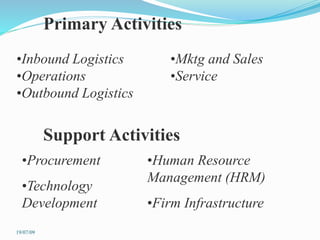
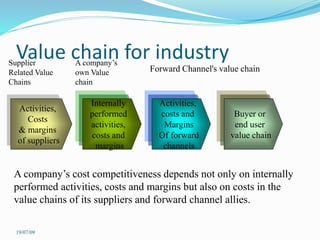
19/07/09
strategic
tactical
operational
19/07/09
 Long term focus
 Sustainable Competitive Advantage
 Relevant, accurate, timely market
information is the key
 Analysis of Self, Customers, Competitors,
other interest groups
19/07/09
 Product Portfolio Analysis
 BCG Matrix
 GE 9 Cell Matrix
 External Environment Analysis
 Porter’s Five Forces
 Strategic Mapping
 Industry Spectrum
 Internal Analysis of Company
 SWOT
 Value Chain Analysis
 BOSTON CONSULTING GROUP (BCG)
MATRIX
 Developed by BRUCE HENDERSON in the
early 1970’s.
 According to this technique, businesses or
products are classified as low or high
performers depending upon their
 market growth rate (cash usages)
 relative market share (cash generation)
19/07/09
 Market share is the percentage of the total
market that is being serviced by your
company, measured either in revenue terms
or unit volume terms.
 RELATIVE MARKET SHARE (RMS)
 RMS = Business unit sales this year
Leading rival sales this year
19/07/09
 Market growth rate is used as a measure of
a market’s attractiveness.
 MGR = Individual sales - individual sales
this year last year
Individual sales last year
 Markets experiencing high growth are ones
where the total market share available is
expanding, and there’s plenty of
opportunity for everyone to make money.
19/07/09
BCG matrix is a product portfolio planning tool
in which a company’s business units/ products
can be classified in to four categories:
 Stars
 Question marks
 Cash cows
 Dogs
19/07/09
19/07/09
 Stars are leaders in business.
 It leads to large amount of cash
generation.
 They also require heavy investment, to
maintain its large market share.
19/07/09
CASH COWS
Low growth
High market share
 They are foundation of the company
and the stars of yesterday.
 They generate more cash than
required.
 They extract the profits by investing
as little cash as possible
 They are located in an industry that is
mature, not growing or declining.
19/07/09
DOGS
Low growth, Low market share
 Dogs are the cash traps.
 Dogs do not have potential to bring in
much cash.
 Number of dogs in the company should be
minimized.
 Business is situated at a declining stage.
19/07/09
QUESTION MARKS
High growth , Low market share
 Most businesses start of as question marks.
 They will absorb great amounts of cash if the
market share remains unchanged, (ie. low).
 Why question marks?
Question marks have potential to become
star and eventually cash cow but can also
become a dog.
 Investments should be high for question
marks.
19/07/09
To assess :
 The CASH FLOW
 The development cycles of products
 Resource allocation and
divestment decisions
19/07/09
19/07/09
?
Dogs
?
Stars
?
Cows
?
Question Marks
19/07/09
Stars
•Hotels
•Packaging.
•FMCG- Sunfeast
•Agri business.
?
•FMCG- Others
Cows
•FMCG-Cigarettes
Dogs
•Maybe ITC Infotech.
19/07/09
 BCG MATRIX uses only two
dimensions, Relative market share
and market growth rate.
 High market share does not mean
profits all the time. Business with
low market share can be profitable
too.
 Problems of getting data on
market share and market growth.
19/07/09
 Developed by GE, USA
 Overcomes key limitation of BCG matrix
 Also called Industry Attractiveness-
Competitive Strength Matrix
19/07/09
Competititve strength: market share, brand value, profit
margins, cost structure, loyal customer base
Inc attractiveness: growth rate, nature of competition,
entry barrier, market size, substitution, govt regulations
19/07/09
Industry Attractiveness-Competitive Strength Matrix
Low
High
Medium
AverageStrong Weak
6.7
3.3
10.0
1.0
1.03.36.7
High priority for investment Medium priority for investment
Low priority for investment
Competitive Strength
19/07/09
 Internal cash flows are inadequate to fully fund
needs for working capital and new capital investment
 Parent company has to continually pump in capital to
“feed the hog”
 Strategic options
 Aggressively invest in attractive cash hogs
 Divest cash hogs lacking long-term potential
19/07/09
 Generate cash surpluses over and above
what is needed to sustain present market
position
 Such businesses are valuable because
surplus cash can be used to
 Pay corporate dividends
 Finance new acquisitions
 Invest in promising cash hogs
 Strategic objectives
 Fortify and defend present market position
 Keep the business healthy
19/07/09
19/07/09
 Given by – Michael Porter
 Understand how industry structure drives
competition and level of industry profitability
 Evaluate industry attractiveness
 Identify opportunities to change industry
structure
19/07/09
Porter’s Five Forces Model
Suppliers
Substitutes
Buyers
Potential
Entrants
Firm
Rivalry
19/07/09
Threat of Entry & Entry Barriers
 Economies of Scale
 Product Differentiation
 Cost Advantage Independent of Scale
 Contrived Deterrence
 Government Regulation
19/07/09
Economies of Scale
Cost-volume relationship
Ex. Steel
19/07/09
Product Differentiation
 Brand identification
 Customer loyalty
 Trade off between Cost of
differentiation & potential return
19/07/09
Cost Advantages Independent of Scale
 Proprietary Technology
 Know-how & competence
 Favourable access to RM
 Favourable geo. locations
 Learning or Exp. curve
19/07/09
Contrived Deterrence
Investments by the incumbents
with the sole objective to deter
entry
Sending signals
19/07/09
Government Policy
 Regulation - FERA, MRTP, Licensing
 Direct & Indirect Policy Interventions
19/07/09
Other Barriers to Entry
Capital requirements
Size of investment & risks
Switching cost of buyers
Access to existing distribution
channels
Entrant’s expectation abt. retaliation
19/07/09
Exit Barriers
Economic
 Specialised assets - high transfer cost
 Fixed costs of exit
Strategic inter-relationships &
importance - commitment
Emotional barriers
Government and/or social restrictions
19/07/09
Threat of Substitute
 Products that can serve the same utility - satisfy
same customer needs
 Substitutes can replace an industry’s products
 Potentially dangerous substitutes are those that are:
 improving price-performance trade off
 produced by more profitable industries
19/07/09
Bargaining Power of Suppliers
A supplier group is more powerful if -
 Dominated by a few firms & more concentrated
than the industry it sells to
 Highly differentiated products
 No threat of substitute supplies
 Industry is not an important customer
 Buying firms face major switching costs
 It poses a credible threat of forward integration
19/07/09
Bargaining Power of Buyers
 Relative volume purchased by a given buyer
 Cost of purchases as a fraction of tot. purchases
 Importance of the product to buyer
 Availability of substitutes
 Whether product is standard & undifferentiated or
not
 Switching costs faced by both buyers and sellers
 Whether buyer poses a credible threat of backward
integration
 Information available to buyer
19/07/09
Intensity of Rivalry
 Many equally balanced firms
 Slow industry growth
 High fixed costs, high storage cost
 Low product differentiation
 Productive capacity added in large increments
 High strategic stake for some firms
 High exit barriers
19/07/09
Strategic Implications of the
Five Competitive Forces
 Competitive environment is unattractive from
the standpoint of earning good profits when:
 Rivalry is strong
 Entry barriers are low
and entry is likely
 Competition from
substitutes is strong
 Suppliers and customers have considerable
bargaining power
19/07/09
 Main Issue: How key structural features determine rel.
strength of diff. comp. Forces
 Inter-industry variations in rel. strength of five forces
 Short-run factors affecting competition & profitability
 Diff. betn. established competitors & sub., betn.
Existing firms & potential entrants - extended rivalry
19/07/09
Concentration Many firms A few firms Two firms One firm
Entry and Exit
Barriers
Product
Differentiation
Information
No barriers Significant barriers High barriers
Homogeneous
Product
Potential for product differentiation
Perfect
Information flow
Imperfect availability of information
Perfect
Competition
Oligopoly Duopoly Monopoly
Basic Industry Economics
Industry structure
Concentration ratio
 Degree to which industry sales are
dispersed over the leading firms
19/07/09
 One technique for revealing the different competitive
positions of industry rivals.
 Which Companies are in Strongest / Weakest
Positions?
 A strategic group consists of those rivals with
similar competitive approaches in an industry
19/07/09
 Firms in same strategic group have two or
more competitive characteristics in common
 Sell in same price/quality range
 Cover same geographic areas
 Be vertically integrated to same degree
 Have comparable product line breadth
 Emphasize same types of distribution channels
 Offer buyers similar services
 Use identical technological approaches
19/07/09
Procedure for Constructing a
Strategic Group Map
STEP 1: Identify competitive characteristics that
differentiate firms in an industry from one
another
STEP 2: Plot firms on a two-variable map using pairs
of these differentiating characteristics
STEP 3: Assign firms that fall in about the same
strategy space to same strategic group
STEP 4: Draw circles around each group, making
circles proportional to size of group’s
respective share of total industry sales
19/07/09
Guidelines: Strategic Group Maps
 Variables selected as axes should not be highly
correlated
 Variables chosen as axes should expose big
differences in how rivals compete
 Variables do not have to be either quantitative or
continuous
 Drawing sizes of circles proportional to combined
sales of firms in each strategic group allows map to
reflect relative sizes of each strategic group
 If more than two good competitive variables can be
used, several maps can be drawn
19/07/09
Interpreting Strategic Group
Maps
 Driving forces and competitive pressures often
favor some strategic groups and hurt others
 Profit potential of different strategic groups
varies due to strengths and weaknesses in each
group’s market position
 The closer strategic groups are on map, the
stronger the competitive rivalry among
member firms tends to be
19/07/09
Strategic Groups And Rivalry Among Firms
 The presence of several strategic groups will
generally increase rivalry
 Firms will have differing preferences about risk
taking, time horizon, price levels, quality levels,
and so on and will thus increase the likelihood of
repeated outbreaks of warfare.
 The industry with a complicated map of strategic
groups will tend to be more competitive as a whole
than one with few groups.
19/07/09
19/07/09
 SWOT Analysis
 Resource Based View
 Value Chain Analysis
19/07/09
 Strength
 Weakness
 Opportunities
 Threats
19/07/09
What to look for in SWOT
Strengths –
- A powerful Strategy
- Core competencies in….
- Strong Financial Condition
- product innovation capabilities
- strong advertising and promotion
- wide geographic coverage
- superior intellectual capital
and many more….
19/07/09
SWOT cont…
Weaknesses –
- No clear strategic direction
- resources that are not well matched with
industry
- too narrow product line
- weak balance sheet
- lack of innovation – product or process
- In the wrong strategic group
- underutilization of capacities
19/07/09
SWOT cont…
Opportunities
- openings to win market share
- sharp rising buyer demand
- Entering into alliances, JV’s
- Integration- forward and backward
- Emerging technologies
19/07/09
SWOT Cont…
Threats –
- Increasing intensity of rivalry
- slowdown in market growth
- new potential entrant
- shift in buyer needs
- restrictive trade practices
19/07/09
 Systematic approach to examining the
development of competitive advantage.
 M. E. Porter in his book, Competitive Advantage
(1980).
 A series of activities that create and build value.
They culminate in the total value delivered by an
organization.
19/07/09
Value chain
19/07/09
Primary Activities
Support Activities
•Inbound Logistics
•Operations
•Outbound Logistics
•Mktg and Sales
•Service
•Procurement
•Technology
Development
•Human Resource
Management (HRM)
•Firm Infrastructure
19/07/09
Value Chain of Firm
•The combined costs of all the various activities in a
company’s Value Chain define company’s internal cost
structure
•The objective of value chain analysis is to develop data
for comparing a company’s cost activity by activity
against cost’s of key rival’s
•Identify and remove the sources of cost disadvantage and
explore the sources of cost advantage
19/07/09
Value Chain of Rivals differs
 Difference in strategy
 Difference in evolution and expertise
 Difference in process or technology
 Difference in level of integration
19/07/09
Value chain for industry
Activities,
Costs
& margins
of suppliers
Supplier
Related Value
Chains
Internally
performed
activities,
costs and
margins
Activities,
costs and
Margins
Of forward
channels
A company’s
own Value
chain
Buyer or
end user
value chain
Forward Channel's value chain
A company’s cost competitiveness depends not only on internally
performed activities, costs and margins but also on costs in the
value chains of its suppliers and forward channel allies.
19/07/09
Reliance Model
Petro
chemical
Polyester Fabric Readymade
19/07/09
So, What next?
Translating performance of VC activities into
Competitive Advantage
Company
Performs
activities in its
Value chain
Competencies
& Capabilities
Gradually
Emerge in
Certain
important
VC activities
Company
Proficiency in
Performing 1 or
2 VC activities
Rises to level
of core
competence
Company
proficiency in
Performing a
Core
Competence
Continues to
Build
& evolves
Company
Gains a basis
For
‘Sustainable
Competitive
Advantage’
19/07/09

Strategic analysis internal external

  • 1.
  • 2.
  • 3.
     Long termfocus  Sustainable Competitive Advantage  Relevant, accurate, timely market information is the key  Analysis of Self, Customers, Competitors, other interest groups 19/07/09
  • 4.
     Product PortfolioAnalysis  BCG Matrix  GE 9 Cell Matrix  External Environment Analysis  Porter’s Five Forces  Strategic Mapping  Industry Spectrum  Internal Analysis of Company  SWOT  Value Chain Analysis
  • 5.
     BOSTON CONSULTINGGROUP (BCG) MATRIX  Developed by BRUCE HENDERSON in the early 1970’s.  According to this technique, businesses or products are classified as low or high performers depending upon their  market growth rate (cash usages)  relative market share (cash generation) 19/07/09
  • 6.
     Market shareis the percentage of the total market that is being serviced by your company, measured either in revenue terms or unit volume terms.  RELATIVE MARKET SHARE (RMS)  RMS = Business unit sales this year Leading rival sales this year 19/07/09
  • 7.
     Market growthrate is used as a measure of a market’s attractiveness.  MGR = Individual sales - individual sales this year last year Individual sales last year  Markets experiencing high growth are ones where the total market share available is expanding, and there’s plenty of opportunity for everyone to make money. 19/07/09
  • 8.
    BCG matrix isa product portfolio planning tool in which a company’s business units/ products can be classified in to four categories:  Stars  Question marks  Cash cows  Dogs 19/07/09
  • 9.
  • 10.
     Stars areleaders in business.  It leads to large amount of cash generation.  They also require heavy investment, to maintain its large market share. 19/07/09
  • 11.
    CASH COWS Low growth Highmarket share  They are foundation of the company and the stars of yesterday.  They generate more cash than required.  They extract the profits by investing as little cash as possible  They are located in an industry that is mature, not growing or declining. 19/07/09
  • 12.
    DOGS Low growth, Lowmarket share  Dogs are the cash traps.  Dogs do not have potential to bring in much cash.  Number of dogs in the company should be minimized.  Business is situated at a declining stage. 19/07/09
  • 13.
    QUESTION MARKS High growth, Low market share  Most businesses start of as question marks.  They will absorb great amounts of cash if the market share remains unchanged, (ie. low).  Why question marks? Question marks have potential to become star and eventually cash cow but can also become a dog.  Investments should be high for question marks. 19/07/09
  • 14.
    To assess : The CASH FLOW  The development cycles of products  Resource allocation and divestment decisions 19/07/09
  • 15.
  • 16.
  • 17.
    Stars •Hotels •Packaging. •FMCG- Sunfeast •Agri business. ? •FMCG-Others Cows •FMCG-Cigarettes Dogs •Maybe ITC Infotech. 19/07/09
  • 18.
     BCG MATRIXuses only two dimensions, Relative market share and market growth rate.  High market share does not mean profits all the time. Business with low market share can be profitable too.  Problems of getting data on market share and market growth. 19/07/09
  • 19.
     Developed byGE, USA  Overcomes key limitation of BCG matrix  Also called Industry Attractiveness- Competitive Strength Matrix 19/07/09
  • 20.
    Competititve strength: marketshare, brand value, profit margins, cost structure, loyal customer base Inc attractiveness: growth rate, nature of competition, entry barrier, market size, substitution, govt regulations 19/07/09
  • 21.
    Industry Attractiveness-Competitive StrengthMatrix Low High Medium AverageStrong Weak 6.7 3.3 10.0 1.0 1.03.36.7 High priority for investment Medium priority for investment Low priority for investment Competitive Strength 19/07/09
  • 22.
     Internal cashflows are inadequate to fully fund needs for working capital and new capital investment  Parent company has to continually pump in capital to “feed the hog”  Strategic options  Aggressively invest in attractive cash hogs  Divest cash hogs lacking long-term potential 19/07/09
  • 23.
     Generate cashsurpluses over and above what is needed to sustain present market position  Such businesses are valuable because surplus cash can be used to  Pay corporate dividends  Finance new acquisitions  Invest in promising cash hogs  Strategic objectives  Fortify and defend present market position  Keep the business healthy 19/07/09
  • 24.
  • 25.
     Given by– Michael Porter  Understand how industry structure drives competition and level of industry profitability  Evaluate industry attractiveness  Identify opportunities to change industry structure 19/07/09
  • 26.
    Porter’s Five ForcesModel Suppliers Substitutes Buyers Potential Entrants Firm Rivalry 19/07/09
  • 27.
    Threat of Entry& Entry Barriers  Economies of Scale  Product Differentiation  Cost Advantage Independent of Scale  Contrived Deterrence  Government Regulation 19/07/09
  • 28.
    Economies of Scale Cost-volumerelationship Ex. Steel 19/07/09
  • 29.
    Product Differentiation  Brandidentification  Customer loyalty  Trade off between Cost of differentiation & potential return 19/07/09
  • 30.
    Cost Advantages Independentof Scale  Proprietary Technology  Know-how & competence  Favourable access to RM  Favourable geo. locations  Learning or Exp. curve 19/07/09
  • 31.
    Contrived Deterrence Investments bythe incumbents with the sole objective to deter entry Sending signals 19/07/09
  • 32.
    Government Policy  Regulation- FERA, MRTP, Licensing  Direct & Indirect Policy Interventions 19/07/09
  • 33.
    Other Barriers toEntry Capital requirements Size of investment & risks Switching cost of buyers Access to existing distribution channels Entrant’s expectation abt. retaliation 19/07/09
  • 34.
    Exit Barriers Economic  Specialisedassets - high transfer cost  Fixed costs of exit Strategic inter-relationships & importance - commitment Emotional barriers Government and/or social restrictions 19/07/09
  • 35.
    Threat of Substitute Products that can serve the same utility - satisfy same customer needs  Substitutes can replace an industry’s products  Potentially dangerous substitutes are those that are:  improving price-performance trade off  produced by more profitable industries 19/07/09
  • 36.
    Bargaining Power ofSuppliers A supplier group is more powerful if -  Dominated by a few firms & more concentrated than the industry it sells to  Highly differentiated products  No threat of substitute supplies  Industry is not an important customer  Buying firms face major switching costs  It poses a credible threat of forward integration 19/07/09
  • 37.
    Bargaining Power ofBuyers  Relative volume purchased by a given buyer  Cost of purchases as a fraction of tot. purchases  Importance of the product to buyer  Availability of substitutes  Whether product is standard & undifferentiated or not  Switching costs faced by both buyers and sellers  Whether buyer poses a credible threat of backward integration  Information available to buyer 19/07/09
  • 38.
    Intensity of Rivalry Many equally balanced firms  Slow industry growth  High fixed costs, high storage cost  Low product differentiation  Productive capacity added in large increments  High strategic stake for some firms  High exit barriers 19/07/09
  • 39.
    Strategic Implications ofthe Five Competitive Forces  Competitive environment is unattractive from the standpoint of earning good profits when:  Rivalry is strong  Entry barriers are low and entry is likely  Competition from substitutes is strong  Suppliers and customers have considerable bargaining power 19/07/09
  • 40.
     Main Issue:How key structural features determine rel. strength of diff. comp. Forces  Inter-industry variations in rel. strength of five forces  Short-run factors affecting competition & profitability  Diff. betn. established competitors & sub., betn. Existing firms & potential entrants - extended rivalry 19/07/09
  • 41.
    Concentration Many firmsA few firms Two firms One firm Entry and Exit Barriers Product Differentiation Information No barriers Significant barriers High barriers Homogeneous Product Potential for product differentiation Perfect Information flow Imperfect availability of information Perfect Competition Oligopoly Duopoly Monopoly
  • 42.
    Basic Industry Economics Industrystructure Concentration ratio  Degree to which industry sales are dispersed over the leading firms 19/07/09
  • 43.
     One techniquefor revealing the different competitive positions of industry rivals.  Which Companies are in Strongest / Weakest Positions?  A strategic group consists of those rivals with similar competitive approaches in an industry 19/07/09
  • 44.
     Firms insame strategic group have two or more competitive characteristics in common  Sell in same price/quality range  Cover same geographic areas  Be vertically integrated to same degree  Have comparable product line breadth  Emphasize same types of distribution channels  Offer buyers similar services  Use identical technological approaches 19/07/09
  • 45.
    Procedure for Constructinga Strategic Group Map STEP 1: Identify competitive characteristics that differentiate firms in an industry from one another STEP 2: Plot firms on a two-variable map using pairs of these differentiating characteristics STEP 3: Assign firms that fall in about the same strategy space to same strategic group STEP 4: Draw circles around each group, making circles proportional to size of group’s respective share of total industry sales 19/07/09
  • 46.
    Guidelines: Strategic GroupMaps  Variables selected as axes should not be highly correlated  Variables chosen as axes should expose big differences in how rivals compete  Variables do not have to be either quantitative or continuous  Drawing sizes of circles proportional to combined sales of firms in each strategic group allows map to reflect relative sizes of each strategic group  If more than two good competitive variables can be used, several maps can be drawn 19/07/09
  • 47.
    Interpreting Strategic Group Maps Driving forces and competitive pressures often favor some strategic groups and hurt others  Profit potential of different strategic groups varies due to strengths and weaknesses in each group’s market position  The closer strategic groups are on map, the stronger the competitive rivalry among member firms tends to be 19/07/09
  • 48.
    Strategic Groups AndRivalry Among Firms  The presence of several strategic groups will generally increase rivalry  Firms will have differing preferences about risk taking, time horizon, price levels, quality levels, and so on and will thus increase the likelihood of repeated outbreaks of warfare.  The industry with a complicated map of strategic groups will tend to be more competitive as a whole than one with few groups. 19/07/09
  • 49.
  • 50.
     SWOT Analysis Resource Based View  Value Chain Analysis 19/07/09
  • 51.
     Strength  Weakness Opportunities  Threats 19/07/09
  • 52.
    What to lookfor in SWOT Strengths – - A powerful Strategy - Core competencies in…. - Strong Financial Condition - product innovation capabilities - strong advertising and promotion - wide geographic coverage - superior intellectual capital and many more…. 19/07/09
  • 53.
    SWOT cont… Weaknesses – -No clear strategic direction - resources that are not well matched with industry - too narrow product line - weak balance sheet - lack of innovation – product or process - In the wrong strategic group - underutilization of capacities 19/07/09
  • 54.
    SWOT cont… Opportunities - openingsto win market share - sharp rising buyer demand - Entering into alliances, JV’s - Integration- forward and backward - Emerging technologies 19/07/09
  • 55.
    SWOT Cont… Threats – -Increasing intensity of rivalry - slowdown in market growth - new potential entrant - shift in buyer needs - restrictive trade practices 19/07/09
  • 56.
     Systematic approachto examining the development of competitive advantage.  M. E. Porter in his book, Competitive Advantage (1980).  A series of activities that create and build value. They culminate in the total value delivered by an organization. 19/07/09
  • 57.
  • 58.
    Primary Activities Support Activities •InboundLogistics •Operations •Outbound Logistics •Mktg and Sales •Service •Procurement •Technology Development •Human Resource Management (HRM) •Firm Infrastructure 19/07/09
  • 59.
    Value Chain ofFirm •The combined costs of all the various activities in a company’s Value Chain define company’s internal cost structure •The objective of value chain analysis is to develop data for comparing a company’s cost activity by activity against cost’s of key rival’s •Identify and remove the sources of cost disadvantage and explore the sources of cost advantage 19/07/09
  • 60.
    Value Chain ofRivals differs  Difference in strategy  Difference in evolution and expertise  Difference in process or technology  Difference in level of integration 19/07/09
  • 61.
    Value chain forindustry Activities, Costs & margins of suppliers Supplier Related Value Chains Internally performed activities, costs and margins Activities, costs and Margins Of forward channels A company’s own Value chain Buyer or end user value chain Forward Channel's value chain A company’s cost competitiveness depends not only on internally performed activities, costs and margins but also on costs in the value chains of its suppliers and forward channel allies. 19/07/09
  • 62.
  • 63.
    So, What next? Translatingperformance of VC activities into Competitive Advantage Company Performs activities in its Value chain Competencies & Capabilities Gradually Emerge in Certain important VC activities Company Proficiency in Performing 1 or 2 VC activities Rises to level of core competence Company proficiency in Performing a Core Competence Continues to Build & evolves Company Gains a basis For ‘Sustainable Competitive Advantage’ 19/07/09