Download to read offline

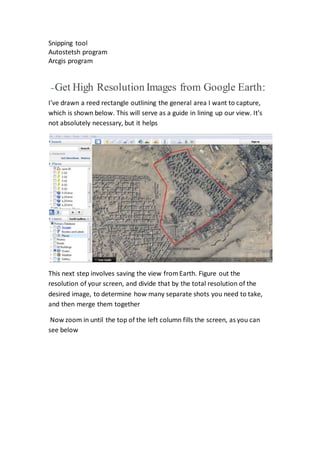


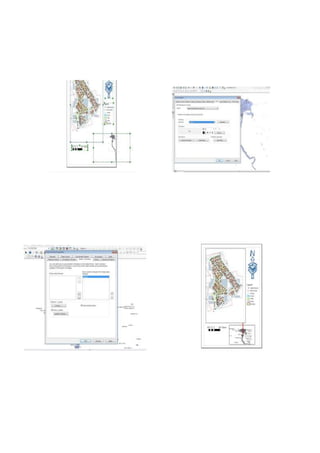
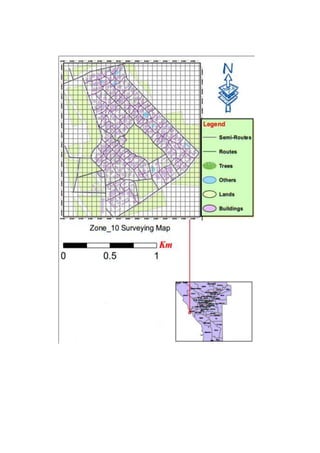


The document provides an overview of the ArcGIS software program, detailing its components: ArcCatalog, ArcMap, and ArcToolbox, and their respective functionalities. It outlines steps for map design, from importing high-resolution images from Google Earth to digitizing and creating shapefiles for geospatial data analysis. Additionally, it describes the integration of ArcGIS with MS Word and Excel for producing reports and visualizations.