The document discusses methodologies for analyzing cannabis products for safety and potency using LC-UV techniques along with MS/MS identification of cannabinoids. It highlights the need for robust quality control methods due to the increasing legality and demand for cannabis products, detailing specific extraction and analytical processes. Additionally, the findings point to improved efficiency and resolution in the chromatography of cannabis extracts, ensuring accurate potency classification.

![4 www.mn-net.com
Potency testing in cannabis extracts using LC–UV approach
Potency testing in cannabis extracts using a LC–UV
approach with additional MS/MS identification
MACHEREY-NAGEL application department · Dr. H. R. Wollseifen, T. Kretschmer
Abstract
This application note describes the determination of cannabinoids
in Cannabis sativa using a LC–UV approach. Cannabis sativa was
extracted according to DAC/NRF monograph and analyzed by
HPLC–UV on a NUCLEOSHELL RP 18 column. Identification of
contained cannabinoids was performed by HPLC–UV–MS/MS.
®
Introduction
With the legalization of medical and recreational use of cannabis
and cannabis-based products (e.g. concentrated oils, soda, LC Method Parameters
candy and other edible forms) the need of quality control method-
ologies has grown year by year [1]. There is an increasing supply
of various cannabis and cannabis-based products with adjusted
potency. To verify the potency classification, the determination
of cannabinoids in marijuana has become an important meth-
odology of quality control for producers and distributors. Addi-
tionally, the cannabinoid profile in combination with the terpene
profile is an important information that helps to determine the
plant variety. Sample preparation has been carried out according
to DAC/NRF regulations [2].
New quality control methods have to be developed to ensure
product safety and to treat patients with the right amount of drug.
These methods have to be quick, easy and cost-efficient. Using
NUCLEOSHELL core-shell particle technology, highest column
efficiency and resolution at a short run time with much lower back
pressure compared to fully porous particles could be achieved
with common HPLC systems.
®
This work presents a quick, easy and cost-efficient LC–UV
method for the simultaneous analysis of cannabinoids from Can-
nabis sativa. In addition, cannabinoids were identified by LC–MS/
MS.
Sample pretreatment
Sample material
Three varieties of Cannabis sativa of different potency classes
were purchased:
I: Δ⁹-tetrahydrocannabinol >> cannabidiol
II: Δ⁹-tetrahydrocannabinol ≈ cannabidiol
III: Δ⁹-tetrahydrocannabinol << cannabidiol
Extraction
n Weigh out 0.5 g of homogenized sample (milled in a grinder)
into a 50 mL centrifuge tube (REF 730223)
n Add 20 mL ethanol and shake for 15 min
n Centrifuge the mixture at 4500 rpm, for 5 min at 4 °C
n Fill the supernatant in a 50 mL flask
n Repeat extraction of the residue twice with 12.5 mL of ethanol
and combine the extracts
n Fill up the flask to 50 mL with ethanol
n Filter 1 ml of the extract through a syringe filter with regener-
ated cellulose (membrane pore size 0.45 µm, REF 729231)
into a 10 mL flask
n Fill up with ethanol to 10 mL
n Use this mixture for HPLC analysis (REF 702293, REF 702107)
Chromatographic conditions
Column: EC NUCLEOSHELL RP 18, 50
2.7 µm (REF 763152.40)
x 4 mm,®
Eluent A: 0.1 % formic acid in water
Eluent B: 0.1 % formic acid in acetonitrile
Gradient: in 5 min from 60 % to 95 % B, hold for
5.0 min, in 0.1 min to 60 % B, hold 60 % B
for 4.9 min
Flow rate: 0.7 mL/min
Temperature: 40 °C
Injection volume: 1 μL
Detection: UV @ 225 nm, 306 nm
MS conditions for peak identification
AB Sciex API 3200
Acquisition mode: SRM
Interface: ESI
Polarity: positive/negative
Curtain gas: 20 psig
CAD: 3.0 psig
Ion spray voltage, ESI positive: 4500 V
Ion spray voltage, ESI negative: – 4500 V
Temperature: 500 °C
Ion source gas 1: 45 psig
Ion source gas 2: 45 psig
Detection window: 90 s
Injection volume: 5 µL
Sample solution from LC–UV was diluted ten times with methanol
for identification with positive polarity and 100 times with metha-
nol for identification with negative polarity because of high analyte
concentration of cannabinoids in cannabis extracts.](https://image.slidesharecdn.com/brochure-cannabis-testing-en-200817133349/85/Macherey-Nagel-Cannabis-Testing-Brochure-4-320.jpg)
![5www.mn-net.com
Potency testing in cannabis extracts using LC–UV approach
MRM transitions
Analyte Abbr. [M+H]+
Q1 Q2
Cannabigerol CBG 317.2 193.1 123.1
Cannabidiol CBD 315.1 193.1 259.1
Cannabinol CBN 311.1 223.2 241.0
Δ⁹-tetrahydrocannabinol THC 315.1 193.1 259.1
Cannabichromene CBC 315.1 193.1 81.0
Table 1: MRM transitions of cannabinoids from Cannabis sativa (positive po-
larity). (Abbr. = Abbreviation, Q 1
= Quantifier, Q 2
= Qualifier)
Analyte Abbr. [M-H]–
Q1 Q2
Cannabidiolic acid CBDA 357.1 313.1 245.0
Cannabigerolic acid CBGA 359.1 341.2 315.2
Δ -tetrahydrocannabinolic acid9
THCA 357.1 313.1 191.0
Table 2:MRM transitions of cannabinoids from Cannabis sativa (negative po-
larity). (Abbr. = Abbreviation, Q 1
= Quantifier, Q 2
= Qualifier)
Batch-to-batch reproducibility of NUCLEOSHELL
RP 18 columns
®
200
150
100
50
0
-50
-100
0.00 1.00 2.00 3.00 4.00 5.00 6.00 7.00
Time [min]
Absorbance[mAU]
Figure 1: Comparison of chromatograms from an extract of Cannabis sativa (va-
riety class II: Δ⁹-tetrahydrocannabinol ≈ cannabidiol) on four different
batches of NUCLEOSHELL RP 18, UV-VIS 1 = 225 nm.®
Representative chromatograms
300
200
100
0
-100
0.00 1.00 2.00 3.00 4.00 5.00 6.00
Time [min]
CBGA-2.725
CBN-3.600
THC-4.017
THCA-4.433
Absorbance[mAU]
Figure 3: Chromatogram of an extract from Cannabis sativa (variety class I:
Δ⁹-tetrahydrocannabinol >> cannabidiol), UV-VIS 1 = 225 nm, UV-VIS
2 = 306 nm.
200
150
100
50
0
-50
-100
0.00 1.00 2.00 3.00 4.00 5.00 6.00 7.00
Time [min]
CBDA-2.617
CBGA-2.725
CBD-2.975
THC-4.008
THCA-4.425
Absorbance[mAU]
Figure 4: Chromatogram of an extract from Cannabis sativa (variety class II:
Δ⁹-tetrahydrocannabinol ≈ cannabidiol), UV-VIS 1 = 225 nm, UV-VIS
2 = 306 nm.
250
200
150
100
50
0
-50
-100
0.00 1.00 2.00 3.00 4.00 5.00 6.00 7.00
Time [min]
CBDA-2.617
CBD-2.975
THCA-4.433
Absorbance[mAU]
Figure 5: Chromatogram of an extract from Cannabis sativa (variety class III:
Δ⁹-tetrahydrocannabinol << cannabidiol), UV-VIS 1 = 225 nm, UV-VIS
2 = 306 nm.
Figure 2: Marijuana plant leaves.](https://image.slidesharecdn.com/brochure-cannabis-testing-en-200817133349/85/Macherey-Nagel-Cannabis-Testing-Brochure-5-320.jpg)
![6 www.mn-net.com
Potency testing in cannabis extracts using LC–UV approach
Batch-to-batch reproducibility of Cannabis sativa samples
200
150
100
50
0
-50
-100
0.00 1.00 2.00 3.00 4.00 5.00 6.00 7.00
Time [min]
CBDA-2.617
CBD-2.975
THC-4.017
THCA-4.433
Absorbance[mAU]
Figure 6: Comparison of chromatograms from an extract of Cannabis sativa (va-
riety class II: Δ⁹-tetrahydrocannabinol ≈ cannabidiol) on three different
batches, UV-VIS 1 = 225 nm, UV-VIS 2 = 306 nm, batch 1.
200
150
100
50
0
-50
-100
0.00 1.00 2.00 3.00 4.00 5.00 6.00 7.00
Time [min]
CBDA-2.617
CBD-2.975
THC-4.008
THCA-4.425
Absorbance[mAU]
Figure 8: Comparison of chromatograms from an extract of Cannabis sativa (va-
riety class II: Δ⁹-tetrahydrocannabinol ≈ cannabidiol) on three different
batches, UV-VIS 1 = 225 nm, UV-VIS 2 = 306 nm, batch 2.
200
150
100
50
0
-50
-100
0.00 1.00 2.00 3.00 4.00 5.00 6.00 7.00
Time [min]
CBDA-2.617
CBD-2.975
THC-4.008
THCA-4.425
Absorbance[mAU]
Figure 9: Comparison of chromatograms from an extract of Cannabis sativa (va-
riety class II: Δ⁹-tetrahydrocannabinol ≈ cannabidiol) on three different
batches, UV-VIS 1 = 225 nm, UV-VIS 2 = 306 nm, batch 3.
Peak number Peak name Ret. time [min] Area batch 1 Area batch 2 Area batch 3 Peak ratio
batch 1
Peak ratio
batch 2
Peak ratio
batch 3
1 CBDA 2.62 4.463 4.295 4.019 0.582 0.578 0.575
4 CBD 2.98 0.545 0.568 0.528 0.071 0.076 0.076
6 THC 4.01 0.779 0.791 0.717 0.102 0.106 0.103
7 THCA 4.43 1.879 1.780 1.721 0.245 0.239 0.246
Peak number Peak name Ret. time [min] Area batch 1 Area batch 2 Area batch 3 Peak ratio
batch 1
Peak ratio
batch 2
Peak ratio
batch 3
1 CBDA 2.62 0.727 0.706 0.683 0.639 0.645 0.641
2 THCA 4.43 0.412 0.388 0.381 0.361 0.355 0.359
Table 3:Comparison of peak area and peak ratio from an extract of Cannabis sativa (variety class II: Δ⁹-tetrahydrocannabinol ≈ cannabidiol) on three different
batches, UV-VIS 1 = 225 nm, UV-VIS 2 = 306 nm, batch 1–3.](https://image.slidesharecdn.com/brochure-cannabis-testing-en-200817133349/85/Macherey-Nagel-Cannabis-Testing-Brochure-6-320.jpg)
![7www.mn-net.com
Potency testing in cannabis extracts using LC–UV approach
MS/MS identification of cannabinoids
9.0e4
8.0e4
6.0e4
4.0e4
2.0e4
0.0
3.5e4
3.0e4
2.0e4
1.0e4
0.0
1.6 1.8 2.0 2.2 2.4 2.6 2.8 3.0 3.2 3.4 3.6 3.8 4.0 4.2 4.4 4.6 4.8 5.0
Time [min]
1.3e4
1.0e4
5.0e3
0.0
5.0e5
4.0e5
3.0e5
2.0e5
1.0e5
0.0
2.3e4
2.0e4
1.5e4
1.0e4
5.0e3
0.0
1.6 1.8 2.0 2.2 2.4 2.6 2.8 3.0 3.2 3.4 3.6 3.8 4.0 4.2 4.4 4.6 4.8 5.0
Time [min]
2.0 2.5 3.0 3.5 4.0 4.5 5.0 5.5 6.0
Time [min]
2.5 3.0 3.5 4.0 4.5 5.0 5.5 6.0 6.5
Time [min]
3.8 4.0 4.2 4.4 4.6 4.8 5.0 5.2 5.4 5.6 5.8 6.0 6.2 6.4 6.6 6.8 7.0
Time [min]
CBG - 317.152/193.100
CBD - 315.127/193.100
CBN - 311.086/223.200
THC - 315.127/193.100
CBC - 315.127/193.100
Intensity[cps]Intensity[cps]Intensity[cps]Intensity[cps]Intensity[cps]
Figure 10: Chromatogram of an extract from Cannabis sativa (variety class II:
Δ⁹-tetrahydrocannabinol ≈ cannabidiol) (positive polarity).
4.3e4
4.0e4
3.5e4
3.0e4
2.5e4
2.0e4
1.5e4
1.0e4
5.0e3
0.0
3.5e4
3.0e4
2.5e4
2.0e4
1.5e4
1.0e4
5.0e3
0.0
1.3e5
1.2e5
1.0e5
8.0e4
6.0e4
4.0e4
2.0e4
0.0
1.8 2.0 2.2 2.4 2.6 2.8 3.0 3.2 3.4 3.6 3.8 4.0 4.2 4.4
Time [min]
1.4 1.6 1.8 2.0 2.2 2.4 2.6 2.8 3.0 3.2 3.4 3.6 3.8 4.0 4.2 4.4
Time [min]
2.5 3.0 3.5 4.0 4.5 5.0 5.5 6.0 6.5
Time [min]
CBDA - 357.100/313.100
CBGA - 359.121/341.200
THCA - 357.100/313.100
Intensity[cps]Intensity[cps]Intensity[cps]
Figure 11: Chromatogram of an extract from Cannabis sativa (variety class II:
Δ⁹-tetrahydrocannabinol ≈ cannabidiol) (negative polarity).
Conclusion
This application note shows a simple chromatographic sepa-
ration of major cannabinoids from marijuana samples in less
than ten minutes. A good batch-to-batch reproducibility of
NUCLEOSHELL RP 18 can be seen in figure 1. In this work,
the cannabinoid profile of three different cannabis varieties could
be shown and sample materials could be successfully assigned
to their described potency class. The figures 6, 8, and 9 show a
batch-to-batch reproducibility of three different marijuana sam-
ples of the same variety.
®
The separation was achieved with sufficient resolution for major
cannabinoids and is suitable for qualification and quantification. In
addition, the identification of cannabinoids by mass spectrometry
was successfully performed with presented chromatographic
conditions on a NUCLEOSHELL RP 18 column.®
References
[1] R. L. Pacula, R. Smart Annu. Rev. Clin. Psychol. 2017 May 8;
13: 397–419.
[2] DAC/NRF 2016/1, C-053, Cannabisblüten (Cannabis flos).](https://image.slidesharecdn.com/brochure-cannabis-testing-en-200817133349/85/Macherey-Nagel-Cannabis-Testing-Brochure-7-320.jpg)
![8 www.mn-net.com
Pesticide residues in cannabis
Determination of pesticide residues in Canna-
bis sativa using an optimized QuEChERS meth-
od with a low amount of carbon in the clean-up
mix
MACHEREY-NAGEL application department · Dr. H. R. Wollseifen, T. Kretschmer
Abstract
This application note describes the determination of pesticide res-
idues in Cannabis sativa using a QuEChERS method for sample
clean-up. Interfering substances (like e.g., lipids and pigments),
which were also extracted with the organic layer, are removed
by optimized amounts of GCB (graphitized carbon black) and
CHROMABOND C ec adsorbents. The organic extracts are
finally analyzed by HPLC-MS/MS.
®
18
Introduction
There is an increasing interest in the determination of pesticide
residues in marijuana. While medical and recreational use of can-
nabis are legalized in more and more U.S. territories, the markets n Add 100 μL of standard solution (β = 1 µg/mL for each analyte
for cannabis and cannabis-based products (e.g. concentrated
oils, soda, candy and other drinkable or edible forms) have grown
year by year in North America and also in other countries . To
saturate the huge demand for marijuana the cultivation of hemp
gets professional to improve growth yields. The use of pesticides
is a common tool for this monocultural plant production.
[1]
New quality control methods have to be developed to ensure
pro-duct safety and to reduce health risks by chronic exposure n Centrifuge the mixture at 4500 rpm, for 5 min at 4 °C
to pesticides. These methods have to be quick, easy, cheap, ef-
fective, rugged and safe like the QuEChERS extraction approach
[2]
. Interfering substances (like e.g., lipids and chlorophyll), which
were also extracted with the organic layer, are removed by opti-
mized clean-up mixes. On the other side, the composition of the
clean-up mix has to ensure high recovery rates for pesticides, n Centrifuge the mixture at 4500 rpm, for 5 min at 4 °C
as well as adequate matrix removal properties. Therefor the
respective mix needs to contain a sufficient amount of carbon
adsorbent.
This work presents a QuEChERS method for the simultaneous
analysis of more than 160 pesticides from Cannabis sativa. The
organic extracts are finally analyzed by HPLC-MS/MS. Column:
Figure 1: Marijuana (Cannabis sativa).
Dispersive solid phase extraction (dSPE)
Products for clean-up from competitors
Competitor 1:
QuEChERS dispersive kit, 15 mL centrifuge tube, 1200
MgSO , 400 mg PSA, 400 mg C ec, 45 mg GCB
mg
4 18
Competitor 2:
QuEChERS SPE Q-sep, 15 mL centrifuge tube, 900 mg MgSO ,4
300 mg PSA, 300 mg C , 45 mg GCB18
Extraction
n
Weigh out 1g of homogenized sample (milled in a grinder) into
a 50 mL centrifuge tube (REF 730223)
in acetonitrile) for determining recovery rates
n Add 10 mL water and shake
n Add 10 mL 1 % acetic acid in acetonitrile and shake for 30 min
n Add the CHROMABOND QuEChERS extraction mix I
(REF 730970)
®
n Shake vigorously for 2 min and cool down the mixture in an ice bath
Clean-up
n
Add 6 mL of acetonitrile supernatant to the CHROMABOND
QuEChERS clean-up mix XLIX (REF 7300000)
®
n Shake vigorously for 60 s
n Take acetonitrile extract for injection
Subsequent analysis: HPLC-MS / MS
Chromatographic conditions
EC NUCLEOSHELL Bluebird RP 18,®
50 x 4.6 mm, 2.7 µm (REF 763432.46)
Eluent A: 0.1 % formic acid in water
Eluent B: 0.1 % formic acid in acetonitrile
Gradient: in 5 min from 5 % to 100 % B, hold for
1.0 min, in 0.1 min to 5 % B, hold 5 % B for
3.9 min
Flow rate: 0.7 mL/min
Temperature: 30 °C
Injection volume: 2 μL](https://image.slidesharecdn.com/brochure-cannabis-testing-en-200817133349/85/Macherey-Nagel-Cannabis-Testing-Brochure-8-320.jpg)
![9www.mn-net.com
Pesticide residues in cannabis
MS conditions
AB Sciex QTRAP 5500
Acquisition mode: SRM
Interface: ESI
Polarity: positive
Curtain gas: 35 psig
Collision gas: medium
Ion spray voltage: 5000 V
Temperature: 450 °C
Ion source gas 1: 45 psig
Ion source gas 2: 45 psig
Detection window: 60 s
MRM transitions
Analyte RT [min] Q Mass [Da]1 Q Mass [Da]3
Cyromazine.1 0.88 167.1 85.1
Cyromazine.2 0.88 167.1 125.1
Propamocarb.1 1.45 189.2 102.1
Propamocarb.2 1.46 189.2 74.0
Aminocarb.1 1.49 209.2 137.2
Aminocarb.2 1.49 209.2 152.2
Formetanate HCl.1 1.52 222.3 165.0
Formetanate HCl.2 1.52 222.3 120.1
Pymetrozine.1 1.56 218.1 105.0
Pymetrozine.2 1.56 218.1 78.0
Acephate.1 1.61 184.1 143.0
Acephate.2 1.62 184.1 49.0
Omethoate.1 1.83 214.1 183.0
Omethoate.2 1.84 214.1 125.1
Nitenpyram.1 1.88 271.1 224.9
Nitenpyram.2 1.88 271.1 126.1
Aldicarb sulfoxide.1 1.98 207.1 132.1
Aldicarb sulfoxide.2 1.98 207.1 89.1
Carbendazim.1 1.98 192.1 160.1
Carbendazim.2 1.98 192.1 132.1
Dinotefuran.1 2.03 203.0 129.0
Dinotefuran.2 2.03 203.0 157.0
Mexacarbate.1 2.08 223.1 166.1
Mexacarbate.2 2.08 223.1 151.1
Aldicarb sulfone.1 2.10 240.0 86.0
Aldicarb sulfone.2 2.10 240.0 148.0
Oxamyl.1 2.22 237.2 90.0
Oxamyl.2 2.22 237.2 72.1
Flonicamid.1 2.36 230.2 203.1
Flonicamid.2 2.36 230.2 174.0
Methomyl.1 2.39 163.1 106.0
Methomyl.2 2.39 163.1 88.1
Thiamethoxam.1 2.52 292.2 181.2
Thiamethoxam.2 2.52 292.2 211.0
Monocrotophos.1 2.56 224.1 127.1
Analyte RT [min] Q Mass [Da]1 Q Mass [Da]3
Monocrotophos.2 2.56 224.1 98.1
Ethirimol.1 2.68 210.2 140.2
Ethirimol.2 2.68 210.2 98.1
Dicrotophos.1 2.70 238.1 112.1
Dicrotophos.2 2.70 238.1 193.0
Pirimicarb.1 2.75 239.2 72.1
Pirimicarb.2 2.75 239.2 182.0
Trichlorfon.1 2.89 257.0 109.0
Imidacloprid.1 2.90 256.2 175.0
Imidacloprid.2 2.90 256.2 209.0
Clothianidin.1 2.91 250.2 169.1
Clothianidin.2 2.91 250.2 132.1
Fenuron.1 2.95 165.1 46.0
Fenuron.2 2.95 165.1 72.0
Vamidothion.1 2.98 288.1 146.1
Vamidothion.2 2.98 288.1 118.1
3-Hydroxycarbofuran.1 3.00 238.2 181.0
3-Hydroxycarbofuran.2 3.00 238.2 163.1
Dimethoate.1 3.05 230.1 198.8
Dimethoate.2 3.05 230.1 125.0
Acetamiprid.1 3.14 223.1 126.1
Acetamiprid.2 3.14 223.1 99.0
Cymoxanil.1 3.17 199.2 128.1
Cymoxanil.2 3.17 199.2 111.0
Simetryn.1 3.27 214.2 124.2
Simetryn.2 3.27 214.2 144.1
Prometon.1 3.31 226.2 142.1
Prometon.2 3.31 226.2 86.0
Terbumeton.1 3.32 226.2 170.0
Terbumeton.2 3.32 226.2 100.0
Secbumeton.1 3.33 226.2 170.0
Secbumeton.2 3.33 226.2 100.0
Mevinphos isomer 2.1 3.34 225.1 127.0
Mevinphos isomer 2.2 3.34 225.1 192.9
Mevinphos isomer 1.1 3.35 225.1 127.0
Mevinphos isomer 1.2 3.35 225.1 192.9
Butocarboxim.1 3.40 213.0 75.0
Imazalil.1 3.40 297.1 201.0
Imazalil.2 3.40 297.1 159.0
Thiacloprid.1 3.40 253.1 126.0
Thiacloprid.2 3.40 253.1 99.1
Butocarboxim.1 3.43 213.0 75.0
Butocarboxim.2 3.43 213.0 116.0
Aldicarb.1 3.44 208.1 116.0
Aldicarb.2 3.44 208.1 89.0
Tricyclazole.1 3.52 190.1 163.0
Tricyclazole.2 3.52 190.1 136.0
Mesotrione.1 3.56 340.1 228.0
Mesotrione.2 3.56 340.1 104.1
Oxadixyl.1 3.58 279.1 219.1](https://image.slidesharecdn.com/brochure-cannabis-testing-en-200817133349/85/Macherey-Nagel-Cannabis-Testing-Brochure-9-320.jpg)
![10 www.mn-net.com
Pesticide residues in cannabis
Analyte RT [min] Q Mass [Da]1 Q Mass [Da]3
Oxadixyl.2 3.58 279.1 132.1
Carbetamide.1 3.62 237.1 192.1
Carbetamide.2 3.62 237.1 118.2
Ametryn.1 3.66 228.1 186.0
Ametryn.2 3.66 228.1 96.0
Fenpropimorph.1 3.70 304.3 147.0
Fenpropimorph.2 3.70 304.3 117.2
Methoprotryne.1 3.76 272.2 198.0
Methoprotryne.2 3.76 272.2 240.0
Propoxur.1 3.76 210.1 168.1
Propoxur.2 3.76 210.1 111.0
Thiophanate-methyl.1 3.77 343.2 151.0
Thiophanate-methyl.2 3.77 343.2 311.1
Metribuzin.1 3.78 215.2 187.0
Metribuzin.2 3.78 215.2 84.1
Spiroxamine isomer 1.1 3.79 298.2 144.2
Spiroxamine isomer 1.2 3.79 298.2 100.1
Spiroxamine isomer 2.1 3.79 298.2 144.2
Spiroxamine isomer 2.2 3.79 298.2 100.1
Carbofuran.1 3.81 222.0 165.0
Carbofuran.2 3.81 222.0 123.0
Bendiocarb.1 3.83 224.1 167.1
Bendiocarb.2 3.83 224.1 109.0
Thidiazuron.1 3.84 221.1 102.1
Thidiazuron.2 3.84 221.1 127.9
Sulfentrazone.1 3.85 387.0 307.0
Sulfentrazone.2 3.85 387.0 146.0
Tebuthiuron.1 3.87 229.2 172.1
Tebuthiuron.2 3.87 229.2 116.0
Carbaryl.1 3.98 202.1 145.2
Carbaryl.2 3.98 202.1 127.1
Prometryne.1 3.99 242.2 158.1
Prometryne.2 3.99 242.2 200.1
Carboxin.1 4.00 236.1 143.1
Carboxin.2 4.00 236.1 87.1
Terbutryn.1 4.02 242.2 186.0
Terbutryn.2 4.00 242.2 68.1
Pyrimethanil.1 4.02 200.2 107.0
Pyrimethanil.2 4.02 200.2 82.2
Ethiofencarb.1 4.04 226.2 107.1
Ethiofencarb.2 4.03 226.2 164.0
Monolinuron.1 4.05 215.1 126.1
Monolinuron.2 4.05 215.1 99.0
Fluometuron.1 4.08 233.0 72.0
Flutriafol.1 4.14 302.2 70.1
Flutriafol.2 4.15 302.2 123.0
Chlorotoluron.1 4.15 213.1 72.2
Chlorotoluron.2 4.15 213.1 46.0
Propham.1 4.15 180.1 138.1
Propham.2 4.16 180.1 120.1
Analyte RT [min] Q Mass [Da]1 Q Mass [Da]3
Isoprocarb.1 4.16 194.1 95.1
Isoprocarb.2 4.16 194.1 137.0
Metobromuron.1 4.17 259.1 169.9
Metobromuron.2 4.18 259.1 148.2
Metalaxyl.1 4.21 280.2 220.3
Metalaxyl.2 4.21 280.2 192.0
Isoproturon.1 4.23 207.1 72.1
Isoproturon.2 4.23 207.1 46.1
Methabenzthiazuron.1 4.25 222.1 165.0
Methabenzthiazuron.2 4.25 222.1 150.0
Butoxycarboxim.1 4.26 223.1 106.0
Butoxycarboxim.2 4.26 223.1 166.0
Cycluron.1 4.29 199.2 89.0
Cycluron.2 4.29 199.2 89.1
Forchlorfenuron.1 4.29 248.1 129.0
Forchlorfenuron.2 4.29 248.1 93.0
Desmedipham.1 4.33 318.2 154.0
Desmedipham.2 4.33 318.2 182.0
Diuron.1 4.33 233.1 72.2
Diuron.2 4.33 235.2 72.1
Chlorantraniliprole.1 4.36 484.0 453.0
Chlorantraniliprole.2 4.36 484.0 285.8
Spinosad (Spinosyn A).1 4.36 732.5 142.2
Spinosad (Spinosyn A).2 4.36 732.5 98.1
Bupirimate.1 4.37 317.2 166.1
Bupirimate.2 4.37 317.2 108.0
Phenmedipham.1 4.37 301.2 168.0
Phenmedipham.2 4.37 301.2 107.9
Fenobucarb.1 4.44 208.0 95.0
Diethofencarb.1 4.45 268.1 226.1
Diethofencarb.2 4.45 268.1 124.0
Ethiprole.1 4.45 397.2 350.9
Ethiprole.2 4.45 397.2 255.0
Furalaxyl.1 4.47 302.2 242.0
Furalaxyl.2 4.47 302.2 95.1
Spinosad (Spinosyn D).1 4.48 746.4 142.3
Spinosad (Spinosyn D).2 4.47 746.4 98.0
Hydramethylnon.1 4.48 495.2 323.2
Hydramethylnon.2 4.48 495.2 151.1
Spinetoram.1 4.48 748.4 142.3
Spinetoram.2 4.48 748.4 98.0
Cyprodinil.1 4.49 226.2 93.0
Cyprodinil.2 4.49 226.2 76.9
Siduron.1 4.52 233.1 137.1
Siduron.2 4.51 233.1 94.1
Fenamidone.1 4.52 312.1 92.0
Fenamidone.2 4.52 312.1 236.1
Azoxystrobin.1 4.53 404.1 372.1
Azoxystrobin.2 4.53 404.1 344.0
Linuron.1 4.53 249.1 160.0](https://image.slidesharecdn.com/brochure-cannabis-testing-en-200817133349/85/Macherey-Nagel-Cannabis-Testing-Brochure-10-320.jpg)
![11www.mn-net.com
Pesticide residues in cannabis
Analyte RT [min] Q Mass [Da]1 Q Mass [Da]3
Linuron.2 4.53 249.1 182.1
Methiocarb.1 4.54 226.2 169.0
Methiocarb.2 4.54 226.2 121.2
Dimethomorph isomer 1.1 4.55 388.2 300.9
Dimethomorph isomer 1.2 4.55 388.2 164.9
Paclobutrazol.1 4.55 294.3 70.0
Paclobutrazol.2 4.55 294.3 125.0
Boscalid.1 4.56 343.0 307.0
Boscalid.2 4.56 343.0 140.0
Carfentrazone-ethyl.1 4.56 412.0 328.0
Carfentrazone-ethyl.2 4.56 412.0 356.0
Promecarb.1 4.57 208.1 151.0
Promecarb.2 4.57 208.1 109.2
Flutolanil.1 4.58 324.1 262.0
Flutolanil.2 4.58 324.1 241.9
Triadimenol.1 4.59 296.2 70.1
Triadimenol.2 4.59 296.2 227.1
Dimethomorph isomer 2.1 4.61 388.2 300.9
Dimethomorph isomer 2.2 4.61 388.2 164.9
Myclobutanil.1 4.61 289.1 70.0
Myclobutanil.2 4.61 289.1 125.0
Mepronil.1 4.62 270.2 119.1
Mepronil.2 4.62 270.2 227.9
Triadimefon.1 4.62 294.0 197.1
Triadimefon.2 4.62 294.0 225.0
Methoxyfenozide.1 4.65 369.2 149.1
Methoxyfenozide.2 4.65 369.2 313.2
Cyproconazole isomer 1.1 4.66 292.2 70.1
Cyproconazole isomer 1.2 4.66 292.2 125.1
Emamectin-benzoate B a.11 4.66 886.5 158.2
Emamectin-benzoate B a.21 4.66 886.5 82.2
Fenhexamid.1 4.68 302.0 97.0
Fenhexamid.2 4.68 302.0 55.0
Triticonazole.1 4.69 318.2 70.0
Triticonazole.2 4.68 318.2 125.0
Bifenazate.1 4.69 301.2 198.0
Bifenazate.2 4.69 301.2 170.0
Butafenacil.1 4.69 492.2 330.9
Butafenacil.2 4.69 492.2 348.9
Iprovalicarb isomer 1.1 4.70 321.2 119.2
Iprovalicarb isomer 1.2 4.70 321.2 203.1
Iprovalicarb isomer 2.1 4.70 321.2 119.2
Iprovalicarb isomer 2.2 4.70 321.2 203.1
Tetraconazole.1 4.70 372.2 158.9
Tetraconazole.2 4.70 372.2 70.1
Spirotetramat.1 4.71 374.2 330.2
Spirotetramat.2 4.71 374.2 302.2
Acibenzolar-S-methyl.1 4.72 211.1 136.1
Acibenzolar-S-methyl.2 4.72 211.1 91.0
Chloroxuron.1 4.72 291.1 72.1
Analyte RT [min] Q Mass [Da]1 Q Mass [Da]3
Chloroxuron.2 4.72 291.1 218.1
Flufenacet.1 4.72 364.2 152.2
Flufenacet.2 4.72 364.2 193.9
Mefenacet.1 4.72 299.2 148.0
Mefenacet.2 4.72 299.2 120.2
Fluquinconazole.1 4.73 376.0 349.0
Fluquinconazole.2 4.73 376.0 307.0
Prochloraz.1 4.75 376.1 307.9
Prochloraz.2 4.75 376.1 70.1
Fluoxastrobin.1 4.76 459.1 427.0
Fluoxastrobin.2 4.76 459.1 188.1
Fenarimol.1 4.77 331.0 268.0
Fenarimol.2 4.77 331.0 81.0
Fipronil.1 4.78 437.2 368.0
Fipronil.2 4.78 437.2 290.0
Etaconazole isomer 1.1 4.79 328.0 159.0
Etaconazole isomer 1.2 4.79 328.1 205.0
Fenbuconazole.1 4.80 337.1 125.1
Fenbuconazole.2 4.80 337.1 70.0
Cyazofamid.1 4.81 325.2 108.0
Cyazofamid.2 4.81 325.2 261.2
Epoxiconazole.1 4.81 330.1 121.1
Epoxiconazole.2 4.81 330.1 101.2
Mepanipyrim.1 4.81 224.1 77.0
Mepanipyrim.2 4.81 224.1 106.1
Flusilazole.1 4.83 316.2 247.0
Flusilazole.2 4.83 316.2 165.0
Tebufenozide.1 4.83 353.2 133.0
Tebufenozide.2 4.84 353.2 297.2
Flubendiamide.1 4.84 683.1 408.0
Flubendiamide.2 4.84 683.1 274.1
Diflubenzuron.1 4.85 311.2 158.2
Diflubenzuron.2 4.85 311.2 141.1
Diclobutrazol.1 4.87 328.0 70.0
Diclobutrazol.2 4.87 328.2 59.1
Fenoxycarb.1 4.87 302.3 88.0
Fenoxycarb.2 4.87 302.3 116.1
Mandipropamid.1 4.89 412.0 346.0
Mandipropamid.2 4.89 412.0 366.0
Neburon.1 4.89 275.1 88.0
Neburon.2 4.89 275.1 114.0
Tebuconazole.1 4.89 308.2 70.1
Tebuconazole.2 4.89 308.2 125.0
Picoxystrobin.1 4.90 368.2 145.1
Picoxystrobin.2 4.90 368.2 204.9
Bromucanozole isomer 1.1 4.91 378.1 70.0
Bromucanozole isomer 1.2 4.91 378.1 159.0
Dimoxystrobin.1 4.91 327.1 205.0
Dimoxystrobin.2 4.91 327.1 116.0
Penconazole.1 4.92 284.2 70.0](https://image.slidesharecdn.com/brochure-cannabis-testing-en-200817133349/85/Macherey-Nagel-Cannabis-Testing-Brochure-11-320.jpg)
![12 www.mn-net.com
Pesticide residues in cannabis
Analyte RT [min] Q Mass [Da]1 Q Mass [Da]3
Penconazole.2 4.92 284.2 158.9
Kresoxim-methyl.1 4.96 314.2 116.1
Kresoxim-methyl.2 4.96 314.2 131.1
Famoxadone.1 4.97 392.0 331.0
Famoxadone.2 4.97 392.0 238.0
Hexaconazole.1 4.97 331.0 105.0
Hexaconazole.2 4.97 314.2 159.0
Propiconazole isomer 1.1 4.97 342.1 159.0
Propiconazole isomer 1.2 4.97 342.1 69.0
Zoxamide.1 4.97 336.1 186.9
Zoxamide.2 4.97 336.1 158.9
Metconazole.1 4.99 320.2 70.1
Metconazole.2 4.99 320.2 125.1
Triflumuron.1 4.99 359.2 156.2
Triflumuron.2 4.99 359.2 139.1
Amitraz.1 5.00 294.2 148.3
Amitraz.2 5.00 294.2 91.2
Benalaxyl.1 5.00 326.3 148.2
Benalaxyl.2 5.00 326.3 294.2
Bitertanol.1 5.02 338.0 70.0
Bitertanol.2 5.02 338.0 99.0
Pyraclostrobin.1 5.05 388.2 194.0
Pyraclostrobin.2 5.05 388.2 163.0
Diniconazole.1 5.10 326.3 159.0
Diniconazole.2 5.10 326.3 70.0
Indoxacarb.1 5.10 528.3 202.9
Thiobencarb.1 5.10 258.3 125.0
Thiobencarb.2 5.10 258.3 89.1
Indoxacarb.2 5.11 528.3 218.0
Difenoconazole isomer 1.1 5.13 408.2 253.1
Difenoconazole isomer 1.2 5.13 406.0 251.0
Benzoximate.1 5.14 364.2 198.9
Analyte RT [min] Q Mass [Da]1 Q Mass [Da]3
Benzoximate.2 5.14 364.2 105.0
Ipconazole isomer 2.1 5.14 334.5 70.0
Ipconazole isomer 2.2 5.14 334.5 125.1
Trifloxystrobin.1 5.15 409.0 186.0
Trifloxystrobin.2 5.15 409.0 145.0
Buprofezin.1 5.16 306.2 201.0
Buprofezin.2 5.16 306.2 116.1
Clofentezine.1 5.17 303.2 138.1
Clofentezine.2 5.17 303.2 102.1
Clethodim isomer 1.1 5.19 360.3 164.0
Clethodim isomer 1.2 5.19 360.3 268.1
Metaflumizone.1 5.22 507.3 177.9
Metaflumizone.2 5.22 507.3 287.1
Tebufenpyrad.1 5.26 334.2 145.0
Tebufenpyrad.2 5.26 334.2 117.1
Furathiocarb.1 5.27 383.2 195.1
Furathiocarb.2 5.27 383.2 252.0
Piperonyl butoxide.1 5.34 356.2 177.1
Piperonyl butoxide.2 5.34 356.2 119.2
Pyriproxyfen.1 5.39 322.1 96.0
Pyriproxyfen.2 5.39 322.1 184.9
Hexythiazox.1 5.40 353.2 228.0
Hexythiazox.2 5.40 353.2 168.1
Quinoxyfen.1 5.40 308.1 196.9
Quinoxyfen.2 5.40 308.1 161.9
Etoxazole.1 5.45 360.3 141.1
Etoxazole.2 5.45 360.3 57.0
Chlorfluazuron.1 5.48 540.0 383.0
Chlorfluazuron.2 5.48 540.0 158.0
Fenpyroximate.1 5.57 422.2 366.2
Fenpyroximate.2 5.57 422.2 134.9
Table 1: MRM transitions and retention times of pesticides. (.1 = first transition, .2 = second transition; Q = Qualifier 1, Q1 3
= Qualifier 3)](https://image.slidesharecdn.com/brochure-cannabis-testing-en-200817133349/85/Macherey-Nagel-Cannabis-Testing-Brochure-12-320.jpg)
![13www.mn-net.com
Pesticide residues in cannabis
0.5 1.0 1.5 2.0 2.5 3.0 3.5 4.0 4.5 5.0 5.5 6.0 6.5 7.0 7.5 8.0
1.9e6
1.8e6
1.736
1.6e6
1.5e6
1.4e6
1.3e6
1.2e6
1.1e6
1.0e6
9.0e5
8.0e5
7.035
6.0e5
5.0e5
4.0e5
3.0e5
2.0e5
1.0e5
0.0
Time [min]
Intensity[cps]
Figure 2: Separation of pesticides on NUCLEOSHELL Bluebird RP 18 column (QuEChERS extract of Cannabis sativa spiked with β = 100 µg/g).®
Matrix reduction
Acetonitrile extract of
Cannabis sativa
Extract after QuEChERS
clean-up with mix from
competitor 1
Extract after QuEChERS
clean-up with mix from
competitor 2
Extract after QuEChERS
clean-up with mix from
MACHEREY-NAGEL
0.16
0.14
0.12
0.10
0.08
0.06
0.04
0.02
0
Drymassofextract[g/mL]
Figure 3: Comparison of drying residue of extracts before and after using
clean-up.
— Acetonitrile extract of Cannabis sativa
— Extract after QuEChERS clean-up with mix from competitor 1
— Extract after QuEChERS clean-up with mix from competitor 2
Extract after QuEChERS clean-up with mix from MACHEREY-NAGEL—
200 300 400 500 600 700
4
3.5
3
2.5
2
1.5
1
0.5
0
Absorbance[mAU]
Wavelength [nm]
Figure 4: Comparison of spectra of extracts before and after using clean-up.
Recovery rates
QuEChERS clean-up with mix from competitor 1
QuEChERS clean-up with mix from competitor 2
QuEChERS clean-up with mix from MACHEREY-NAGEL
15 35 55 75 95 115 135 155 175
140.0
120.0
100.0
80.0
60.0
40.0
20.0
0.0
RecoveryRate[%]
Figure 5: Comparison of recovery rates between MACHEREY-NAGEL and
different competitors.
QuEChERS clean-up with mix from competitor 1
QuEChERS clean-up with mix from competitor 2
QuEChERS clean-up with mix from MACHEREY-NAGEL
0% < x ≤ 50% 50% < x ≤ 70% 70 < x ≤ 120%
180
160
140
120
100
80
60
40
20
0
Numberofpesticides
Recovery rate range
Figure 6:Comparison of distribution of recovery rates between
MACHEREY-NAGEL and different competitors.](https://image.slidesharecdn.com/brochure-cannabis-testing-en-200817133349/85/Macherey-Nagel-Cannabis-Testing-Brochure-13-320.jpg)
![14 www.mn-net.com
Pesticide residues in cannabis
QuEChERS clean-up mix from MN QuEChERS clean-up mix from comp. 1 QuEChERS clean-up mix from comp. 2
Analyte Recovery rate [ %] Recovery rate [ %] Recovery rate [ %]
3-Hydroxycarbofuran 93.7 ± 15.0 101.2 ± 12.8 111.9 ± 20.3
Acephate 77.7 ± 14.3 83.7 ± 11.8 90.8 ± 17.4
Acetamiprid 92.8 ± 3.8 101.5 ± 6.7 94.3 ± 10.0
Acibenzolar-S-methyl 93.2 ± 24.7 79.7 ± 21.0 92.2 ± 17.6
Aldicarb sulfone 102.3 ± 10.3 113.1 ± 10.7 105.8 ± 16.5
Aldicarb sulfoxide 97.9 ± 8.0 97.8 ± 15.9 101.5 ± 15.2
Aldicarb 92.9 ± 8.4 104.5 ± 6.8 105.4 ± 17.5
Ametryn 74.6 ± 14.3 95.1 ± 9.4 80.4 ± 5.1
Aminocarb 95.5 ± 12.9 107.1 ± 6.5 93.8 ± 6.5
Amitraz 106.9 ± 18.6 out of specification* 101.1 ± 16.4
Azoxystrobin 100.7 ± 4.8 113.6 ± 7.3 103.3 ± 4.0
Benalaxyl 104.0 ± 6.3 114.5 ± 9.9 101.9 ± 8.2
Bendiocarb 89.5 ± 11.2 119.7 ± 10.7 106.9 ± 13.1
Benzoximate 98.0 ± 13.6 114.8 ± 21.0 101.1 ± 13.8
Bifenazate 86.8 ± 11.8 104.5 ± 13.6 94.3 ± 8.9
Bitertanol 96.4 ± 4.1 out of specification* 103.3 ± 9.7
Boscalid 98.6 ± 17.6 97.8 ± 17.5 out of specification*
Bromucanozole isomer 1 107.9 ± 12.4 91.5 ± 8.3 98.4 ± 16.3
Bupirimate 95.4 ± 8.3 104.7 ± 8.2 87.8 ± 8.3
Buprofezin 85.0 ± 1.0 102.9 ± 10.7 105.3 ± 10.6
Butafenacil 108.9 ± 10.0 out of specification* 117.1 ± 8.9
Butocarboxim 101.4 ± 9.4 116.8 ± 12.7 101.5 ± 15.0
Butoxycarboxim 88.1 ± 7.3 100.7 ± 17.8 101.3 ± 14.8
Carbaryl 100.4 ± 10.9 out of specification* 101.9 ± 12.0
Carbendazim 46.4 ± 21.4 49.2 ± 16.6 69.8 ± 13.0
Carbetamide 94.7 ± 6.0 103.2 ± 4.1 103.3 ± 3.2
Carbofuran 94.6 ± 7.4 out of specification* 90.8 ± 8.7
Carboxin 81.2 ± 6.1 96.2 ± 8.5 94.7 ± 7.9
Carfentrazone-ethyl 104.2 ± 4.5 110.2 ± 4.1 105.7 ± 12.4
Chlorantraniliprole 96.8 ± 6.9 97.8 ± 12.2 100.4 ± 16.2
Chlorotoluron 99.6 ± 7.2 101.9 ± 10.5 93.3 ± 10.8
Chloroxuron 98.0 ± 7.2 109.2 ± 10.0 94.6 ± 4.5
Clethodim isomer 1 103.3 ± 13.8 109.9 ± 23.2 out of specification*
Clofentezine 111.3 ± 14.1 110.1 ± 9.2 out of specification*
Clothianidin 92.0 ± 13.2 106.6 ± 11.2 107.9 ± 6.7
Cyazofamid 102.5 ± 9.9 out of specification* 111.5 ± 9.3
Cycluron 88.1 ± 11.9 90.5 ± 5.3 90.5 ± 8.6
Cymoxanil 100.0 ± 15.5 98.9 ± 24.4 106.9 ± 23.3
Cyproconazole isomer 1 96.3 ± 7.0 111.2 ± 8.4 90.4 ± 10.9
Cyproconazole isomer 2 80.1 ± 8.0 108.4 ± 22.8 101.2 ± 10.1
Cyprodinil 34.5 ± 7.6 39.5 ± 4.5 41.2 ± 18.7
Cyromazine 26.5 ± 11.0 out of specification* 30.4 ± 20.1
Desmedipham 98.6 ± 22.5 89.2 ± 11.5 100.6 ± 21.6
Diclobutrazol 97.7 ± 7.0 102.9 ± 7.1 95.9 ± 10.0
Dicrotophos-1 94.1 ± 9.0 104.5 ± 12.5 94.0 ± 11.1
Diethofencarb 98.2 ± 7.4 105.1 ± 12.0 72.5 ± 9.0
Difenoconazole isomer 1 89.8 ± 7.8 98.0 ± 3.5 95.6 ± 7.7
Diflubenzuron 87.5 ± 24.7 out of specification* 93.3 ± 18.7
Dimethoate 93.7 ± 12.8 104.3 ± 6.4 101.2 ± 10.9](https://image.slidesharecdn.com/brochure-cannabis-testing-en-200817133349/85/Macherey-Nagel-Cannabis-Testing-Brochure-14-320.jpg)
![15www.mn-net.com
Pesticide residues in cannabis
QuEChERS clean-up mix from MN QuEChERS clean-up mix from comp. 1 QuEChERS clean-up mix from comp. 2
Analyte Recovery rate [ %] Recovery rate [ %] Recovery rate [ %]
Dimethomorph isomer 1 96.8 ± 8.0 99.6 ± 4.8 100.8 ± 15.7
Dimethomorph isomer 2 98.7 ± 9.6 95.8 ± 5.6 86.0 ± 8.3
Dimoxystrobin 98.5 ± 4.0 100.5 ± 9.3 98.1 ± 9.8
Diniconazole 88.0 ± 19.6 99.3 ± 12.1 113.2 ± 19.8
Dinotefuran 91.4 ± 8.5 108.6 ± 8.7 105.7 ± 12.2
Diuron 101.7 ± 16.4 out of specification* 78.4 ± 19.1
Emamectin-benzoate B₁a 66.0 ± 15.9 69.0 ± 10.4 75.7 ± 6.4
Epoxiconazole 95.7 ± 8.0 109.9 ± 8.7 108.4 ± 10.2
Etaconazole isomer 1 99.8 ± 8.6 98.9 ± 5.7 98.5 ± 6.8
Ethiofencarb 94.7 ± 6.6 88.8 ± 2.0 97.2 ± 3.0
Ethiprole 114.9 ± 15.0 112.8 ± 6.7 out of specification*
Ethirimol 30.7 ± 11.5 23.0 ± 11.9 33.0 ± 12.4
Etoxazole 87.9 ± 14.0 99.7 ± 9.9 95.2 ± 15.6
Famoxadone 98.5 ± 20.5 out of specification* out of specification*
Fenamidone 98.8 ± 5.1 106.6 ± 7.6 93.3 ± 5.9
Fenarimol 97.4 ± 4.9 104.0 ± 13.9 103.3 ± 12.1
Fenbuconazole 93.9 ± 16.0 104.7 ± 18.1 93.4 ± 11.7
Fenhexamid 107.8 ± 9.6 94.6 ± 16.1 101.7 ± 19.2
Fenobucarb 111.4 ± 18.2 114.5 ± 22.0 108.9 ± 21.2
Fenoxycarb 97.8 ± 11.2 115.9 ± 8.1 97.7 ± 10.2
Fenpropimorph 79.1 ± 7.5 83.7 ± 6.3 61.7 ± 9.9
Fenpyroximate 83.8 ± 21.5 97.7 ± 18.0 out of specification*
Fenuron 87.4 ± 5.7 98.1 ± 12.8 100.6 ± 17.2
Fipronil 93.8 ± 22.2 out of specification* out of specification*
Flonicamid 95.4 ± 8.9 96.7 ± 8.8 102.1 ± 10.9
Flubendiamide 89.0 ± 8.4 113.2 ± 13.9 101.9 ± 7.0
Flufenacet 100.1 ± 7.7 115.1 ± 8.5 115.8 ± 10.0
Fluometuron 98.8 ± 6.7 100.8 ± 10.6 105.2 ± 14.2
Fluoxastrobin 101.9 ± 8.6 out of specification* 103.2 ± 8.0
Fluquinconazole 98.7 ± 14.0 100.5 ± 19.5 119.5 ± 9.0
Flusilazole 95.8 ± 10.5 97.4 ± 11.9 109.2 ± 8.5
Flutolanil 94.4 ± 4.8 117.3 ± 6.0 103.6 ± 5.5
Flutriafol 94.0 ± 3.9 100.2 ± 4.4 103.3 ± 6.8
Forchlorfenuron 18.0 ± 12.9 16.1 ± 8.5 24.2 ± 10.2
Formetanate HCl 83.6 ± 10.3 93.3 ± 11.3 78.6 ± 6.5
Furalaxyl 95.5 ± 4.2 102.6 ± 8.2 99.4 ± 10.1
Furathiocarb 94.7 ± 4.8 102.2 ± 9.4 101.1 ± 19.5
Hexaconazole 78.9 ± 22.3 111.6 ± 9.8 83.9 ± 14.2
Hexythiazox 109.3 ± 23.4 104.0 ± 17.9 out of specification*
Hydramethylnon 19.6 ± 9.2 11.3 ± 7.2 29.6 ± 5.5
Imazalil 80.8 ± 8.2 83.3 ± 4.1 70.7 ± 14.6
Imidacloprid 94.2 ± 10.7 106.4 ± 11.6 107.4 ± 7.5
Indoxacarb 97.6 ± 12.8 out of specification* out of specification*
Ipconazole isomer 2 91.2 ± 16.3 91.2 ± 17.4 97.1 ± 8.3
Iprovalicarb isomer 1 96.3 ± 21.5 109.1 ± 12.0 105.0 ± 13.8
Iprovalicarb isomer 2 95.5 ± 5.3 108.5 ± 7.2 101.9 ± 9.0
Isoprocarb 92.1 ± 10.1 117.9 ± 13.1 97.7 ± 17.5
Isoproturon 93.1 ± 6.1 109.6 ± 10.9 99.3 ± 8.1
Kresoxim-methyl 115.4 ± 15.8 110.0 ± 13.5 out of specification*](https://image.slidesharecdn.com/brochure-cannabis-testing-en-200817133349/85/Macherey-Nagel-Cannabis-Testing-Brochure-15-320.jpg)
![16 www.mn-net.com
Pesticide residues in cannabis
QuEChERS clean-up mix from MN QuEChERS clean-up mix from comp. 1 QuEChERS clean-up mix from comp. 2
Analyte Recovery rate [ %] Recovery rate [ %] Recovery rate [ %]
Linuron 99.3 ± 8.6 114.7 ± 17.9 105.7 ± 7.6
Mandipropamid 101.1 ± 14.0 114.4 ± 8.3 103.8 ± 13.6
Mefenacet 98.0 ± 15.4 103.9 ± 12.9 99.8 ± 8.4
Mepanipyrim 54.0 ± 8.3 74.0 ± 13.8 77.4 ± 6.5
Mepronil 96.3 ± 3.6 91.6 ± 8.2 82.1 ± 14.4
Mesotrione 77.6 ± 13.3 65.5 ± 10.1 89.0 ± 3.5
Metaflumizone 101.7 ± 19.3 96.1 ± 18.8 out of specification*
Metalaxyl 90.7 ± 2.9 106.8 ± 3.3 97.9 ± 4.1
Metconazole 100.9 ± 9.7 99.9 ± 8.6 87.7 ± 4.9
Methabenzthiazuron 90.5 ± 6.7 98.7 ± 5.7 84.3 ± 11.4
Methiocarb 96.9 ± 2.8 110.6 ± 10.9 100.9 ± 8.2
Methomyl 92.2 ± 3.6 101.9 ± 17.9 out of specification*
Methoprotryne 81.3 ± 10.9 96.7 ± 9.8 81.2 ± 7.0
Methoxyfenozide 100.0 ± 6.7 108.5 ± 8.5 105.3 ± 3.7
Metobromuron 102.8 ± 10.8 101.8 ± 11.0 94.3 ± 16.9
Metribuzin 99.4 ± 9.8 112.3 ± 19.7 106.4 ± 8.2
Mevinphos isomer 1 93.0 ± 16.7 90.9 ± 12.9 98.9 ± 16.0
Mevinphos isomer 2 95.7 ± 15.0 105.9 ± 11.8 out of specification*
Mexacarbate 87.2 ± 7.3 102.0 ± 3.2 94.0 ± 8.8
Monocrotophos 98.5 ± 9.7 104.4 ± 7.6 106.9 ± 5.1
Monolinuron 92.4 ± 10.9 115.2 ± 7.0 109.4 ± 7.4
Myclobutanil 104.9 ± 4.6 109.3 ± 8.6 98.9 ± 5.3
Neburon 89.2 ± 9.5 105.4 ± 14.6 83.1 ± 13.8
Nitenpyram 78.7 ± 4.1 91.5 ± 8.1 94.6 ± 12.7
Omethoate 84.2 ± 8.9 98.7 ± 12.6 100.9 ± 20.7
Oxadixyl 101.8 ± 6.5 104.7 ± 12.3 98.1 ± 6.2
Oxamyl 97.6 ± 9.5 95.3 ± 9.0 108.4 ± 13.0
Paclobutrazol 92.8 ± 3.3 105.2 ± 5.1 87.0 ± 10.5
Penconazole 90.2 ± 7.2 96.4 ± 4.5 99.8 ± 7.8
Phenmedipham 102.2 ± 10.4 107.0 ± 9.7 97.8 ± 9.9
Picoxystrobin 105.4 ± 15.8 107.7 ± 10.2 96.8 ± 7.0
Piperonyl butoxide 86.2 ± 11.7 112.5 ± 6.8 112.7 ± 18.7
Pirimicarb 91.3 ± 8.0 93.4 ± 8.1 95.0 ± 5.9
Prochloraz 90.0 ± 10.0 91.8 ± 9.2 92.0 ± 15.2
Promecarb 93.3 ± 22.6 85.6 ± 8.5 76.3 ± 14.2
Prometon 88.9 ± 12.4 92.1 ± 13.0 77.5 ± 10.6
Prometryne 82.5 ± 3.5 91.6 ± 4.3 78.2 ± 12.2
Propamocarb 74.5 ± 6.8 90.4 ± 15.4 75.0 ± 7.1
Propham 105.9 ± 18.5 out of specification* 92.8 ± 9.0
Propiconazole isomer 1 90.8 ± 11.6 103.7 ± 12.3 90.4 ± 9.2
Propoxur 101.7 ± 10.2 out of specification* 118.2 ± 14.0
Pymetrozine 41.5 ± 14.1 34.0 ± 14.8 37.2 ± 16.8
Pyraclostrobin 90.9 ± 6.0 100.8 ± 12.9 99.8 ± 5.0
Pyrimethanil 47.1 ± 15.2 57.2 ± 5.0 59.1 ± 21.1
Pyriproxyfen 89.7 ± 11.2 100.7 ± 4.8 101.0 ± 16.5
Quinoxyfen 63.5 ± 20.7 86.6 ± 8.0 86.0 ± 20.3
Secbumeton 79.4 ± 8.1 97.0 ± 7.8 80.1 ± 9.3
Siduron 94.6 ± 10.0 109.1 ± 7.7 95.5 ± 6.8
Simetryn 72.0 ± 5.9 88.4 ± 7.3 79.4 ± 12.5](https://image.slidesharecdn.com/brochure-cannabis-testing-en-200817133349/85/Macherey-Nagel-Cannabis-Testing-Brochure-16-320.jpg)
![17www.mn-net.com
Pesticide residues in cannabis
QuEChERS clean-up mix from MN QuEChERS clean-up mix from comp. 1 QuEChERS clean-up mix from comp. 2
Analyte Recovery rate [ %] Recovery rate [ %] Recovery rate [ %]
Spinetoram 66.4 ± 11.8 75.1 ± 12.8 70.4 ± 10.6
Spinosad (Spinosyn A) 70.9 ± 6.4 75.9 ± 12.2 64.0 ± 21.5
Spinosad (Spinosyn D) 71.0 ± 7.6 75.6 ± 15.6 70.8 ± 21.8
Spirotetramat 93.9 ± 11.0 101.3 ± 6.4 93.1 ± 8.7
Spiroxamine isomer 1 71.1 ± 6.5 75.2 ± 7.8 59.0 ± 6.8
Spiroxamine isomer 2 77.2 ± 7.8 79.7 ± 3.2 60.8 ± 14.7
Sulfentrazone 108.5 ± 13.2 119.0 ± 9.0 112.2 ± 12.7
Tebuconazole 90.0 ± 10.0 105.2 ± 13.7 95.3 ± 6.1
Tebufenozide 95.9 ± 12.6 111.4 ± 11.7 96.7 ± 7.8
Tebufenpyrad 95.3 ± 10.3 98.9 ± 7.0 90.9 ± 16.4
Tebuthiuron 92.8 ± 14.0 89.4 ± 17.3 90.1 ± 19.2
Terbumeton 85.1 ± 7.7 77.1 ± 13.7 77.6 ± 4.4
Terbutryn 82.1 ± 7.9 91.9 ± 4.5 74.9 ± 12.3
Tetraconazole 96.4 ± 12.1 103.2 ± 5.7 100.2 ± 10.1
Thiacloprid 91.8 ± 15.5 110.2 ± 13.8 98.6 ± 12.6
Thiamethoxam 98.5 ± 8.9 105.3 ± 7.1 108.0 ± 13.3
Thidiazuron 31.9 ± 8.7 29.3 ± 13.3 41.6 ± 11.4
Thiobencarb 95.3 ± 22.0 118.1 ± 16.7 100.7 ± 9.1
Thiophanate-methyl 77.8 ± 14.1 117.3 ± 6.3 102.6 ± 15.8
Triadimefon 97.7 ± 11.1 107.3 ± 7.6 101.4 ± 11.0
Triadimenol 103.3 ± 7.9 107.4 ± 6.5 95.0 ± 9.6
Trichlorfon 97.1 ± 12.1 112.9 ± 21.0 89.0 ± 11.2
Tricyclazole 87.5 ± 9.7 85.5 ± 20.1 88.3 ± 18.5
Trifloxystrobin 88.8 ± 10.0 101.9 ± 9.1 112.8 ± 5.6
Triflumuron 108.5 ± 9.9 out of specification* 113.2 ± 12.7
Triticonazole 100.2 ± 8.8 106.4 ± 8.3 93.9 ± 8.9
Vamidothion 98.6 ± 12.1 96.0 ± 12.0 91.9 ± 8.7
Zoxamide 95.6 ± 9.8 112.4 ± 8.4 102.7 ± 13.1
Table 2: Recovery rates for presented QuEChERS clean
*specification = 0 – 120 % ± 25 %
-up mixes. The recovery rates are calculated by matrix matched standard calibration.
Conclusion
This application note shows the reliable and successful deter-
mination of pesticide residues from marijuana samples with an
optimized QuEChERS method. The optimized composition
of QuEChERS salt clean-up mixes leads to high reduction of
matrix components and high recovery rates for pesticides. The
presented QuEChERS method resulted in an average recovery
rate of 90.2 % for 175 pesticides. Most of the pesticides (162
analytes) show recovery rates between 70 % to 120 %. On the
other side, high matrix reduction yields are achieved by using
the presented clean-up mix. The amount of dry substance after
clean-up is reduced to less than 40 % of raw acetonitrile extracts.
With this clean-up approach interfering substances (like e.g.,
lipids and pigments) are successfully removed due to optimized
amounts of GCB and CHROMABOND C ec adsorbents.
®
18
The chromatographic separation of pesticides was performed
using core-shell particles that are well known for fast and high-ef-
ficient separations combined with a reasonably low backpres-
sure. In this work, a subsequent analytics was developed on a
NUCLEOSHELL Bluebird RP 18 column.®
References
[1] R. L. Pacula, R. Smart, Annu. Rev. Clin. Psychol. 2017 May
8, 13: 397–419.
[2] M. Anastassiades, S. J. Lehotay, D. Stajnbaher, F. J. Schenck,
J. AOAC Int. 86 (2003), 412–431.](https://image.slidesharecdn.com/brochure-cannabis-testing-en-200817133349/85/Macherey-Nagel-Cannabis-Testing-Brochure-17-320.jpg)
![18 www.mn-net.com
Pesticide residues in cannabis with high matrix reduction
Determination of pesticide residues in Canna-
bis sativa using an optimized QuEChERS meth-
od with high matrix reduction
MACHEREY-NAGEL application department · Dr. H. R. Wollseifen, T. Kretschmer
Abstract
This application note describes the determination of pesticide Products from competitors
residues in Cannabis sativa using a QuEChERS method for
most effective sample clean-up. Interfering substances (like
e.g., lipids and pigments), which were also extracted with the
organic layer, are almost completely removed with clean-up salt
mixes with high amounts of GCB (graphitized carbon black) and
CHROMABOND C ec adsorbents. The organic extracts are
finally analyzed by HPLC-MS/MS.
®
18
Introduction
While medical and recreational use of cannabis are legalized in QuEChERS SPE Resprep Q352, 15
more and more U.S. territories the markets for cannabis and can-
nabis-based products (e.g. concentrated oils, soda, candy and
other edible forms) have grown year by year in North America and
also in other countries
professional cultivation forms of hemp to improve growth yields.
The use of pesticides is a common tool for this monoculture plant
production. Therefor an increasing interest in the determination of
pesticide residues in marijuana is given.
[1]
. A huge demand for marijuana has lead to
New quality control methods have to be developed to ensure
product safety and to reduce health risks by chronic exposure to n Add the CHROMABOND QuEChERS extraction mix I (REF
pesticides. These methods have to be quick, easy, cheap, effec-
tive, rugged and safe like the QuEChERS extraction approach .
Interfering substances (like e.g., lipids and chlorophyll), which
were also extracted with the organic layer, are nearly completely
removed by using clean-up salt mixes with high amounts of GCB
[2]
and of CHROMABOND C®
18 ec adsorbents. On the other side,
the composition of the clean-up salt mixes also has to ensure n Add 6 mL of acetonitrile supernatant to the CHROMABOND
sufficient recovery rates for these pesticides. This work presents
a QuEChERS method for the simultaneous analysis of more than
160 pesticides from Cannabis sativa. The organic extracts are
finally analyzed by HPLC-MS/MS.
Figure 1: Marijuana (Cannabis sativa).
Dispersive solid phase extraction (dSPE)
Competitor 1:
Supel™ QuE PSA/C /ENVI-Carb tube, 15 mL centrifuge tubes,
1200 mg MgSO , 400 mg Supleclean PSA, 400 mg Discovery
DSC-18 und 400 mg ENVI-Carb
18
4
Competitor 2:
roQ™ QuEChERS dSPE kit, 15 mL centrifuge tubes, 1200 mg
MgSO , 400 mg PSA, 400 mg C4 18 ec, 400 mg GCB
Competitor 3:
mL centrifuge tubes,
1200 mg MgSO , 400 mg PSA, 400 mg C4 18, 400 mg Carbon
Extraction
n Weigh out 1 g of homogenized sample (milled in a grinder) into
a 50 mL centrifuge tube (REF 730223)
n Add 100 μL of standard solution (β = 1 µg/mL for each analyte
in acetonitrile) for determining recovery rates
n Add 10 mL water and shake
n
Add 10 mL 1% acetic acid in acetonitrile and shake for 30 min
®
730970)
n Shake vigorously for 2 min and cool down the mixture in an ice
bath
n Centrifuge the mixture at 4500 rpm, for 5 min at 4 °C
Clean-up
®
QuEChERS clean-up mix XLVII (REF 730845)
n Shake vigorously for 60 s
n Centrifuge the mixture at 4500 rpm, for 5 min at 4 °C
n Take acetonitrile extract for injection (REF 702293, REF
702107)](https://image.slidesharecdn.com/brochure-cannabis-testing-en-200817133349/85/Macherey-Nagel-Cannabis-Testing-Brochure-18-320.jpg)
![19www.mn-net.com
Pesticide residues in cannabis with high matrix reduction
Subsequent analysis: HPLC-MS / MS
Chromatographic conditions
Column: EC NUCLEOSHELL Bluebird RP 18,
50 x 4.6 mm, 2.7 µm (REF 763432.46)
®
Eluent A: 0.1 % formic acid in water
Eluent B: 0.1 % formic acid in acetonitrile
Gradient: in 5 min from 5 % to 100 % B, hold for
1.0 min, in 0.1 min to 5 % B, hold 5 % B for
3.9 min
Flow rate: 0.7 mL/min
Temperature: 30 °C
Injection volume: 2 μL
MS conditions
AB Sciex QTRAP 5500
Acquisition mode: SRM
Interface: ESI
Polarity: positive
Curtain gas: 35 psig
Collision gas: medium
Ion spray voltage: 5000 V
Temperature: 450 °C
Ion source gas 1: 45 psig
Ion source gas 2: 45 psig
Detection window: 60 s
MRM transitions
Analyte RT [min] Q Mass [Da]1 Q Mass [Da]3
Propamocarb.1 1.45 189.2 102.1
Propamocarb.2 1.46 189.2 74.0
Aminocarb.1 1.49 209.2 137.2
Aminocarb.2 1.49 209.2 152.2
Formetanate HCl.1 1.52 222.3 165.0
Formetanate HCl.2 1.52 222.3 120.1
Pymetrozine.1 1.56 218.1 105.0
Pymetrozine.2 1.56 218.1 78.0
Acephate.1 1.61 184.1 143.0
Acephate.2 1.62 184.1 49.0
Omethoate.1 1.83 214.1 183.0
Omethoate.2 1.84 214.1 125.1
Nitenpyram.1 1.88 271.1 224.9
Nitenpyram.2 1.88 271.1 126.1
Aldicarb sulfoxide.1 1.98 207.1 132.1
Aldicarb sulfoxide.2 1.98 207.1 89.1
Dinotefuran.1 2.03 203.0 129.0
Dinotefuran.2 2.03 203.0 157.0
Mexacarbate.1 2.08 223.1 166.1
Mexacarbate.2 2.08 223.1 151.1
Flonicamid.1 2.36 230.2 203.1
Flonicamid.2 2.36 230.2 174.0
Analyte RT [min] Q Mass [Da]1 Q Mass [Da]3
Fuberidazole.1 2.41 185.1 157.1
Fuberidazole.2 2.41 185.1 65.0
Thiamethoxam.1 2.52 292.2 181.2
Thiamethoxam.2 2.52 292.2 211.0
Monocrotophos.1 2.56 224.1 127.1
Monocrotophos.2 2.56 224.1 98.1
Dicrotophos-1 2.70 238.1 112.1
Dicrotophos-2 2.70 238.1 193.0
Pirimicarb.1 2.74 239.2 72.1
Pirimicarb.2 2.75 239.2 182.0
Trichlorfon.1 2.89 257.0 109.0
Imidacloprid.1 2.90 256.2 175.0
Imidacloprid.2 2.90 256.2 209.0
Clothianidin.1 2.91 250.2 169.1
Clothianidin.2 2.91 250.2 132.1
Fenuron.1 2.95 165.1 46.0
Fenuron.2 2.95 165.1 72.0
Vamidothion.1 2.98 288.1 146.1
Vamidothion.2 2.98 288.1 118.1
3-Hydroxycarbofuran.1 3.00 238.2 181.0
3-Hydroxycarbofuran.2 3.00 238.2 163.1
Dimethoate.1 3.05 230.1 198.8
Dimethoate.2 3.05 230.1 125.0
Acetamiprid.1 3.14 223.1 126.1
Acetamiprid.2 3.14 223.1 99.0
Prometon.1 3.31 226.2 142.1
Prometon.2 3.31 226.2 86.0
Terbumeton.1 3.32 226.2 170.0
Secbumeton.2 3.32 226.2 100.0
Secbumeton.1 3.33 226.2 170.0
Mevinphos isomer 1.1 3.35 225.1 127.0
Mevinphos isomer 1.2 3.35 225.1 192.9
Butocarboxim.1 3.40 213.0 75.0
Butocarboxim.2 3.40 213.0 116.0
Imazalil.1 3.40 297.1 201.0
Imazalil.2 3.40 297.1 159.0
Aldicarb.1 3.44 208.1 116.0
Aldicarb.2 3.44 208.1 89.0
Tricyclazole.1 3.52 190.1 163.0
Tricyclazole.2 3.52 190.1 136.0
Mesotrione.1 3.56 340.1 228.0
Mesotrione.2 3.56 340.1 104.1
Carbetamide.1 3.62 237.1 192.1
Carbetamide.2 3.62 237.1 118.2
Ametryn.1 3.66 228.1 186.0
Ametryn.2 3.66 228.1 96.0
Fenpropimorph.1 3.70 304.3 147.0](https://image.slidesharecdn.com/brochure-cannabis-testing-en-200817133349/85/Macherey-Nagel-Cannabis-Testing-Brochure-19-320.jpg)
![20 www.mn-net.com
Pesticide residues in cannabis with high matrix reduction
Analyte RT [min] Q Mass [Da]1 Q Mass [Da]3
Fenpropimorph.2 3.70 304.3 117.2
Methoprotryne.1 3.76 272.2 198.0
Methoprotryne.2 3.76 272.2 240.0
Thiophanate-methyl.1 3.77 343.2 151.0
Thiophanate-methyl.2 3.77 343.2 311.1
Metribuzin.1 3.78 215.2 187.0
Metribuzin.2 3.78 215.2 84.1
Spiroxamine isomer 1.1 3.79 298.2 144.2
Spiroxamine isomer 1.2 3.79 298.2 100.1
Spiroxamine isomer 2.1 3.79 298.2 144.2
Spiroxamine isomer 2.2 3.79 298.2 100.1
Carbofuran.1 3.81 222.0 165.0
Carbofuran.2 3.81 222.0 123.0
Sulfentrazone.1 3.85 387.0 307.0
Sulfentrazone.2 3.85 387.0 146.0
Tebuthiuron.1 3.87 229.2 172.1
Tebuthiuron.2 3.87 229.2 116.0
Carbaryl.1 3.98 202.1 145.2
Carbaryl.2 3.98 202.1 127.1
Prometryne.1 3.99 242.2 158.1
Prometryne.2 3.99 242.2 200.1
Carboxin.1 4.00 236.1 143.1
Carboxin.2 4.00 236.1 87.1
Pyrimethanil.1 4.02 200.2 107.0
Pyrimethanil.2 4.02 200.2 82.2
Terbutryn.1 4.02 242.2 186.0
Terbutryn.2 4.02 242.2 68.1
Ethiofencarb.1 4.03 226.2 107.1
Ethiofencarb.2 4.03 226.2 164.0
Monolinuron.1 4.05 215.1 126.1
Monolinuron.2 4.05 215.1 99.0
Fluometuron.1 4.08 233.0 72.0
Flutriafol.1 4.14 302.2 70.1
Flutriafol.2 4.14 302.2 123.0
Chlorotoluron.1 4.15 213.1 72.2
Chlorotoluron.2 4.15 213.1 46.0
Isoprocarb.1 4.16 194.1 95.1
Isoprocarb.2 4.16 194.1 137.0
Metobromuron.1 4.17 259.1 169.9
Metobromuron.2 4.18 259.1 148.2
Metalaxyl.1 4.21 280.2 220.3
Metalaxyl.2 4.21 280.2 192.0
Isoproturon.1 4.23 207.1 72.1
Isoproturon.2 4.23 207.1 46.1
Methabenzthiazuron.1 4.25 222.1 165.0
Methabenzthiazuron.2 4.25 222.1 150.0
Butoxycarboxim.1 4.26 223.1 106.0
Analyte RT [min] Q Mass [Da]1 Q Mass [Da]3
Butoxycarboxim.2 4.26 223.1 166.0
Cycluron.1 4.29 199.2 89.0
Cycluron.2 4.29 199.2 89.1
Desmedipham.1 4.33 318.2 154.0
Desmedipham.2 4.33 318.2 182.0
Diuron.1 4.33 233.1 72.2
Diuron.2 4.33 235.2 72.1
Chlorantraniliprole.1 4.36 484.0 453.0
Chlorantraniliprole.2 4.36 484.0 285.8
Spinosad (Spinosyn A).1 4.36 732.5 142.2
Spinosad (Spinosyn A).2 4.36 732.5 98.1
Bupirimate.1 4.37 317.2 166.1
Bupirimate.2 4.37 317.2 108.0
Phenmedipham.1 4.37 301.2 168.0
Phenmedipham.2 4.37 301.2 107.9
Fenobucarb.1 4.44 208.0 95.0
Diethofencarb.1 4.45 268.1 226.1
Diethofencarb.2 4.45 268.1 124.0
Ethiprole.1 4.45 397.2 350.9
Ethiprole.2 4.45 397.2 255.0
Furalaxyl.1 4.47 302.2 242.0
Furalaxyl.2 4.47 302.2 95.1
Spinosad (Spinosyn D).1 4.48 746.4 142.3
Spinosad (Spinosyn D).2 4.47 746.4 98.0
Hydramethylnon.1 4.48 495.2 323.2
Hydramethylnon.2 4.48 495.2 151.1
Spinetoram.1 4.48 748.4 142.3
Spinetoram.2 4.48 748.4 98.0
Halofenozide.1 4.5 331.2 105.0
Halofenozide.2 4.5 331.0 275.0
Nuarimol.1 4.5 315.0 252.0
Nuarimol.2 4.5 315.0 81.0
Siduron.1 4.52 233.1 137.1
Siduron.2 4.51 233.1 94.1
Fenamidone.1 4.52 312.1 92.0
Fenamidone.2 4.52 312.1 236.1
Azoxystrobin.1 4.53 404.1 372.1
Azoxystrobin.2 4.53 404.1 344.0
Linuron.1 4.53 249.1 160.0
Linuron.2 4.53 249.1 182.1
Methiocarb.1 4.54 226.2 169.0
Methiocarb.2 4.54 226.2 121.2
Paclobutrazol.1 4.55 294.3 70.0
Paclobutrazol.2 4.55 294.3 125.0
Boscalid.1 4.56 343.0 307.0
Boscalid.2 4.56 343.0 140.0
Carfentrazone-ethyl.1 4.56 412.0 328.0](https://image.slidesharecdn.com/brochure-cannabis-testing-en-200817133349/85/Macherey-Nagel-Cannabis-Testing-Brochure-20-320.jpg)
![21www.mn-net.com
Pesticide residues in cannabis with high matrix reduction
Analyte RT [min] Q Mass [Da]1 Q Mass [Da]3
Carfentrazone-ethyl.2 4.56 412.0 356.0
Fenarimol.1 4.56 331.0 268.0
Fenarimol.2 4.56 331.0 81.0
Promecarb.1 4.57 208.1 151.0
Promecarb.2 4.57 208.1 109.2
Flutolanil.1 4.58 324.1 262.0
Flutolanil.2 4.58 324.1 241.9
Triadimenol.1 4.59 296.2 70.1
Triadimenol.2 4.59 296.2 227.1
Dimethomorph isomer 1.1 4.60 388.2 300.9
Dimethomorph isomer 1.2 4.60 388.2 164.9
Myclobutanil.1 4.61 289.1 70.0
Myclobutanil.2 4.61 289.1 125.0
Mepronil.1 4.62 270.2 119.1
Mepronil.2 4.62 270.2 227.9
Triadimefon.1 4.62 294.0 197.1
Triadimefon.2 4.62 294.0 225.0
Methoxyfenozide.1 4.65 369.2 149.1
Methoxyfenozide.2 4.65 369.2 313.2
Cyproconazole isomer 1.1 4.66 292.2 70.1
Cyproconazole isomer 1.2 4.66 292.2 125.1
Fenhexamid.1 4.68 302.0 97.0
Fenhexamid.2 4.68 302.0 55.0
Triticonazole.1 4.69 318.2 70.0
Triticonazole.2 4.69 318.2 125.0
Bifenazate.1 4.69 301.2 198.0
Bifenazate.2 4.69 301.2 170.0
Butafenacil.1 4.69 492.2 330.9
Butafenacil.2 4.69 492.2 348.9
Iprovalicarb isomer 1.1 4.70 321.2 119.2
Iprovalicarb isomer 1.2 4.70 321.2 203.1
Iprovalicarb isomer 2.1 4.70 321.2 119.2
Iprovalicarb isomer 2.2 4.70 321.2 203.1
Tetraconazole.1 4.70 372.2 158.9
Tetraconazole.2 4.70 372.2 70.1
Chloroxuron.1 4.71 291.1 72.1
Chloroxuron.2 4.72 291.1 218.1
Spirotetramat.1 4.71 374.2 330.2
Spirotetramat.2 4.71 374.2 302.2
Flufenacet.1 4.72 364.2 152.2
Flufenacet.2 4.72 364.2 193.9
Mefenacet.1 4.72 299.2 148.0
Mefenacet.2 4.72 299.2 120.2
Fluquinconazole.1 4.73 376.0 349.0
Fluquinconazole.2 4.73 376.0 307.0
Prochloraz.1 4.75 376.1 307.9
Prochloraz.2 4.75 376.1 70.1
Analyte RT [min] Q Mass [Da]1 Q Mass [Da]3
Triflumizole.1 4.76 346.0 278.0
Triflumizole.2 4.76 346.0 73.0
Fluoxastrobin.1 4.76 459.1 427.0
Fluoxastrobin.2 4.76 459.1 188.1
Fenarimol.1 4.77 331.0 268.0
Fipronil.1 4.77 437.2 368.0
Fipronil.2 4.78 437.2 290.0
Etaconazole isomer 1.1 4.79 328.0 159.0
Etaconazole isomer 1.2 4.78 328.1 205.0
Fenbuconazole.1 4.80 337.1 125.1
Fenbuconazole.2 4.80 337.1 70.0
Cyazofamid.1 4.81 325.2 108.0
Cyazofamid.2 4.81 325.2 261.2
Epoxiconazole.1 4.81 330.1 121.1
Epoxiconazole.2 4.81 330.1 101.2
Mepanipyrim.1 4.81 224.1 77.0
Mepanipyrim.2 4.81 224.1 106.1
Flusilazole.1 4.83 316.2 247.0
Flusilazole.2 4.83 316.2 165.0
Tebufenozide.1 4.83 353.2 133.0
Tebufenozide.2 4.84 353.2 297.2
Flubendiamide.1 4.84 683.1 408.0
Flubendiamide.2 4.84 683.1 274.1
Diclobutrazol.1 4.87 328.0 70.0
Diclobutrazol.2 4.87 328.2 59.1
Fenoxycarb.1 4.87 302.3 88.0
Fenoxycarb.2 4.87 302.3 116.1
Mandipropamid.1 4.89 412.0 346.0
Mandipropamid.2 4.89 412.0 366.0
Neburon.1 4.89 275.1 88.0
Neburon.2 4.89 275.1 114.0
Tebuconazole.1 4.89 308.2 70.1
Tebuconazole.2 4.89 308.2 125.0
Picoxystrobin.1 4.90 368.2 145.1
Picoxystrobin.2 4.90 368.2 204.9
Bromucanozole isomer 1.1 4.91 378.1 70.0
Bromucanozole isomer 1.2 4.91 378.1 159.0
Dimoxystrobin.1 4.91 327.1 205.0
Dimoxystrobin.2 4.91 327.1 116.0
Penconazole.1 4.92 284.2 70.0
Penconazole.2 4.92 284.2 158.9
Hexaconazole.1 4.97 331.0 105.0
Hexaconazole.2 4.97 314.2 159.0
Propiconazole isomer 1.1 4.97 342.1 159.0
Propiconazole isomer 1.2 4.97 342.1 69.0
Zoxamide.1 4.97 336.1 186.9
Zoxamide.2 4.97 336.1 158.9](https://image.slidesharecdn.com/brochure-cannabis-testing-en-200817133349/85/Macherey-Nagel-Cannabis-Testing-Brochure-21-320.jpg)
![22 www.mn-net.com
Pesticide residues in cannabis with high matrix reduction
Analyte RT [min] Q Mass [Da]1 Q Mass [Da]3
Prothioconazole.1 4.99 344.0 189.0
Prothioconazole.2 5.00 344.0 125.0
Metconazole.1 4.99 320.2 70.1
Metconazole.2 4.99 320.2 125.1
Triflumuron.1 4.99 359.2 156.2
Triflumuron.2 4.99 359.2 139.1
Amitraz.1 5.00 294.2 148.3
Amitraz.2 5.00 294.2 91.2
Benalaxyl.1 5.00 326.3 148.2
Benalaxyl.2 5.00 326.3 294.2
Bitertanol.1 5.02 338.0 70.0
Bitertanol.2 5.02 338.0 99.0
Pyraclostrobin.1 5.05 388.2 194.0
Pyraclostrobin.2 5.05 388.2 163.0
Diniconazole.1 5.10 326.3 159.0
Diniconazole.2 5.09 326.3 70.0
Thiobencarb.1 5.10 258.3 125.0
Thiobencarb.2 5.10 258.3 89.1
Difenoconazole isomer 1.1 5.13 408.2 253.1
Difenoconazole isomer 1.2 5.13 406.0 251.0
Benzoximate.1 5.14 364.2 198.9
Benzoximate.2 5.14 364.2 105.0
Trifloxystrobin.1 5.15 409.0 186.0
Trifloxystrobin.2 5.15 409.0 145.0
Buprofezin.1 5.16 306.2 201.0
Buprofezin.2 5.16 306.2 116.1
Clethodim isomer 1.1 5.19 360.3 164.0
Clethodim isomer 1.2 5.19 360.3 268.1
Tebufenpyrad.1 5.26 334.2 145.0
Analyte RT [min] Q Mass [Da]1 Q Mass [Da]3
Tebufenpyrad.2 5.26 334.2 117.1
Furathiocarb.1 5.27 383.2 195.1
Furathiocarb.2 5.27 383.2 252.0
Piperonyl butoxide.1 5.34 356.2 177.1
Piperonyl butoxide.2 5.34 356.2 119.2
Temephos.1 5.35 467.1 419.0
Temephos.2 5.35 467.1 404.9
Pyriproxyfen.1 5.39 322.1 96.0
Pyriproxyfen.2 5.39 322.1 184.9
Hexythiazox.1 5.40 353.2 228.0
Hexythiazox.2 5.40 353.2 168.1
Quinoxyfen.1 5.40 308.1 196.9
Quinoxyfen.2 5.40 308.1 161.9
Propargite.1 5.43 368.2 231.2
Propargite.2 5.43 368.2 175.1
Etoxazole.1 5.45 360.3 141.1
Etoxazole.2 5.45 360.3 57.0
Chlorfluazuron.1 5.48 540.0 383.0
Chlorfluazuron.2 5.49 540.0 158.0
Eprinomectin.1 5.52 914.5 185.9
Eprinomectin.2 5.52 914.5 154.0
Fenpyroximate.1 5.57 422.2 366.2
Fenpyroximate.2 5.57 422.2 134.9
Pyridaben.1 5.59 365.2 308.9
Pyridaben.2 5.59 365.2 147.2
Fenazaquin.1 5.67 307.0 161.0
Fenazaquin.2 5.67 307.0 147.0
Moxidectin.1 5.7 640.4 528.5
Moxidectin.2 5.7 640.4 498.5
Table 1: MRM transitions and retention times of pesticides. (.1 = first transition, .2 = second transition; Q1
= Qualifier 1, Q 3
= Qualifier 3)
0.5 1.0 1.5 2.0 2.5 3.0 3.5 4.0 4.5 5.0 5.5 6.0 6.5 7.0
1.9e6
1.8e6
1.736
1.6e6
1.5e6
1.4e6
1.3e6
1.2e6
1.1e6
1.0e6
9.0e5
8.0e5
7.035
6.0e5
5.0e5
4.0e5
3.0e5
2.0e5
1.0e5
0.0
Time [min]
Intensity[cps]
Figure 2: Separation of pesticides on NUCLEOSHELL Bluebird RP 18 column (QuEChERS extract of Cannabis sativa spiked with β = 100 µg/g).®](https://image.slidesharecdn.com/brochure-cannabis-testing-en-200817133349/85/Macherey-Nagel-Cannabis-Testing-Brochure-22-320.jpg)
![23www.mn-net.com
Pesticide residues in cannabis with high matrix reduction
Matrix reduction
Acetonitrile extract of
Cannabis sativa
Extract after
QuEChERS clean-up
with mix from
competitor 1
Extract after
QuEChERS clean-up
with mix from
competitor 2
Extract after
QuEChERS clean-up
with mix from
competitor 3
Extract after
QuEChERS clean-up
with mix from
MACHEREY-NAGEL
0.16
0.14
0.12
0.10
0.08
0.06
0.04
0.02
0
Drymassofextract[g/mL]
Figure 3: Comparison of drying residue of extracts before and after using
clean-up.
Figure 4:Visible matrix reduction: cannabis extract, competitor 1, competitor 2,
competitor 3, MACHEREY-NAGEL (from left to right).
Recovery rates
• QuEChERS clean-up with mix from competitor 1
• QuEChERS clean-up with mix from competitor 2
• QuEChERS clean-up with mix from competitor 3
QuEChERS clean-up with mix from MACHEREY-NAGEL•
0 20 40 60 80 100 120 140 160
140.0
120.0
100.0
80.0
60.0
40.0
20.0
0.0
Recoveryrate[%]
Figure 5: Comparison of recovery rates between MACHEREY-NAGEL and
different competitors.
• QuEChERS clean-up with mix from competitor 1
• QuEChERS clean-up with mix from competitor 2
• QuEChERS clean-up with mix from competitor 3
• QuEChERS clean-up with mix from MACHEREY-NAGEL
0% < x ≤ 50% 50% < x ≤ 70% 70 < x ≤ 120%
160
140
120
100
80
60
40
20
0
Numberofpesticides
Recovery rate range
Figure 6:Comparison of distribution of recovery rates between
MACHEREY-NAGEL and different competitors.
QuEChERS clean-up mix
from MACHEREY-NAGEL
QuEChERS clean-up mix
from competitor 1
QuEChERS clean-up mix
from competitor 2
QuEChERS clean-up mix
from competitor 3
Analyte Recovery rate [ %] Recovery rate [ %] Recovery rate [ %] Recovery rate [ %]
3-Hydroxycarbofuran 115.2 ± 7.8 87.8 ± 11.2 97.3 ± 5.8 103.6 ± 6.1
Acephate 96.7 ± 13.9 75.2 ± 13.1 75.4 ± 10.0 84.8 ± 21.8
Acetamiprid 111.1 ± 7.7 96.0 ± 3.6 107.4 ± 7.5 93.9 ± 6.5
Aldicarb sulfoxide 110.7 ± 8.3 71.4 ± 14.2 100.8 ± 14.1 101.7 ± 11.5
Aldicarb 119.2 ± 7.5 90.6 ± 6.9 102.3 ± 12.4 86.3 ± 9.1
Ametryn 32.1 ± 8.2 19.3 ± 5.3 11.3 ± 11.3 18.8 ± 15.5
Aminocarb 114.7 ± 10.0 95.0 ± 8.6 115.3 ± 14.8 102.5 ± 11.6
Amitraz 91.7 ± 11.2 109.9 ± 10.1 108.7 ± 14.1 out of specification*
Azoxystrobin 109.2 ± 9.8 114.1 ± 6.1 115.2 ± 6.2 110.3 ± 6.6
Benalaxyl 104.9 ± 10.7 101.3 ± 7.5 94.9 ± 7.2 103.7 ± 12.8
Benzoximate 106.0 ± 15.1 101.1 ± 10.1 99.4 ± 13.6 105.3 ± 15.7
Bifenazate 115.8 ± 11.6 118.0 ± 12.8 out of specification* 107.5 ± 13.5
Bitertanol 95.8 ± 18.4 106.5 ± 4.7 94.3 ± 10.2 97.3 ± 7.0
Boscalid 97.9 ± 15.0 94.4 ± 17.7 87.0 ± 17.8 104.7 ± 15.4
Bromucanozole isomer 1 89.3 ± 22.5 103.4 ± 3.2 78.7 ± 8.7 77.8 ± 20.9](https://image.slidesharecdn.com/brochure-cannabis-testing-en-200817133349/85/Macherey-Nagel-Cannabis-Testing-Brochure-23-320.jpg)
![24 www.mn-net.com
Pesticide residues in cannabis with high matrix reduction
QuEChERS clean-up mix
from MACHEREY-NAGEL
QuEChERS clean-up mix
from competitor 1
QuEChERS clean-up mix
from competitor 2
QuEChERS clean-up mix
from competitor 3
Analyte Recovery rate [ %] Recovery rate [ %] Recovery rate [ %] Recovery rate [ %]
Bromucanozole isomer 2 112.5 ± 22.3 81.9 ± 19.0 78.5 ± 13.9 83.9 ± 13.0
Bupirimate 53.9 ± 6.3 31.4 ± 17.7 35.2 ± 2.6 43.5 ± 8.9
Buprofezin 102.4 ± 10.3 89.1 ± 11.1 94.2 ± 5.4 94.7 ± 7.4
Butafenacil 119.3 ± 9.2 99.4 ± 13.5 109.7 ± 2.6 115.1 ± 7.1
Butocarboxim 111.9 ± 5.7 104.7 ± 15.0 107.0 ± 8.1 106.7 ± 8.1
Butoxycarboxim 45.2 ± 15.1 40.0 ± 22.7 36.0 ± 10.4 56.2 ± 9.9
Carbaryl 108.6 ± 10.5 116.7 ± 17.2 111.5 ± 12.9 106.7 ± 10.9
Carbetamide 117.2 ± 5.4 100.9 ± 7.0 110.0 ± 5.2 105.4 ± 10.4
Carbofuran 104.5 ± 8.8 106.8 ± 11.1 118.5 ± 11.1 117.4 ± 6.0
Carboxin 102.6 ± 1.6 91.6 ± 3.4 93.3 ± 4.8 89.8 ± 8.4
Carfentrazone-ethyl 113.6 ± 11.2 108.2 ± 10.9 101.7 ± 3.2 88.2 ± 7.5
Chlorantraniliprole 99.5 ± 12.9 67.0 ± 13.7 65.6 ± 8.9 74.2 ± 13.9
Chlorfluazuron 48.2 ± 15.7 out of specification* out of specification* out of specification*
Chlorotoluron 99.2 ± 6.5 73.1 ± 8.1 81.9 ± 6.8 87.1 ± 3.1
Chloroxuron 100.4 ± 7.6 93.0 ± 7.2 93.4 ± 3.2 100.6 ± 12.8
Clethodim isomer 1 91.2 ± 19.0 94.0 ± 9.1 88.7 ± 13.7 92.6 ± 20.4
Clethodim isomer 2 112.1 ± 19.3 82.5 ± 10.3 95.1 ± 16.1 91.5 ± 14.5
Clothianidin 111.3 ± 15.1 110.9 ± 15.0 98.6 ± 7.8 102.9 ± 13.8
Cyazofamid 113.6 ± 10.1 115.8 ± 7.1 104.9 ± 12.7 115.4 ± 11.0
Cycluron 101.9 ± 8.0 89.7 ± 5.0 84.8 ± 9.9 90.8 ± 9.2
Cyproconazole isomer 1 100.1 ± 3.7 83.8 ± 14.0 101.0 ± 6.3 102.0 ± 3.2
Cyproconazole isomer 2 113.1 ± 9.3 50.4 ± 7.3 99.3 ± 9.1 102.4 ± 14.4
Desmedipham 87.6 ± 6.8 91.2 ± 2.5 94.4 ± 11.4 89.1 ± 9.1
Diclobutrazol 92.7 ± 10.6 88.6 ± 2.5 83.6 ± 12.4 93.6 ± 7.5
Dicrotophos-1 106.4 ± 5.3 98.1 ± 6.2 96.6 ± 7.7 98.5 ± 5.3
Diethofencarb 109.5 ± 19.1 86.7 ± 9.0 91.5 ± 15.7 92.4 ± 10.8
Difenoconazole isomer 1 81.3 ± 8.0 72.6 ± 9.1 73.4 ± 11.6 81.6 ± 7.9
Dimethoate 115.2 ± 9.5 100.7 ± 2.4 95.5 ± 8.7 100.0 ± 8.9
Dimethomorph isomer 1 101.9 ± 14.1 99.5 ± 8.4 98.0 ± 8.2 103.1 ± 9.9
Dimethomorph isomer 2 110.4 ± 6.1 94.6 ± 6.8 93.5 ± 2.5 99.0 ± 4.4
Dimoxystrobin 108.7 ± 15.1 95.1 ± 10.5 100.0 ± 6.9 104.2 ± 8.4
Diniconazole 72.1 ± 16.4 63.5 ± 18.0 28.7 ± 24.2 out of specification*
Dinotefuran 107.3 ± 14.9 110.4 ± 16.9 83.4 ± 22.3 116.0 ± 16.4
Diuron 72.2 ± 17.0 82.6 ± 18.9 73.6 ± 23.5 77.5 ± 16.4
Epoxiconazole 99.3 ± 11.8 92.0 ± 10.1 89.9 ± 9.9 94.6 ± 10.4
Eprinomectin 79.7 ± 24.0 70.0 ± 18.8 52.3 ± 23.1 72.3 ± 24.0
Etaconazole isomer 1 103.2 ± 14.1 92.2 ± 8.3 81.1 ± 9.5 95.2 ± 9.8
Ethiofencarb 111.5 ± 4.3 86.3 ± 5.2 103.1 ± 7.2 95.3 ± 2.4
Ethiprole 109.9 ± 13.5 110.1 ± 14.0 116.9 ± 6.9 80.0 ± 8.6
Etoxazole 99.1 ± 4.1 92.3 ± 4.5 91.7 ± 6.7 90.8 ± 12.6
Fenamidone 103.1 ± 7.2 106.9 ± 5.7 107.1 ± 5.9 101.7 ± 6.2
Fenarimol 101.5 ± 8.7 96.6 ± 9.0 out of specification* 99.2 ± 15.3
Fenazaquin 8.1 ± 22.2 10.2 ± 9.8 10.1 ± 19.0 15.1 ± 20.0
Fenbuconazole 97.8 ± 15.6 82.1 ± 19.6 102.4 ± 4.3 98.3 ± 11.7
Fenhexamid 109.0 ± 12.7 82.2 ± 12.5 91.0 ± 13.5 80.5 ± 8.0
Fenobucarb 101.2 ± 13.1 85.2 ± 18.2 91.0 ± 10.1 89.7 ± 11.0](https://image.slidesharecdn.com/brochure-cannabis-testing-en-200817133349/85/Macherey-Nagel-Cannabis-Testing-Brochure-24-320.jpg)
![25www.mn-net.com
Pesticide residues in cannabis with high matrix reduction
QuEChERS clean-up mix
from MACHEREY-NAGEL
QuEChERS clean-up mix
from competitor 1
QuEChERS clean-up mix
from competitor 2
QuEChERS clean-up mix
from competitor 3
Analyte Recovery rate [ %] Recovery rate [ %] Recovery rate [ %] Recovery rate [ %]
Fenoxycarb 109.0 ± 6.3 103.3 ± 13.3 111.3 ± 6.8 100.9 ± 13.2
Fenpropimorph 69.9 ± 10.8 54.0 ± 8.7 57.2 ± 5.0 62.3 ± 8.2
Fenpyroximate 52.7 ± 4.6 37.8 ± 6.7 41.3 ± 13.5 50.3 ± 21.5
Fenuron 108.1 ± 10.6 94.5 ± 7.0 101.7 ± 10.1 96.4 ± 11.5
Fipronil 112.7 ± 18.3 out of specification* out of specification* out of specification*
Flonicamid 109.7 ± 6.4 97.3 ± 6.0 105.3 ± 7.9 105.1 ± 4.2
Flubendiamide 109.6 ± 13.1 100.1 ± 7.1 112.5 ± 9.4 98.2 ± 12.8
Flufenacet 108.6 ± 2.0 117.3 ± 8.4 114.3 ± 5.1 111.2 ± 9.7
Fluometuron 106.4 ± 4.2 100.2 ± 12.0 105.8 ± 4.3 108.6 ± 7.6
Fluoxastrobin 107.2 ± 6.8 out of specification* 109.7 ± 8.5 out of specification*
Fluquinconazole 108.8 ± 18.0 90.4 ± 10.5 116.8 ± 20.4 100.7 ± 9.3
Flusilazole 113.2 ± 13.5 92.2 ± 12.5 95.7 ± 13.2 101.3 ± 9.2
Flutolanil 106.2 ± 9.9 108.3 ± 1.8 112.7 ± 7.1 113.0 ± 4.5
Flutriafol 96.8 ± 6.3 96.3 ± 2.7 102.6 ± 7.5 97.6 ± 6.8
Formetanate HCl 77.0 ± 5.1 77.5 ± 9.2 68.4 ± 8.9 79.0 ± 7.1
Fuberidazole 53.9 ± 17.9 out of specification* 24.0 ± 19.1 41.1 ± 10.3
Furalaxyl 112.4 ± 10.1 105.8 ± 6.5 116.7 ± 11.9 101.7 ± 7.2
Furathiocarb 101.1 ± 7.6 93.4 ± 6.1 98.4 ± 6.9 94.2 ± 15.8
Halofenozide 112.2 ± 16.9 105.0 ± 13.9 107.9 ± 14.9 99.0 ± 14.3
Hexaconazole 106.6 ± 14.2 98.2 ± 10.2 97.1 ± 15.2 99.4 ± 23.5
Hexythiazox 84.4 ± 13.0 out of specification* 102.0 ± 14.7 out of specification*
Hydramethylnon 3.7 ± 7.2 out of specification* 2.1 ± 5.3 out of specification*
Imazalil 40.5 ± 21.9 41.9 ± 19.1 48.3 ± 9.3 44.7 ± 16.7
Imidacloprid 104.0 ± 12.3 103.2 ± 10.1 104.8 ± 4.5 95.4 ± 9.0
Iprovalicarb isomer 1 102.1 ± 17.5 89.0 ± 16.6 105.0 ± 8.0 96.6 ± 5.1
Iprovalicarb isomer 2 100.8 ± 8.8 102.4 ± 5.4 106.3 ± 6.1 99.1 ± 5.7
Isoprocarb 100.7 ± 12.3 96.0 ± 23.6 88.0 ± 11.9 101.0 ± 14.5
Isoproturon 105.9 ± 4.6 95.2 ± 5.3 97.7 ± 4.5 98.5 ± 9.1
Linuron 119.6 ± 10.8 116.8 ± 15.5 114.3 ± 7.2 110.3 ± 14.5
Lufenuron 74.9 ± 15.5 out of specification* out of specification* out of specification*
Mandipropamid 111.4 ± 11.8 109.8 ± 9.8 104.1 ± 9.4 112.5 ± 9.1
Mefenacet 93.1 ± 9.1 69.0 ± 8.5 77.4 ± 14.4 79.9 ± 11.4
Mepronil 96.7 ± 8.5 84.8 ± 15.6 87.3 ± 9.1 81.2 ± 14.5
Mesotrione 103.0 ± 8.1 88.0 ± 5.9 65.4 ± 8.9 80.7 ± 3.6
Metalaxyl 109.4 ± 5.2 95.0 ± 7.6 100.5 ± 5.4 97.6 ± 5.0
Metconazole 87.7 ± 9.8 67.0 ± 16.4 62.9 ± 6.0 71.1 ± 8.1
Methabenzthiazuron 39.8 ± 8.6 35.4 ± 11.5 40.7 ± 6.9 50.6 ± 3.9
Methiocarb 110.7 ± 12.0 103.5 ± 7.3 100.6 ± 7.3 100.5 ± 1.8
Methoprotryne 31.8 ± 7.1 22.3 ± 6.1 15.7 ± 12.5 24.3 ± 7.2
Methoxyfenozide 113.3 ± 11.4 103.5 ± 3.7 112.3 ± 9.6 106.1 ± 8.7
Metobromuron 97.8 ± 8.6 102.4 ± 11.1 104.6 ± 6.7 97.8 ± 9.8
Metribuzin 101.1 ± 9.2 102.7 ± 8.0 116.6 ± 14.9 98.9 ± 9.2
Mevinphos isomer 1 101.1 ± 6.6 98.4 ± 22.1 93.7 ± 11.4 96.1 ± 13.6
Mexacarbate 100.0 ± 6.5 103.6 ± 10.1 111.0 ± 7.7 97.5 ± 5.7
Monocrotophos 108.6 ± 11.4 96.8 ± 9.8 92.7 ± 9.1 104.6 ± 11.6
Monolinuron 108.5 ± 5.9 96.0 ± 6.9 95.3 ± 8.3 96.7 ± 9.6](https://image.slidesharecdn.com/brochure-cannabis-testing-en-200817133349/85/Macherey-Nagel-Cannabis-Testing-Brochure-25-320.jpg)
![26 www.mn-net.com
Pesticide residues in cannabis with high matrix reduction
QuEChERS clean-up mix
from MACHEREY-NAGEL
QuEChERS clean-up mix
from competitor 1
QuEChERS clean-up mix
from competitor 2
QuEChERS clean-up mix
from competitor 3
Analyte Recovery rate [ %] Recovery rate [ %] Recovery rate [ %] Recovery rate [ %]
Moxidectin 92.7 ± 15.5 87.3 ± 23.9 out of specification* out of specification*
Myclobutanil 98.3 ± 5.9 104.6 ± 5.9 101.4 ± 8.7 99.2 ± 9.8
Neburon 81.5 ± 10.0 70.6 ± 16.3 72.6 ± 3.6 78.8 ± 14.1
Nitenpyram 103.1 ± 18.3 86.6 ± 6.2 87.0 ± 16.2 91.1 ± 11.3
Nuarimol 105.8 ± 16.1 93.3 ± 7.5 92.1 ± 7.5 109.0 ± 15.4
Omethoate 115.4 ± 12.7 93.4 ± 11.2 97.7 ± 16.2 103.1 ± 15.6
Paclobutrazol 96.9 ± 3.8 95.6 ± 3.2 92.7 ± 6.1 89.2 ± 4.7
Penconazole 96.4 ± 6.3 85.0 ± 9.1 92.7 ± 3.9 92.4 ± 5.7
Phenmedipham 81.4 ± 13.6 95.2 ± 13.7 89.0 ± 9.6 95.8 ± 10.1
Picoxystrobin 108.6 ± 6.1 113.7 ± 4.8 100.2 ± 4.8 105.0 ± 15.7
Piperonyl butoxide 96.1 ± 8.5 88.7 ± 8.9 99.9 ± 6.6 88.4 ± 9.7
Pirimicarb 117.1 ± 9.6 82.2 ± 5.6 84.6 ± 7.4 90.4 ± 6.1
Prochloraz 55.6 ± 10.2 39.9 ± 9.6 38.3 ± 8.7 48.6 ± 12.5
Promecarb 91.5 ± 16.5 75.8 ± 11.8 93.9 ± 13.2 88.6 ± 6.6
Prometon 44.9 ± 9.8 22.0 ± 10.5 24.7 ± 7.5 34.6 ± 9.2
Prometryne 52.6 ± 6.4 32.9 ± 6.2 33.2 ± 2.8 40.3 ± 5.1
Propamocarb 84.8 ± 7.1 59.8 ± 19.5 50.4 ± 6.6 71.9 ± 17.8
Propargite 110.8 ± 22.0 out of specification* 119.3 ± 13.9 114.0 ± 13.1
Propiconazole isomer 1 105.3 ± 17.6 76.3 ± 16.4 84.0 ± 14.4 85.0 ± 6.3
Prothioconazole 82.8 ± 15.1 76.3 ± 18.3 out of specification* out of specification*
Pymetrozine 12.1 ± 10.7 out of specification* 6.1 ± 8.3 3.1 ± 24.6
Pyraclostrobin 90.9 ± 10.8 65.6 ± 10.1 81.0 ± 9.9 78.6 ± 6.7
Pyridaben 88.8 ± 11.1 103.8 ± 9.7 102.7 ± 16.0 99.3 ± 20.3
Pyrimethanil 8.7 ± 17.9 6.4 ± 10.6 7.5 ± 7.0 5.9 ± 15.0
Pyriproxyfen 86.2 ± 11.1 86.0 ± 7.6 92.4 ± 3.7 92.1 ± 6.6
Quinoxyfen 9.6 ± 7.3 11.0 ± 3.6 7.8 ± 10.0 10.2 ± 15.0
Secbumeton 35.2 ± 14.3 23.9 ± 6.2 24.4 ± 13.8 33.4 ± 9.9
Siduron 99.9 ± 8.4 99.3 ± 6.1 96.5 ± 3.5 96.5 ± 6.5
Spinetoram 44.7 ± 12.8 14.4 ± 13.7 21.0 ± 20.9 45.0 ± 16.7
Spinosad (Spinosyn A) 51.7 ± 14.0 23.9 ± 10.0 29.8 ± 18.8 45.5 ± 10.6
Spinosad (Spinosyn D) 47.7 ± 14.1 21.3 ± 12.3 26.9 ± 11.3 45.5 ± 6.1
Spirotetramat 109.0 ± 8.5 92.4 ± 9.1 89.9 ± 12.1 96.9 ± 10.8
Spiroxamine isomer 1 54.6 ± 22.5 46.0 ± 13.1 46.0 ± 4.2 55.3 ± 11.3
Spiroxamine isomer 2 66.1 ± 3.6 44.3 ± 8.5 45.7 ± 3.7 57.5 ± 10.6
Tebuconazole 83.7 ± 8.8 71.6 ± 6.6 72.6 ± 10.0 76.5 ± 11.8
Tebufenozide 102.5 ± 7.7 103.8 ± 12.7 104.9 ± 5.3 110.9 ± 8.6
Tebufenpyrad 78.6 ± 9.1 82.7 ± 11.4 87.0 ± 9.4 88.8 ± 7.7
Tebuthiuron 97.5 ± 5.8 81.8 ± 9.0 82.6 ± 6.8 91.5 ± 9.2
Temephos 86.6 ± 21.3 out of specification* out of specification* 90.1 ± 20.9
Terbutryn 49.5 ± 4.9 34.2 ± 4.5 34.4 ± 2.1 46.6 ± 3.6
Tetraconazole 108.6 ± 16.0 101.4 ± 7.7 105.9 ± 11.0 101.4 ± 5.8
Thiamethoxam 118.7 ± 9.2 96.6 ± 4.7 107.8 ± 10.9 113.6 ± 6.1
Thiobencarb 102.5 ± 10.6 out of specification* 102.9 ± 10.4 103.8 ± 17.1
Thiophanate-methyl 109.2 ± 8.0 107.9 ± 9.8 99.1 ± 8.5 95.4 ± 13.8
Triadimefon 104.8 ± 9.2 103.3 ± 9.4 104.6 ± 4.6 117.9 ± 9.3
Triadimenol 102.7 ± 7.4 102.2 ± 4.0 97.1 ± 8.6 102.3 ± 3.0](https://image.slidesharecdn.com/brochure-cannabis-testing-en-200817133349/85/Macherey-Nagel-Cannabis-Testing-Brochure-26-320.jpg)
![27www.mn-net.com
Pesticide residues in cannabis with high matrix reduction
QuEChERS clean-up mix
from MACHEREY-NAGEL
QuEChERS clean-up mix
from competitor 1
QuEChERS clean-up mix
from competitor 2
QuEChERS clean-up mix
from competitor 3
Analyte Recovery rate [ %] Recovery rate [ %] Recovery rate [ %] Recovery rate [ %]
Trichlorfon 113.7 ± 17.4 99.9 ± 21.6 out of specification* 99.1 ± 5.8
Tricyclazole 24.2 ± 15.7 out of specification* out of specification* 25.7 ± 18.1
Trifloxystrobin 108.0 ± 17.4 98.7 ± 5.8 out of specification* 102.2 ± 10.7
Triflumizole 113.7 ± 10.1 108.1 ± 14.3 93.2 ± 6.5 104.0 ± 12.0
Triflumuron 89.4 ± 11.6 88.0 ± 17.0 92.2 ± 7.6 105.8 ± 9.5
Triticonazole 93.9 ± 7.6 83.1 ± 5.9 77.7 ± 6.2 90.3 ± 10.1
Vamidothion 117.2 ± 14.0 94.4 ± 11.5 94.6 ± 13.4 91.1 ± 4.5
Zoxamide 103.1 ± 12.1 101.4 ± 6.3 114.6 ± 10.4 105.7 ± 7.0
Table 2:Recovery rates for presented QuEChERS clean-up mixes. The recovery rates that are calculated by matrix matched standard calibration.
*specification = 0 – 120 % ± 25 %
Conclusion
This application note shows the reliable and successful deter-
mination of pesticide residues from marijuana samples with an
optimized QuEChERS method. The optimized composition of
QuEChERS salt clean-up mixes leads to high reduction of matrix
components and to high recovery rates for pesticides. The pre-
sented QuEChERS method leads to an average recovery rate for
pesticides of 92.3 % for 162 pesticides. Most of the pesticides
(138 analytes) show recovery rates between 70 % to 120 %. On
the other side, high matrix reduction yields were also possible by
using the presented clean-up mix. The amount of dry substance
after clean-up is reduced to less than 70 % of raw acetonitrile
extracts. With this clean-up approach interfering substances (like
e.g., lipids and pigments) are successfully removed due to high
amounts of GCB and CHROMABOND C ec adsorbents.
®
18
The chromatographic separation of pesticides was performed
by using core-shell particles that are well known for fast and
high-efficient separations combined with a reasonably low back
pressure. In this work, a subsequent analytics was developed on
a NUCLEOSHELL Bluebird RP 18 column.®
References
[1] R. L. Pacula, R. Smart, Annu. Rev. Clin. Psychol. 2017 May
8, 13: 397–419.
[2] M. Anastassiades, S. J. Lehotay, D. Stajnbaher, F. J. Schenck,
J. AOAC Int. 86 (2003), 412–431.](https://image.slidesharecdn.com/brochure-cannabis-testing-en-200817133349/85/Macherey-Nagel-Cannabis-Testing-Brochure-27-320.jpg)
![28 www.mn-net.com
Determination of cannabinoids in hemp products
Fast and simple High Performance Liquid Chro-
matography – Ultraviolet assay for the determi-
nation of cannabinoids in hemp products with
additional MS/MS identification
MACHEREY-NAGEL application department · Dr. H. R. Wollseifen, T. Kretschmer, S. Schneider
Abstract
This application note describes the determination of cannabi-
noids in hemp products using a LC–UV assay. Hemp products
like tea, flour and buds were extracted according to DAC/NRF
monograph and analyzed by HPLC–UV on a NUCLEOSHELL
RP 18 column. Hemp oil was diluted with methanol, filtered and
analyzed like plant extracts. Identification of contained cannabi-
noids was additionally performed by HPLC–UV–MS/MS.
®
Introduction
Hemp products are often used because of their nutraceutical,
cosmetic and pharmaceutical properties and are becoming more
popular. Hemp seeds and flowers can be consumed or used to
produce a variety of food products including hemp milk, hemp
oil, hemp cheese substitutes, hemp flower tea, hemp flower
flour or other plant powders. Hemp is commonly confused with n Repeat extraction of the residue twice with 12.5 mL of ethanol
marijuana. It belongs to the same family, but the two plants are
very different. Marijuana is grown to contain high amounts of tet-
rahydrocannabinol (THC), the chemical that is responsible for its
psychoactive properties. Hemp describes the edible plant parts
like seeds or flowers and only contains a trace amount of THC.
From the perspective of medical law, hemp extracts and hemp
products in most countries may only be sold to consumers in Eu-
rope if they were obtained exclusively from hemp and their THC
content is ≤ 0.2 % [1]. The limit of THC content leads to a need n Add 1 mL isopropyl alcohol and shake for 1 min
of fast and simple methods for potency testing by HPLC–UV. The
producers have to ensure that the products contain less than
0.2 % THC to comply with European law.
Sample preparation of hemp flower products was carried out ac-
cording to DAC/NRF regulations [2]. For sample matrices that are
complex or heavily processed this work shows a SPE method for
cannabinoids that allows an effective enrichment of concentrated
compounds.
The cannabinoids are determined by HPLC–UV using
NUCLEOSHELL core-shell particle technology. The well known
advantages of these columns are highest column efficiency and
resolution at a short run time with much lower back pressure
compared to fully porous particles.
®
This work presents a quick, easy and cost-efficient LC–UV
method for the simultaneous analysis of cannabinoids from sev-
eral hemp products. In addition, cannabinoids were identified by
LC–MS/MS.
Sample pretreatment
Sample material
n Hemp flower tea
n Hemp flower flour
n Hemp flower buds
n
Hemp oil
n
Hemp CO extract2
Extraction procedure for tea, flour and buds
n Weigh out 0.5 g of homogenized sample (milled in a grinder)
into a 50 mL centrifuge tube (REF 730223)
n Add 20 mL of ethanol and shake for 15 min
n Centrifuge the mixture at 4500 rpm, for 5 min at 4 °C
n Fill the supernatant in a 50 mL flask
and combine the extracts
n Fill up the flasks to 50 mL with ethanol
n Filter 1 mL of extract through a syringe filter with regenerated
cellulose (membrane pore size 0.45 µm, 729231) into a vial for
HPLC analysis (REF 702293, REF 702107)
Extraction procedure for oil and CO₂ extract
n Weigh out 0.1 g of homogenized oil into a 25 mL flask
n Fill up the flask to 25 mL with methanol
n Filter 1 mL of extract through a syringe filter with regenerated
cellulose (membrane pore size 0.45 µm) into a 10 mL flask
n Fill up with methanol to 10 mL
n Use this mixture for HPLC analysis (REF 702293, REF 702107)
Figure 1: Hemp products (tea, flour, oils).](https://image.slidesharecdn.com/brochure-cannabis-testing-en-200817133349/85/Macherey-Nagel-Cannabis-Testing-Brochure-28-320.jpg)
![29www.mn-net.com
Determination of cannabinoids in hemp products
LC Method parameters
Chromatographic conditions
Column: EC NUCLEOSHELL RP 18, 50 x 4.0
2.7 µm (763152.40)
®
mm,
Eluent A: 0.1 % formic acid in water
Eluent B: 0.1 % formic acid in acetonitrile
Gradient: in 5 min from 60 % to 95 % B, hold for
5.0 min, in 0.1 min to 60 % B, hold 60 % B
for 4.9 min
Flow rate: 0.7 mL/min
Temperature: 40 °C
Injection volume: 2 μL
Detection: UV @ 225 nm, 306 nm
MS conditions for peak identification
AB Sciex API 3200
Acquisition mode: SRM
Interface: ESI
Polarity: positive/negative
Curtain gas: 20 psig
CAD: 3.0 psig
Ion spray voltage, ESI positive: 4500 V
Ion spray voltage, ESI negative: –4500 V
Temperature: 500 °C
Ion source gas 1: 45 psig
Ion source gas 2: 45 psig
Detection window: 90 s
Injection volume: 5 μL
MRM transitions
Analyte Abbr. [M+H]⁺ Q1 Q2
Cannabigerol CBG 317.2 193.1 123.1
Cannabidiol CBD 315.1 193.1 259.1
Cannabinol CBN 311.1 223.2 241.0
Δ⁹-tetrahydrocannabinol THC 315.1 193.1 259.1
Cannabichromene CBC 315.1 193.1 81.0
Δ⁹- tetrahydrocannabivarin THCV 287.1 165.0 77.1
Cannabidivarin CBDV 287.1 123.2 77.1
Table 1: MRM transitions of cannabinoids from hemp products (positive po-
larity). (Q1
= Quantifier, Q 2
= Qualifier)
Analyte Abbr. [M–H]–
Q1 Q2
Cannabidiolic acid CBDA 357.1 313.1 245.0
Cannabigerolic acid CBGA 359.1 341.2 315.2
Δ⁹-tetrahydrocannabinolic acid THCA 357.1 313.1 191.0
Table 2: MRM transitions of cannabinoids from hemp products (negative po-
larity). (Q1
= Quantifier, Q 2
= Qualifier)
Representative chromatograms for hemp products
400
300
200
100
0
-150
25
20
15
10
5
0
-2
0 1 2 3 4 5 6 7
Time [min]
0 1 2 3 4 5 6 7
Time [min]
CBD-2.958
CBN-3.583
THC-4.000
THCA-4.417
CBDA-2.608CBDA-2.608
THCA-4.417
Absorbance[mAU]Absorbance[mAU]
A
B
Figure 2: Chromatograms of an extract from hemp flower tea, @ 225 nm (A),
306 nm (B).
400
300
200
100
0
-150
25
20
15
10
5
0
-2
0 1 2 3 4 5 6 7
Time [min]
0 1 2 3 4 5 6 7
Time [min]
CBD-2.967
CBN-3.583
THC-4.000
THCA-4.425
CBDA-2.608
CBDA-2.608
THCA-4.425
Absorbance[mAU]Absorbance[mAU]
A
B
Figure 3:Chromatograms of an extract from hemp flower flour, @ 225 nm (A),
306 nm (B).](https://image.slidesharecdn.com/brochure-cannabis-testing-en-200817133349/85/Macherey-Nagel-Cannabis-Testing-Brochure-29-320.jpg)
![30 www.mn-net.com
Determination of cannabinoids in hemp products
500
400
300
200
100
0
-150
12
10
8
6
4
2
0
-2
0 1 2 3 4 5 6 7
Time [min]
0 1 2 3 4 5 6 7
Time [min]
CBD-2.967
CBN-3.592
THC-4.000
THCA-4.417
CBDA-2.608CBDA-2.608
THCA-4.425
Absorbance[mAU]Absorbance[mAU]
A
B
Figure 4:Chromatograms of an extract from hemp flower buds, @ 225 nm (A),
306 nm (B).
300
200
100
0
-100
20
15
10
5
0
-2
0 1 2 3 4 5 6 7
Time [min]
0 1 2 3 4 5 6 7
Time [min]
CBG-4.300
CBDA-4.433
CBC-5.500
THC-5.183
THCA-6.000
CBDA-4.433
Absorbance[mAU]Absorbance[mAU]
A
B
Figure 5: Chromatograms of an extract from hemp oil, @ 225 nm (A), 306 nm
(B).
700
500
375
250
125
0
-100
18
15
10
5
0
-2
0 1 2 3 4 5 6 7
Time [min]
0 1 2 3 4 5 6 7
Time [min]
CBG-4.300
CBC-5.500
CBGA-4.742
CBDA-4.433CBDA-4.433
Absorbance[mAU]Absorbance[mAU]
A
B
Figure 6:Chromatograms of an extract from hemp CO extract, @ 225 nm (A),2
306 nm (B).
Figure 10: Hemp flower buds, hemp flour and hemp tea (from left to right).](https://image.slidesharecdn.com/brochure-cannabis-testing-en-200817133349/85/Macherey-Nagel-Cannabis-Testing-Brochure-30-320.jpg)
![31www.mn-net.com
Determination of cannabinoids in hemp products
MS/MS identification of cannabinoids
Figure 8: Chromatogram of an extract from hemp flower tea (positive polarity).
Figure 9: Chromatogram of an extract from hemp flower tea (negative polarity).
Calibration curves of CBD, CBDA, THC
20
15
10
5
0
-5
45
40
35
30
25
20
15
10
5
0
-5
-10
20
15
10
5
0
-5
0 20 40 60 80 100 120
Concentration [µg/mL]
0 20 40 60 80 100 120
Concentration [µg/mL]
0 20 40 60 80 100 120
Concentration [µg/mL]
y = 0.1797x + 0.0808
R = 0.99972
THC
y = 0.4058x + 0.2016
R = 0.99992
CBDA
y = 0.1851x + 0.2577
R = 0.99942
CBD
Area[mAU]Area[mAU]Area[mAU]
Figure 10: Calibration curves of Cannabidiol, Cannabidiolic acid,
Δ⁹-tetrahydrocannabinol.
Figure 7: Hemp oil and CO₂ extract.](https://image.slidesharecdn.com/brochure-cannabis-testing-en-200817133349/85/Macherey-Nagel-Cannabis-Testing-Brochure-31-320.jpg)
![32 www.mn-net.com
Determination of cannabinoids in hemp products
Solid phase extraction for processed hemp
products
Sample extract of hemp products was diluted 1:1 with water.
Column: CHROMABOND HR-X, 85 µm,
6 mL/200 mg (REF 730938)
®
Conditioning: mL methanol, 5 mL 50 % methanol in
water
5
Sample appl.: 20 mL sample mixture with a flow rate of
3 mL/min
Washing: 5 mL of 50 % methanol in water with a flow
rate of 3 mL/min
Drying: 2 min with vacuum
Elution: 5 mL methanol
Eluent exchange: Evaporate eluate to dryness at 40°C under
a stream of nitrogen and fill up to 1.0 mL
with methanol.
140
120
100
80
60
40
20
0
10 20 30 40 50
Organic solvent content in sample [%]
CBDA THCA
Recoveryrate[%]
Figure 12: Recovery rates of CBD and THC, detection @ 225 nm.
140
120
100
80
60
40
20
0
10 20 30 40 50
Organic solvent content in sample [%]
THC CBG
Recoveryrate[%]
Figure 13: Recovery rates of CBDA and THCA, detection @ 306 nm.
Representative chromatograms for hemp prod-
ucts spiked with Cannabis sativa
250
200
100
0
-100
-150
30
25
20
15
100
5
0
-5
45
30
20
10
0
-5
140
120
100
80
60
40
20
0
-10
350
200
100
0
-100
-150
1000
800
600
400
200
0
-200
0 1 2 3 4 5 6
min
7
0 1 2 3 4 5 6
min
7
0 1 2 3 4 5 6 7
0 1 2 3 4 5 6
min
7
0 1 2 3 4 5 6
min
7
0 1 2 3 4 5 6 7
Absorbance[mAU]
min min
Absorbance[mAU]Absorbance[mAU]
Absorbance[mAU]Absorbance[mAU]Absorbance[mAU]
Figure 14:Chromatograms of extracts with a mixture of hemp flower tea and
Cannabis sativa, spiking level A 1 %, spiking level B 2.5 %, spiking
level C 10 %.
400
300
200
100
0
-150
35
30
20
10
0
-5
45
30
20
10
0
-5
120
100
80
60
40
20
0
-10
400
300
200
100
0
-150
800
600
400
200
0
-200
0 1 2 3 4 5 6
min
7
0 1 2 3 4 5 6
min
7
0 1 2 3 4 5 6 7
0 1 2 3 4 5 6
min
7
0 1 2 3 4 5 6
min
7
0 1 2 3 4 5 6 7
Absorbance[mAU]
Absorbance[mAU]Absorbance[mAU]Absorbance[mAU]
min
Absorbance[mAU]Absorbance[mAU]
min
Figure 15:Chromatograms of extracts with a mixture of hemp flower flour and
Cannabis sativa, spiking level A 1 %, spiking level B 2.5 %, spiking
level C 10 %.
500
400
300
200
100
0
-150
500
20
15
10
5
0
-2
35
30
20
10
0
-5
120
100
80
60
40
20
0
-10
400
300
200
100
0
-150
800
600
400
200
0
-200
0 1 2 3 4 5 6
min
7
0 1 2 3 4 5 6
min
7
0 1 2 3 4 5 6
min
7
0 1 2 3 4 5 6 7
0 1 2 3 4 5 6
min
7
0 1 2 3 4 5 6
min
7
Absorbance[mAU]Absorbance[mAU]Absorbance[mAU]
Absorbance[mAU]Absorbance[mAU]Absorbance[mAU]
min
Figure 16: Chromatograms of extracts with a mixture of hemp flower buds and
Cannabis sativa, spiking level A 1 %, spiking level B 2.5 %, spiking
level C 10 %.](https://image.slidesharecdn.com/brochure-cannabis-testing-en-200817133349/85/Macherey-Nagel-Cannabis-Testing-Brochure-32-320.jpg)
![33www.mn-net.com
Determination of cannabinoids in hemp products
Conclusion
This application note shows a simple chromatographic separation
of the major cannabinoids from several hemp product samples
in less than ten minutes, that can be used for identification and
quantification of small analyte amounts. This work presents an ef-
fective extraction method and achieves the goal to develop a SPE
method for the enrichment of cannabinoids from difficult sample
matrices with high recovery rates. The figures 10 and 11 elucidate
that the organic content of the sample mixture plays an important
role to get good results for cannabinoid enrichment. The addition
of Cannabis sativa in hemp flower products is shown in the fig-
ures 12, 13 and 14.
In addition, the identification of cannabinoids by mass spectrom-
etry was successfully performed with presented chromatographic
conditions on a NUCLEOSHELL RP 18 column.®
References
[1] Drug policy of Germany.
[2] DAC/NRF 2016/1, C-053, Cannabisblüten (Cannabis flos).](https://image.slidesharecdn.com/brochure-cannabis-testing-en-200817133349/85/Macherey-Nagel-Cannabis-Testing-Brochure-33-320.jpg)
![34 www.mn-net.com
Determination of THC in human urine with LC-MS
Determination of cannabinoids (THC) in human
urine with LC-MS
MACHEREY-NAGEL application department · Dr. H. R. Wollseifen
Abstract
This application note describes the determination of THC and its
metabolites (THC–OH and THC–COOH) from urine in the lower
ng/mL range using manual solid phase extraction or the LCTech
FreeStyle™ liquid handling system. Since the target analytes are
secreted as glucuronide conjugates in human urine, it is neces-
sary to cleave the glucuronides prior to solid phase extraction.
This is done by basic hydrolysis. The pretreated sample solution
is then subjected to a solid phase extraction (SPE) step and finally
analyzed by HPLC.
Introduction
Cannabis, also known as Marihuana or Hashish, is the most
widely consumed drug in the world. Its consumption leads to
mood-altering behavior like euphoria, relaxation and altered-time
perception. A routinely consumption can lead to dependence and
tolerance [1,2]. In recent years there is also an increasing interest
in therapeutic effects of cannabinoids and the development of
potential cannabinoid medications. Therefore it is investigated for
treatment of chronic pain, muscle spasticity, nausea and AIDS
wasting disease, for instance [1,3,4]. This also leads to an increa-
sing demand for the development of accurate and sensitive ana-
lytical methods for the quantification of cannabinoids in biological
fluids [1]. The measurement of urine cannabinoids is necessary
for pharmacokinetic studies, drug treatment, workplace drug
testing and for drug impaired driving investigations. Detailed urine
collection procedures with comprehensive chain-of-custody do-
cumentation have been developed for forensic applications [1].
H C H
H3C O
3
OH
H
C5H11
R
Figure 1: Compound of interest.
Analyte R Formula Mass [g/mol]
THC CH3 C H ₀O21 3 2 314.5
THC–OH CH OH2 C ₁H ₀O2 3 3 330.5
THC–COOH COOH C ₁H ₈O2 2 4 344.4
Table 1: Overview of the analytes.
Sample pretreatment – alkaline hydrolysis
5 mL urine are spiked with a) 50 μL standard solution and b)
100 μL standard solution resulting in samples with a) 50 ng
each of THC, THC–OH and THC–COOH and b) 100 ng each
of the respective standards. The glucuronide is hydrolyzed by
treating 5 mL of the spiked urine (a) c = 10 ng/mL b) c = 20 ng/
mL) with 300 μL NaOH solution (10 mol/L) at 60 °C for 15 min
in a heating block. The hydrolyzed solution is cooled and mixed
with 200 μL glacial acetic acid. Then 2 mL ammonium acetate
solution (50 mmol/L) are added and the mixture is adjusted to pH
6–7 with either acetic acid or diluted NaOH solution. The sample
is transferred into a vial N 18. The hydrolysis tube is rinsed with
3 mL methanol which are combined with the sample solution.
Solid phase extraction (manual procedure)
(All steps with a flow of 1–2 mL / min)
Column type:
CHROMABOND HR-X polypropylene columns (85 μm), 3 mL,
200 mg, (REF 730931)
®
Conditioning:
2 mL methanol, 2 mL water, 2 mL ammonium acetate buffer
(50 mmol/L)
Sample application:
with a flow of 1–2 mL/min
Washing:
5 mL water – methanol (7:3, v/v), then drying for 10 min
Elution:
3 mL hexane – ethyl acetate – glacial acetic acid (75:25:1, v/v/v)](https://image.slidesharecdn.com/brochure-cannabis-testing-en-200817133349/85/Macherey-Nagel-Cannabis-Testing-Brochure-34-320.jpg)
![35www.mn-net.com
Determination of THC in human urine with LC-MS
Automated solid phase extraction (LCTech FreeStyle™ SPE module)
Step Volume Dispensing speed Waiting time after dosage Dispense into
Conditioning with methanol 2 mL 2 mL/min 10 s waste
with water 2 mL 2 mL/min 10 s waste
with ammonium acetate buffer (50 mmol/L) 2 mL 2 mL/min 10 s waste
Load quantitative transfer over sample loop
from vial type 1@16 mL
12 mL 1 mL/min 25 s
rinse vial 3 times with water – methanol (7:3, v/v)
tube rinse volume: 1 mL
1 mL 0.3 mL/min waste
Washing water – methanol (7:3, v/v) 5 mL 2 mL/min 35 s waste
Drying with nitrogen (120 s) waste
Elution hexane – ethyl acetate – glacial acetic acid
(75:25:1, v/v/v)
3 mL 5 mL/min 15 s vial type
1@4 mL
Drying with air 20 mL 100 mL/min
Table 2: Automated procedure for solid phase extraction with LCTech Freestyle™ SPE module.
Eluent exchange:
Eluent exchange is performed manually. Eluates from the SPE
are evaporated to dryness at 40 °C under a stream of nitrogen
and then redissolved in an organic solvent suited for the
subsequent analysis. For HPLC-MS/MS 1 mL methanol is used.
Subsequent analysis: HPLC-MS/MS
Chromatographic conditions
Column:
EC 50/2 NUCLEOSHELL RP 18, 2.7 μm, (REF 763132.20)®
Eluent A:
water (ultrapure) + 0.1 % formic acid
Eluent B:
acetonitrile + 0.1 % formic acid
Gradient:
50–100 % B in 2.5 min, 100 % B for 2.5 min, 100–50 % B in
0.1 min, 50 % B for 2.4 min
Flow rate:
0.3 mL/min
Temperature:
40 °C
Injection volume:
5 μL
MS conditions:
API 3200 (AB Sciex), ion source ESI, positive ionization mode,
curtain gas 20 psig, ion spray voltage 5500 V, temperature
550 °C, nebulizer gas 20 psig, turbo gas 20 psig, CAD 6.0 psig
MRM transitions
Analyte [M+H]+
Q (Quantifier)1 Q (Qualifier)2
THC 315.2 193.2 123.1
THC–OH 331.2 313.3 43.1
THC–COOH 345.2 327.3 299.4
Table 3: MRM transitions for the analysis of THC and THC derivates.
Chromatograms
0
0 1 2 3 4 5 6 7 min
2000
1000
Intensity[cps]Intensity[cps]Intensity[cps]
1000
500
0
0 1 2 3 4 5 6 7
500
0
0 1 2 3 4 5 6 7
min
min
THCQ1
THCQ2
3.83 min
2.54 min
THC-COOHQ1
THC-COOHQ2
2.51 min
THC-OHQ1 THC-OHQ2
Figure 2: Chromatograms of HPLC-MS/MS analysis.](https://image.slidesharecdn.com/brochure-cannabis-testing-en-200817133349/85/Macherey-Nagel-Cannabis-Testing-Brochure-35-320.jpg)
![36 www.mn-net.com
Determination of THC in human urine with LC-MS
Calibration curves
THC
THC–COOH
THC–OH
5 10 15 20
40000
30000
20000
10000
Concentration [ng/mL] in urine
Intensity[cps]
Figure 3: Calibration curves of THC and THC-derivates in urine matrix.
Recovery rates
Analyte Recovery rate [in %]
Manual SPE
THC 80 ± 3
THC–OH 77 ± 10
THC–COOH 98 ± 8
Automated SPE (LCTech FreeStyle™)
THC 90 ± 9
THC–OH 80 ± 6
THC–COOH 93 ± 8
Table 4: Recovery rates for the manual and automated SPE methods (average
from triple determination).
LOD/LOQ
THC THC–OH THC–COOH
LOD (ng/mL urine) 0.12 0.75 0.33
LOQ (ng/mL urine) 0.17 1.29 0.75
Table 5: Limit of quantification (LOQ) and limit of detection (LOD), the concen-
tration that provides a signal-to-noise ratio (S/N) of > 3 was consid-
ered as LOD and S/N > 10 was considered as LOQ.
Conclusion
Using the automated FreeStyle™ SPE sample preparation system
in combination with CHROMABOND HR-X columns and a sub-
sequent LC-MS analysis using NUCLEOSHELL RP 18 showed
reliable results for the analysis of THC and its metabolites from
human urine. Using the automated system even better recovery
rates were found than using a manual SPE method.
®
®
References
1. Huestis, M.A. Simultaneous GC-EI-MS Determination of Δ⁹-Te-
trahydrocannabinol, 11-Hydroxy-Δ⁹-Tetrahydrocannabinol in
Human Urine Following Tandem Enzyme-Alkaline Hydrolysis,
J. Anal. Toxicol. 31 (8): 477–485 (2007).
2. Gorelick, D. A., Heishman, S. J., Methods in Molecular Medi-
cine: Marijuana and Cannabinoid Research, Humana Press:
235–253 (2005).
3. Guy, G. W., Whittle, B. A., Robson, P. J., The Medicinal Uses
of Cannabis and Cannabinoids, Pharmaceutical press (2004).
4. Blake, D. R., Robson, P., Ho, M., Jubb, R. W. McCabe, C. S.,
Preliminary assessment of the efficiacy, tolerability and safety
of a cannabis-based medicine in the treatment of pain caused
by rheumatoid arthritis, Rheumatology, 45 (1): 50–52 (2006).
Additional information
The following applications regarding “The Determination of THC
in human urine” and further applications can be found on our on-
line application database at https://ChromaAppDB.mn-net.com
SPE (manual procedure): MN Appl. No. 305990
SPE (automated procedure): MN Appl. No. 306000
HPLC: MN Appl. No. 127380
Acknowledgment
We thank the company LCTech GmbH for the cooperation and
for providing the robotic system, called FreeStyle SPE module.®](https://image.slidesharecdn.com/brochure-cannabis-testing-en-200817133349/85/Macherey-Nagel-Cannabis-Testing-Brochure-36-320.jpg)

![38 www.mn-net.com
Determination of THC in human urine with GC-MS
Determination of cannabinoids (THC) in urine
samples with GC-MS
MACHEREY-NAGEL application department · Dr. H. R. Wollseifen, A. Mengus-Kaya, T. Kretschmer
Abstract
This application describes the determination of cannabinoids
from urine matrix, prior to GC-MS analysis.
Introduction
There is an increasing interest in the determination of cannabi-
noids from different matrices like urine, hair and blood for phar-
macokinetic studies, drug treatment, workplace drug testing,
drug impaired driving investigations, and for evaluating the time of
cannabis use. Fast and sensitive procedures capable of quanti-
fying THC and its metabolites are necessary for all this application
fields.
Delta-9-tetrahydrocannabinol (THC) is the major psychoactive com-
ponent of marijuana and it will be quickly metabolized to hydroxy-
lated and carboxylated forms (THC-OH, THC-COOH) after con-
sumption [1]. THC, THC-OH and THC-COOH are conjugated
to glucuronide conjugates in human body to enhance water
solubility facilitating urinary excretion [2]. Total urine cannabinoid
conjugates can only be quantified by gas chromatography–mass
spectrometry (GC-MS) methods after hydrolysis prior to ex-
traction of urine sample. After a liquid-liquid extraction procedure
of hydrolyzed urine sample the extract was concentrated and
derivatized with MSTFA [3].
Using deuterated internal standards by GC-MS facilitates the
identification and quantitation of the focused analytes in sample
extracts.
Analyte R Formula M [g/mol]
THC CH3 C ₁H O2 30 2 314.5
THC-OH CH OH2 C ₁H O2 30 3 330.5
THC-COOH COOH C ₁H O2 28 4 344.4
Table 6: Compounds of interest.
Sample pretreatment
n Homogenize urine sample by stirring
n Fill 1 mL sample into a safe-lock tube (2 mL)
n Add standard solution, internal standard solution like described
in table 2
n Add 50 µL of β-glucuronidase solution (β = 2500 units/mL) and
125 µL phosphate buffer with pH 6.8
n Shake mixture and incubate in a shaking bath at 37 °C over
night (shaking speed 2000)
n Cool down samples at room temperature
n Add 125 µL sodium hydroxide solution (0.5 N) and 500 µL of a
mixture (ethyl acetate – n-hexane (9+1, v+v))
n Shake vigorously for 30 sec
n Centrifuge at room temperature at 13400 rpm for 10 min
n Take up organic phase for derivatization in a vial
n Add 125 µL acetic acid (99 %) and 500 µL of a mixture (ethyl
acetate – n-hexane (9+1, v+v)) to aqueous phase
n Shake vigorously for 30 min
n Centrifuge at room temperature at 13400 rpm for 10 min
n Add organic phase to the organic phase of first extraction
procedure
n Concentrate organic phase at 40 °C under nitrogen stream to
dryness
n Add 50 µL ethyl acetate and 50 µL MSTFA (REF 701270.201)
n Shake vigorously for 30 sec and incubate mixture at 80 °C for
30 min
n Take sample solution for GC-MS analysis
Spike level
[ng/mL]
Volume internal standard
mixture [µL]
Volume standard mixture
[µL]
0 50 0 (β = 1 µg/mL)
25 50 50 (β = 1 µg/mL)
50 50 100 (β = 1 µg/mL)
100 50 40 (β = 5 µg/mL)
150 50 60 (β = 5 µg/mL)
200 50 80 (β = 5 µg/mL)
250 50 100 (β = 5 µg/mL)
Table 7: Pipette scheme for sample pretreatment.](https://image.slidesharecdn.com/brochure-cannabis-testing-en-200817133349/85/Macherey-Nagel-Cannabis-Testing-Brochure-38-320.jpg)
![39www.mn-net.com
Determination of THC in human urine with GC-MS
Subsequent analysis: GC-MS
Chromatographic conditions
Column:
Optima 5 HT, 0.25 µm, 30 m, 0.25 mm ID (REF 726106.30)®
Injection volume:
1 µL
Injection Mode:
Splitless
Injection Temperature:
250 °C
Carrier Gas:
Helium
Column Flow:
1.31 mL/min
Oven Programm:
70 °C [2 min] [20 °C/min] 250 °C [4 min] [20 °C/min]
300 °C [17 min]
MS conditions:
GCMS-QP2010plus, Shimadzu, ion source EI, scan type SIM
Tune:
Autotune
Ion Source temperature:
200 °C
Interface temperature:
250 °C
Solvent delay:
4 min
Analyt Retention
time [min]
M/Z Registered
in SIM mode
Tetrahydrocannabinol (THC) 13.465 303, 371, 386
Hydroxy Tetrahydrocannabinol (THC-OH) 16.055 371, 459, 474
Carboxy Tetrahydrocannabinol
(THC-COOH)
17.180 371, 473, 488
D -Tetrahydrocannabinol (THC-D₃)3 13.440 306, 374, 389
D -Hydroxy Tetrahydrocannabinol
(THC-OH-D₃)
3 16.030 374, 462, 477
D -Carboxy Tetrahydrocannabinol
(THC-COOH-D₃)
3 17.160 374, 476, 491
Table 8: M/Z Registered in SIM mode for cannabinoids.
Chromatograms
4000
3500
3000
2500
2000
1500
1000
500
0
12.0 13.0 14.0 min
Intensity[cps]
THC
Figure 5: Chromatograms of THC and THC-D₃ from standard solution (β = 100
ng/mL).
7000
6000
5000
4000
3000
2000
1000
0
14.5 15.0 15.5 16.0 16.5 min
Intensity[cps]
THC-OH
Figure 6: Chromatograms of THC-OH and THC-OH-D₃ from standard solution
(β = 100 ng/mL).
5000
4500
4000
3500
3000
2500
2000
1500
1000
500
0
17.0 17.5 18.0 18.5 min
Intensity[cps]
THC-COOH
Figure 7: Chromatograms of THC-COOH and THC-COOH-D₃ from standard
solution (β = 100 ng/mL).](https://image.slidesharecdn.com/brochure-cannabis-testing-en-200817133349/85/Macherey-Nagel-Cannabis-Testing-Brochure-39-320.jpg)
![40 www.mn-net.com
Determination of THC in human urine with GC-MS
Chromatograms (cont.)
15000
10000
5000
0
12.0 12.5 13.0 13.5 14.0 min
Intensity[cps]
THC
Figure 8: Chromatograms of THC and THC-D₃ from spiked urine sample
(β = 150 ng/mL).
12000
10000
5000
0
14.5 15.0 15.5 16.0 16.5 min
Intensity[cps]
THC-OH
Figure 9: Chromatograms of THC-OH and THC-OH-D₃ from spiked urine sam-
ple (β = 150 ng/mL).
11000
10000
5000
0
17.0 17.5 18.0 18.5 min
Intensity[cps]
THC-COOH
Figure 10: Chromatograms of THC-COOH and THC-COOH-D₃ from spiked
urine sample (β = 150 ng/mL).
Calibration curves
0 50 100 150 200 250 300
Concentration [ng/mL]
30000
25000
20000
15000
10000
5000
0
Intensity[cps]
R = 0.99912
THC
THC-OH
THC-COOH
R = 0.99822
R = 0.99692
Figure 11: Calibration curves for cannabinoids in concentration range between
25 ng/mL and 250 µg/mL with an excellent coefficient of determina-
tion from standard solutions.
0 50 100 150 200 250 300
Concentration [ng/mL]
35000
30000
25000
20000
15000
10000
5000
0
R = 0.99782
THC
THC-OH
THC-COOH R2 = 0.9967
R = 0.99712
Intensity[cps]
Figure 12: Calibration curves for cannabinoids in concentration range between
25 ng/mL and 250 µg/mL with an excellent coefficient of determina-
tion from urine samples.
Conclusion
This application note shows that the determination of canna-
binoids from urine samples could be carried out successfully
with all the tested products. The calibration curve from standard
solution and urine samples indicate good linearity with excellent
correlation coefficients. Sample preparation and derivatization
procedure were simple and efficient for the determination of THC
and its metabolites from urine sample matrix. By using a MS de-
tector with higher sensitivity or a solid phase extraction method,
it would be possible to determine cannabinoids from urine in
lower concentration levels. In summary the presented application
describes a quick and convenient method for the determination
of cannabinoids from urine with a simple and efficient sample
preparation procedure.
References
1. Constituents of Cannabis sativa. Georg Thieme Verlag Stutt-
gart · New York.
2. F. Grotenhermen, Journal of Cannabis Therapeutics, Vol. 3(1)
2003, Clinical Pharmacokinetics of Cannabinoids.
3. T. Nadulski, F. Sporkert, M. Schnelle, A.M.l Stadelmann, P.
Roser, T. Schefter, F. Pragst, Journal of Analytical Toxicology,
Volume 29, Issue 8, 1 November 2005, Pages 782–789.](https://image.slidesharecdn.com/brochure-cannabis-testing-en-200817133349/85/Macherey-Nagel-Cannabis-Testing-Brochure-40-320.jpg)
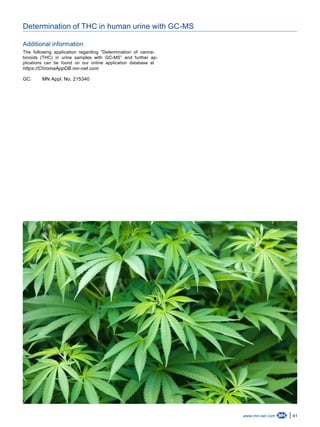
![42 www.mn-net.com
Determination of THC in plasma and serum with GC-MS
Determination of cannabinoids (THC) in plasma
and serum samples with GC-MS
MACHEREY-NAGEL application department · Dr. H. R. Wollseifen, A. Mengus-Kaya, T. Kretschmer
Abstract
This application describes the determination of cannabinoids
from plasma and serum matrix, prior to GC-MS analysis.
Introduction
There is an increasing interest in the determination of cannabinoids
from different matrices like plasma or serum for pharmacokinetic
studies, drug impaired driving investigations, and for evaluating
the time of cannabis use. Fast and sensitive procedures capable
of quantifying THC and its metabolites are necessary for all this
application fields.
Delta-9-tetrahydrocannabinol (THC) is the major psychoactive
component of marijuana and it will be quickly metabolized to hy-
droxylated and carboxylated forms (THC-OH, THC-COOH) after
consumption [1, 2]. The ratio of THC-OH to the parent compound
can be used to interpret the approximate time of use. Cannabis
consumption can be proofed by gas chromatography–mass
spectrometry (GC-MS) methods by analyzing THC and its me-
tabolized hydroxylated and carboxylated forms (THC-OH, THC-
COOH). After a liquid-liquid extraction procedure of biological
sample fluid the extract was concentrated and derivatized with
MSTFA [3].
Using deuterated internal standards by GC-MS facilitates the
identification and quantitation of the focused analytes in sample
extracts.
Analyte R Formula M [g/mol]
THC CH3 C H O21 30 2 314.5
THC-OH CH OH2 C H O21 30 3 330.5
THC-COOH COOH C H O21 28 4 344.4
Table 9: Compounds of interest.
Sample pretreatment
n Homogenize urine sample by stirring
n Fill 0.5 mL sample into a safe-lock tube
n Add standard solution, internal standard solution as described
in table 2
n Add 25 µL acetic acid (25 %) and 1000 µL of a mixture of ethyl
acetate – n-hexane (9+1, v+v)
n Shake vigorously for 30 sec
n Centrifuge at room temperature at 13400 rpm for 10 min
n Take up 500 µL of the organic phase for derivatization in a vial
n Concentrate organic phase at 40 °C under nitrogen stream to
dryness
n Add 50 µL ethyl acetate and 50 µL MSTFA (REF 701270.201)
n Shake vigorously for 30 sec and incubate mixture at 80 °C for
30 min
n Take sample solution for GC-MS analysis
Spike level
[ng/mL]
Volume internal standard
mixture [µL]
Volume standard mixture
[µL]
0 50 0 (β = 1 µg/mL)
25 50 50 (β = 1 µg/mL)
50 50 100 (β = 1 µg/mL)
100 50 40 (β = 5 µg/mL)
150 50 60 (β = 5 µg/mL)
200 50 80 (β = 5 µg/mL)
250 50 100 (β = 5 µg/mL)
Table 10: Pipette scheme for sample pretreatment.](https://image.slidesharecdn.com/brochure-cannabis-testing-en-200817133349/85/Macherey-Nagel-Cannabis-Testing-Brochure-42-320.jpg)
![43www.mn-net.com
Determination of THC in plasma and serum with GC-MS
Subsequent analysis: GC-MS
Chromatographic conditions
Column:
Optima 5 HT, 0.25 µm, 30 m, 0.25 mm ID (REF 726106.30)®
Injection volume:
1 µL
Injection Mode:
Splitless
Injection Temperature:
250 °C
Carrier Gas:
Helium
Column Flow:
1.31 mL/min
Oven Programm:
70 °C [2 min] [20 °C/min] 250 °C [4 min] [20 °C/min]
300 °C [17 min]
MS conditions:
GCMS-QP2010plus, Shimadzu, ion source EI, scan type SIM
Tune:
Autotune
Ion Source temperature:
200 °C
Interface temperature:
250 °C
Solvent delay:
4 min
Analyt Retention
time [min]
M/Z Registered
in SIM mode
Tetrahydrocannabinol (THC) 13.465 303, 371, 386
Hydroxy Tetrahydrocannabinol (THC-OH) 16.055 371, 459, 474
Carboxy Tetrahydrocannabinol
(THC-COOH)
17.180 371, 473, 488
D -Tetrahydrocannabinol (THC-D₃)3 13.440 306, 374, 389
D -Hydroxy Tetrahydrocannabinol
(THC-OH-D₃)
3 16.030 374, 462, 477
D -Carboxy Tetrahydrocannabinol
(THC-COOH-D₃)
3 17.160 374, 476, 491
Table 11: M/Z Registered in SIM mode for cannabinoids.
Chromatograms
4000
3500
3000
2500
2000
1500
1000
500
0
12.0 13.0 14.0 min
Intensity[cps]
THC
Figure 14: Chromatograms of THC and THC-D₃ from standard solution
(β = 100 ng/mL).
7000
6000
5000
4000
3000
2000
1000
0
14.5 15.0 15.5 16.0 16.5 min
Intensity[cps]
THC-OH
Figure 15: Chromatograms of THC-OH and THC-OH-D₃ from standard solu-
tion (β = 100 ng/mL).
5000
4500
4000
3500
3000
2500
2000
1500
1000
500
0
17.0 17.5 18.0 18.5 min
Intensity[cps]
THC-COOH
Figure 16: Chromatograms of THC-COOH and THC-COOH-D₃ from standard
solution (β = 100 ng/mL).](https://image.slidesharecdn.com/brochure-cannabis-testing-en-200817133349/85/Macherey-Nagel-Cannabis-Testing-Brochure-43-320.jpg)
![44 www.mn-net.com
Determination of THC in plasma and serum with GC-MS
Chromatograms (cont.)
2500
2000
1500
1000
500
0
12.0 12.5 13.0 13.5 14.0 min
Intensity[cps]
THC
Figure 17: Chromatograms of THC and THC-D₃ from spiked plasma sample
(β = 100 ng/mL).
17000
15000
12500
10000
7500
5000
2500
0
14.5 15.0 15.5 16.0 16.5 min
Intensity[cps]
THC-OH
Figure 18: Chromatograms of THC-OH and THC-OH-D₃ from spiked plasma
sample (β = 100 ng/mL).
15000
12500
10000
7500
5000
2500
0
17.0 17.5 18.0 18.5 min
Intensity[cps]
THC-COOH
Figure 19: Chromatograms of THC-COOH and THC-COOH-D₃ from spiked
plasma sample (β = 100 ng/mL).
1500
1000
500
0
12.0 13.0 14.0 min
Intensity[cps]
THC
Figure 20: Chromatograms of THC and THC-D₃ from serum (β = 100 ng/mL).
6000
5000
4000
3000
2000
1000
0
14.5 15.0 15.5 16.0 16.5 min
Intensity[cps]
THC-OH
Figure 21: Chromatograms of THC-OH and THC-OH-D₃ from serum
(β = 100 ng/mL).
5000
4000
3000
2000
1000
0
17.0 17.5 18.0 18.5 min
Intensity[cps]
THC-COOH
Figure 22: Chromatograms of THC-COOH and THC-COOH-D₃ from serum
(β = 100 ng/mL).](https://image.slidesharecdn.com/brochure-cannabis-testing-en-200817133349/85/Macherey-Nagel-Cannabis-Testing-Brochure-44-320.jpg)
![45www.mn-net.com
Determination of THC in plasma and serum with GC-MS
Calibration curves
0 50 100 150 200 250 300
Concentration [ng/mL]
30000
25000
20000
15000
10000
5000
0
Intensity[cps]
R = 0.99912
THC
THC-OH
THC-COOH
R = 0.99822
R = 0.99692
Figure 23: Calibration curves for cannabinoids in concentration range be-
tween 25 ng/mL and 250 μg/mL with an excellent coefficient of
determination from standard solutions.
0 50 100 150 200 250 300
Concentration [ng/mL]
14000
10000
6000
2000
0
Intensity[cps]
R = 0.99672
THC
THC-OH
THC-COOH
R = 0.99722
R = 0.99702
Figure 24: Calibration curves for cannabinoids in concentration range be-
tween 25 ng/mL and 250 μg/mL with an excellent coefficient of
determination from plasma samples.
0 50 100 150 200 250 300
Concentration [ng/mL]
30000
20000
10000
0
Intensity[cps]
R = 0.99452
THC
THC-OH
THC-COOH
R = 0.99832
R = 0.99612
Figure 25: Calibration curves for cannabinoids in concentration range be-
tween 25 ng/mL and 250 μg/mL with an excellent coefficient of
determination from serum samples.
Conclusion
This application note shows that the determination of canna-
binoids from plasma and serum samples could be carried out
successfully with all the tested products. The calibration curves
from standard solution and biological samples indicate good lin-
earity with good correlation coefficients. Sample preparation and
derivatization procedure were simple and efficient for the determi-
nation of THC and its metabolites from plasma and serum sample
matrix. By using a MS detector with higher sensitivity or a solid
phase extraction method, it would be possible to determine can-
nabinoids from biological samples in lower concentration levels.
In summary the presented application describes a quick and
convenient method for the determination of cannabinoids from
plasma and serum samples with simple and efficient sample
preparation procedure.
References
[1] Constituents of Cannabis sativa. Georg Thieme Verlag Stutt-
gart · New York.
[2] F. Grotenhermen, Journal of Cannabis Therapeutics, Vol. 3(1)
2003, Clinical Pharmacokinetics of Cannabinoids.
[3] T. Nadulski, F. Sporkert, M. Schnelle, A.M.l Stadelmann, P.
Roser, T. Schefter, F. Pragst, Journal of Analytical Toxicology,
Volume 29, Issue 8, 1 November 2005, Pages 782–789.
Additional information
The following application regarding “Determination of cannabi-
noids (THC) in plasma and serum samples with GC-MS” and fur-
ther applications can be found on our online application database
at https://ChromaAppDB.mn-net.com
GC: MN Appl. No. 215350](https://image.slidesharecdn.com/brochure-cannabis-testing-en-200817133349/85/Macherey-Nagel-Cannabis-Testing-Brochure-45-320.jpg)


![[Ada] extraction, isolation_and_purification_of_te(b-ok.cc)](https://cdn.slidesharecdn.com/ss_thumbnails/adaextractionisolationandpurificationofteb-ok-191207072854-thumbnail.jpg?width=640&height=640&fit=bounds)


