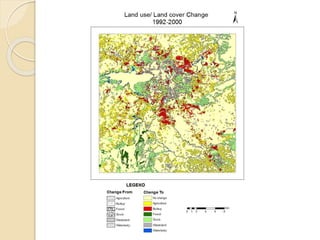
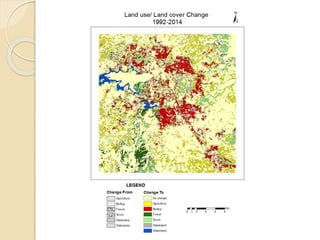
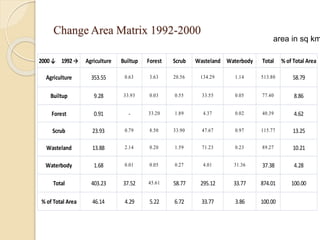
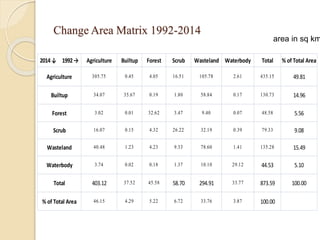
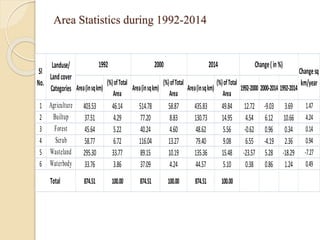
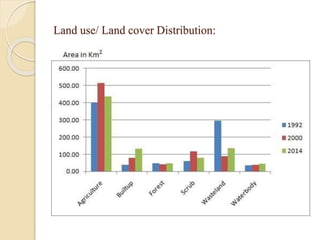
An Assessment of Urban Sprawl using Remote
Sensing and GIS Techniques:
A Case Study of Bhopal City and Peripheral Urban-Rural Fringe
MASTER OF TECHNOLOGY
IN
GEOMATICS
by
LOKESH PATEL
OVER VIEW
 Introduction to Urban Sprawl
 Aim and Objectives of the Study
 Software and Data Used
 Methodology
 Results & Discussions
 Recommendations
 Scope of the study
INTRODUCTION:
Urban sprawl is defined as the scattering of new
development on isolated tracts, separated from other
areas by vacant land.
This results in increase in the built-up area and related
changes in the urban landuse patterns, causing loss of
productive agricultural lands, forest cover, other forms
of greenery, loss in surface water bodies, depletion in
ground water aquifers and increasing levels of air and
water pollution; causing environmental problems.
AIM AND OBJECTIVES OF THE STUDY:
Aim: The precise aim of this present study is to find
out urban sprawl in Bhopal city and nearby area in
India, suggest planning to provide utility services.
Objectives:
1) To study land use/land cover using satellite
imageries,
2) To assess urban sprawl in the study area using
overlay analysis,
3) To implement the utility and planning for future
urban sprawl in terms of Services.
SOFTWARES AND DATA USED:
Softwares:
ESRI ARC GIS 10 version: ArcMap 10.0
ERDAS IMAGINE version 2011
Data:
LANDSAT ETM+ Satellite Imageries for the years 1992,
2000 and 2014.
Specification:
Spatial Reference: WGS_84 Zone 43
Resolution: 30 m
STUDYAREA:
METHODOLOGY:
RESULTS & DISCUSSIONS:
In the study area overall average increase in built-up
area by 10.66%; 4.54% in 1992 to 2000 and 6.12% in
2000 to 2014.
The built –up area increased from 37.51 sq. km. in
1992 to 77.20 sq.km. In 2000 which further increased
to 130.73 sq. km. in 2014 as a result of conversion of
previously crop land and wasteland existing around
settlement. One may expect such change in the study
area all account of increase in population over a period
of almost two decades.
The aerial extent of Agriculture registered an increase
of 12.72 % of total geographical area from 1992 to
2000. And further decreased -9.03 % during 2000 to
2014. The overall increase was 3.69 % of total
geographical area during 1992 to 2014.
During these periods major area under wasteland and
small area under Reservoir was transformed into
cropland However conversion of wasteland into
cropland was more during 1992-2000 than the year
2000-2014.
In case of forest, the land transformation in dense,
open and scrub was observed for the period 1992 –
2000 and 2000-2014. During this period dense forest
converted into scrub forest and somewhere scrub is
converted into forest.
Change Area Matrix 1992-2000
area in sq km
2000↓ 1992→ Agriculture Builtup Forest Scrub Wasteland Waterbody Total % of Total Area
Agriculture 353.55 0.63 3.63 20.56 134.29 1.14 513.80 58.79
Builtup 9.28 33.93 0.03 0.55 33.55 0.05 77.40 8.86
Forest 0.91 - 33.20 1.89 4.37 0.02 40.39 4.62
Scrub 23.93 0.79 8.50 33.90 47.67 0.97 115.77 13.25
Wasteland 13.88 2.14 0.20 1.59 71.23 0.23 89.27 10.21
Waterbody 1.68 0.01 0.05 0.27 4.01 31.36 37.38 4.28
Total 403.23 37.52 45.61 58.77 295.12 33.77 874.01 100.00
% of Total Area 46.14 4.29 5.22 6.72 33.77 3.86 100.00
Change Area Matrix 2000-2014
2014↓ 2000→ Agriculture Builtup Forest Scrub Wasteland Waterbody Total % of Total Area
Agriculture 393.60 2.12 1.77 14.57 19.99 3.36 435.41 49.82
Builtup 39.05 71.75 0.06 5.94 13.76 0.17 130.73 14.96
Forest 3.73 0.04 32.45 10.19 2.08 0.09 48.57 5.56
Scrub 14.66 0.50 3.03 51.19 9.57 0.42 79.36 9.08
Wasteland 57.80 2.78 3.04 27.29 42.90 1.50 135.30 15.48
Waterbody 5.04 0.22 0.02 6.54 0.88 31.85 44.55 5.10
Total 513.87 77.40 40.37 115.72 89.18 37.38 873.93 100.00
% of Total Area 58.80 8.86 4.62 13.24 10.20 4.28 100.00
area in sq km
Change Area Matrix 1992-2014
2014↓ 1992→ Agriculture Builtup Forest Scrub Wasteland Waterbody Total % of Total Area
Agriculture 305.75 0.45 4.05 16.51 105.78 2.61 435.15 49.81
Builtup 34.07 35.67 0.19 1.80 58.84 0.17 130.73 14.96
Forest 3.02 0.01 32.62 3.47 9.40 0.07 48.58 5.56
Scrub 16.07 0.15 4.32 26.22 32.19 0.39 79.33 9.08
Wasteland 40.48 1.23 4.23 9.33 78.60 1.41 135.28 15.49
Waterbody 3.74 0.02 0.18 1.37 10.10 29.12 44.53 5.10
Total 403.12 37.52 45.58 58.70 294.91 33.77 873.59 100.00
% of Total Area 46.15 4.29 5.22 6.72 33.76 3.87 100.00
area in sq km
Area Statistics during 1992-2014
Area(insqkm)
(%)ofTotal
Area
Area(insqkm)
(%)ofTotal
Area
Area(insqkm)
(%)ofTotal
Area
1992-2000 2000-2014 1992-2014
1 Agriculture 403.53 46.14 514.78 58.87 435.83 49.84 12.72 -9.03 3.69 1.47
2 Builtup 37.51 4.29 77.20 8.83 130.73 14.95 4.54 6.12 10.66 4.24
3 Forest 45.64 5.22 40.24 4.60 48.62 5.56 -0.62 0.96 0.34 0.14
4 Scrub 58.77 6.72 116.04 13.27 79.40 9.08 6.55 -4.19 2.36 0.94
5 Wasteland 295.30 33.77 89.15 10.19 135.36 15.48 -23.57 5.28 -18.29 -7.27
6 Waterbody 33.76 3.86 37.09 4.24 44.57 5.10 0.38 0.86 1.24 0.49
874.51 100.00 874.51 100.00 874.51 100.00
Changesq
km/year
Total
Landuse/
Landcover
Categories
Sl
No.
1992 2000 2014 Change(in%)
Land use/ Land cover Distribution:
RECOMMENDATIONS:
In the present study, most of the utility services are
concentrated in the core areas of the city hence
decentralization of these services are necessary for the
future planning.
The new techniques like satellite imageries (spatio-
temporal data) can be used for the forthcoming sprawl
and to resolve the problems arises through the sprawl.
In the view of transportation as a civic amenity, in the
study area numbers of depots are not well distributed.
Therefore even distribution of bus depots with
quantity, among the study area is recommended for
better transportation.
In the study area, hospitals are not evenly distributed.
It is strongly recommended that general hospitals run
by the government, municipal corporation or other
NGO’s should try to establish new hospitals in the
fringe areas of urban sprawl.
Taking the consideration/willingness of parents there is
increasing demand of English medium schools it is
recommended that BMC corporations should start
aided English medium primary schools.
The problems arise through urban sprawl and future
probable problems it is recommended that the policy
makers should consult with scientists, academicians,
administrators, planners, social organizations, NGO’s
and political leaders.
SCOPE OF THE STUDY:
The generated datasets can be integrated into an Urban
Resource Information System, which will provide an
effective management tool for utilization of the urban
resources. Such type of study has following types of
utilities.
a) Monitoring horizontal sprawl over different periods
of time.
b) Generation of utility database for emergency
planning.
c) Urban planning, including town planning.
d) Study of land use/ land cover.
e) Application of advanced GIS and Remote Sensing
technique to monitor the sprawl using temporal remote
sensing data.
LULC change detection

LULC change detection

  • 1.
    An Assessment ofUrban Sprawl using Remote Sensing and GIS Techniques: A Case Study of Bhopal City and Peripheral Urban-Rural Fringe MASTER OF TECHNOLOGY IN GEOMATICS by LOKESH PATEL
  • 2.
    OVER VIEW  Introductionto Urban Sprawl  Aim and Objectives of the Study  Software and Data Used  Methodology  Results & Discussions  Recommendations  Scope of the study
  • 3.
    INTRODUCTION: Urban sprawl isdefined as the scattering of new development on isolated tracts, separated from other areas by vacant land. This results in increase in the built-up area and related changes in the urban landuse patterns, causing loss of productive agricultural lands, forest cover, other forms of greenery, loss in surface water bodies, depletion in ground water aquifers and increasing levels of air and water pollution; causing environmental problems.
  • 4.
    AIM AND OBJECTIVESOF THE STUDY: Aim: The precise aim of this present study is to find out urban sprawl in Bhopal city and nearby area in India, suggest planning to provide utility services. Objectives: 1) To study land use/land cover using satellite imageries, 2) To assess urban sprawl in the study area using overlay analysis, 3) To implement the utility and planning for future urban sprawl in terms of Services.
  • 5.
    SOFTWARES AND DATAUSED: Softwares: ESRI ARC GIS 10 version: ArcMap 10.0 ERDAS IMAGINE version 2011 Data: LANDSAT ETM+ Satellite Imageries for the years 1992, 2000 and 2014. Specification: Spatial Reference: WGS_84 Zone 43 Resolution: 30 m
  • 6.
  • 7.
  • 14.
    RESULTS & DISCUSSIONS: Inthe study area overall average increase in built-up area by 10.66%; 4.54% in 1992 to 2000 and 6.12% in 2000 to 2014. The built –up area increased from 37.51 sq. km. in 1992 to 77.20 sq.km. In 2000 which further increased to 130.73 sq. km. in 2014 as a result of conversion of previously crop land and wasteland existing around settlement. One may expect such change in the study area all account of increase in population over a period of almost two decades.
  • 15.
    The aerial extentof Agriculture registered an increase of 12.72 % of total geographical area from 1992 to 2000. And further decreased -9.03 % during 2000 to 2014. The overall increase was 3.69 % of total geographical area during 1992 to 2014. During these periods major area under wasteland and small area under Reservoir was transformed into cropland However conversion of wasteland into cropland was more during 1992-2000 than the year 2000-2014. In case of forest, the land transformation in dense, open and scrub was observed for the period 1992 – 2000 and 2000-2014. During this period dense forest converted into scrub forest and somewhere scrub is converted into forest.
  • 16.
    Change Area Matrix1992-2000 area in sq km 2000↓ 1992→ Agriculture Builtup Forest Scrub Wasteland Waterbody Total % of Total Area Agriculture 353.55 0.63 3.63 20.56 134.29 1.14 513.80 58.79 Builtup 9.28 33.93 0.03 0.55 33.55 0.05 77.40 8.86 Forest 0.91 - 33.20 1.89 4.37 0.02 40.39 4.62 Scrub 23.93 0.79 8.50 33.90 47.67 0.97 115.77 13.25 Wasteland 13.88 2.14 0.20 1.59 71.23 0.23 89.27 10.21 Waterbody 1.68 0.01 0.05 0.27 4.01 31.36 37.38 4.28 Total 403.23 37.52 45.61 58.77 295.12 33.77 874.01 100.00 % of Total Area 46.14 4.29 5.22 6.72 33.77 3.86 100.00
  • 17.
    Change Area Matrix2000-2014 2014↓ 2000→ Agriculture Builtup Forest Scrub Wasteland Waterbody Total % of Total Area Agriculture 393.60 2.12 1.77 14.57 19.99 3.36 435.41 49.82 Builtup 39.05 71.75 0.06 5.94 13.76 0.17 130.73 14.96 Forest 3.73 0.04 32.45 10.19 2.08 0.09 48.57 5.56 Scrub 14.66 0.50 3.03 51.19 9.57 0.42 79.36 9.08 Wasteland 57.80 2.78 3.04 27.29 42.90 1.50 135.30 15.48 Waterbody 5.04 0.22 0.02 6.54 0.88 31.85 44.55 5.10 Total 513.87 77.40 40.37 115.72 89.18 37.38 873.93 100.00 % of Total Area 58.80 8.86 4.62 13.24 10.20 4.28 100.00 area in sq km
  • 18.
    Change Area Matrix1992-2014 2014↓ 1992→ Agriculture Builtup Forest Scrub Wasteland Waterbody Total % of Total Area Agriculture 305.75 0.45 4.05 16.51 105.78 2.61 435.15 49.81 Builtup 34.07 35.67 0.19 1.80 58.84 0.17 130.73 14.96 Forest 3.02 0.01 32.62 3.47 9.40 0.07 48.58 5.56 Scrub 16.07 0.15 4.32 26.22 32.19 0.39 79.33 9.08 Wasteland 40.48 1.23 4.23 9.33 78.60 1.41 135.28 15.49 Waterbody 3.74 0.02 0.18 1.37 10.10 29.12 44.53 5.10 Total 403.12 37.52 45.58 58.70 294.91 33.77 873.59 100.00 % of Total Area 46.15 4.29 5.22 6.72 33.76 3.87 100.00 area in sq km
  • 19.
    Area Statistics during1992-2014 Area(insqkm) (%)ofTotal Area Area(insqkm) (%)ofTotal Area Area(insqkm) (%)ofTotal Area 1992-2000 2000-2014 1992-2014 1 Agriculture 403.53 46.14 514.78 58.87 435.83 49.84 12.72 -9.03 3.69 1.47 2 Builtup 37.51 4.29 77.20 8.83 130.73 14.95 4.54 6.12 10.66 4.24 3 Forest 45.64 5.22 40.24 4.60 48.62 5.56 -0.62 0.96 0.34 0.14 4 Scrub 58.77 6.72 116.04 13.27 79.40 9.08 6.55 -4.19 2.36 0.94 5 Wasteland 295.30 33.77 89.15 10.19 135.36 15.48 -23.57 5.28 -18.29 -7.27 6 Waterbody 33.76 3.86 37.09 4.24 44.57 5.10 0.38 0.86 1.24 0.49 874.51 100.00 874.51 100.00 874.51 100.00 Changesq km/year Total Landuse/ Landcover Categories Sl No. 1992 2000 2014 Change(in%)
  • 20.
    Land use/ Landcover Distribution:
  • 21.
    RECOMMENDATIONS: In the presentstudy, most of the utility services are concentrated in the core areas of the city hence decentralization of these services are necessary for the future planning. The new techniques like satellite imageries (spatio- temporal data) can be used for the forthcoming sprawl and to resolve the problems arises through the sprawl. In the view of transportation as a civic amenity, in the study area numbers of depots are not well distributed. Therefore even distribution of bus depots with quantity, among the study area is recommended for better transportation.
  • 22.
    In the studyarea, hospitals are not evenly distributed. It is strongly recommended that general hospitals run by the government, municipal corporation or other NGO’s should try to establish new hospitals in the fringe areas of urban sprawl. Taking the consideration/willingness of parents there is increasing demand of English medium schools it is recommended that BMC corporations should start aided English medium primary schools. The problems arise through urban sprawl and future probable problems it is recommended that the policy makers should consult with scientists, academicians, administrators, planners, social organizations, NGO’s and political leaders.
  • 23.
    SCOPE OF THESTUDY: The generated datasets can be integrated into an Urban Resource Information System, which will provide an effective management tool for utilization of the urban resources. Such type of study has following types of utilities. a) Monitoring horizontal sprawl over different periods of time. b) Generation of utility database for emergency planning. c) Urban planning, including town planning. d) Study of land use/ land cover. e) Application of advanced GIS and Remote Sensing technique to monitor the sprawl using temporal remote sensing data.