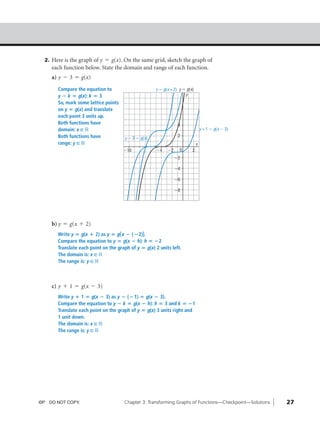
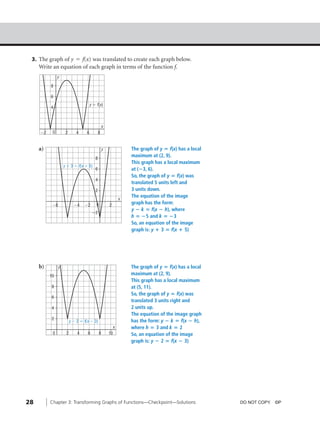
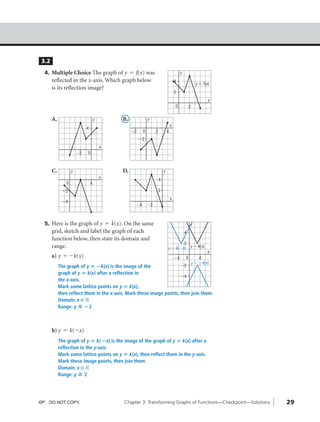
04_ch03a_pre-calculas12_wncp_solution.qxd      5/17/12    7:31 PM   Page 26


                                                       Home                 Quit


         Checkpoint: Assess Your Understanding, pages 213–218
          3.1
           1. Multiple Choice The graph of y ϭ Ϫ3x3 ϩ 4 is translated 4 units
                right and 5 units down. What is an equation of the translation
                image?
                A. y = -3(x + 4)3 + 9         B. y = -3(x - 4)3 + 9
                C. y = -3(x + 4)3 - 1         D. y = -3(x - 4)3 - 1


         26          Chapter 3: Transforming Graphs of Functions—Checkpoint—Solutions   DO NOT COPY. ©P
04_ch03a_pre-calculas12_wncp_solution.qxd      5/17/12    7:31 PM    Page 27


                                                       Home                    Quit


                2. Here is the graph of y = g(x). On the same grid, sketch the graph of
                   each function below. State the domain and range of each function.
                   a) y - 3 = g(x)
                     Compare the equation to                        y ϭ g(x + 2) y ϭ g(x)
                     y ؊ k ‫ ؍‬g(x): k ‫3 ؍‬                                            y
                     So, mark some lattice points
                     on y ‫ ؍‬g(x) and translate
                     each point 3 units up.
                     Both functions have
                     domain: x ç ‫ޒ‬
                                                                                4
                                                                                                y + 1 ϭ g(x Ϫ 3)
                     Both functions have                                        2
                                                    y Ϫ 3 ϭ g(x)
                     range: y ç ‫ޒ‬                                                           x
                                                    Ϫ10             Ϫ4    Ϫ2     0      2
                                                                               Ϫ2

                                                                               Ϫ4

                                                                               Ϫ6

                                                                               Ϫ8


                   b) y = g(x + 2)
                     Write y ‫ ؍‬g(x ؉ 2) as y ‫ ؍‬g( x ؊ (؊2)).
                     Compare the equation to y ‫ ؍‬g(x ؊ h): h ‫2؊ ؍‬
                     Translate each point on the graph of y ‫ ؍‬g(x) 2 units left.
                     The domain is: x ç ‫ޒ‬
                     The range is: y ç ‫ޒ‬


                   c) y + 1 = g(x - 3)
                     Write y ؉ 1 ‫ ؍‬g(x ؊ 3) as y ؊ (؊1) ‫ ؍‬g(x ؊ 3).
                     Compare the equation to y ؊ k ‫ ؍‬g(x ؊ h): h ‫ 3 ؍‬and k ‫1؊ ؍‬
                     Translate each point on the graph of y ‫ ؍‬g(x) 3 units right and
                     1 unit down.
                     The domain is: x ç ‫ޒ‬
                     The range is: y ç ‫ޒ‬


              ©P DO NOT COPY.                       Chapter 3: Transforming Graphs of Functions—Checkpoint—Solutions   27
04_ch03a_pre-calculas12_wncp_solution.qxd                           5/17/12     7:31 PM    Page 28


                                                                          Home                     Quit


           3. The graph of y = f(x) was translated to create each graph below.
              Write an equation of each graph in terms of the function f.
                        y

                   8

                   6
                                                y ϭ f(x)
                   4


                                                            x
              Ϫ2    0         2       4     6          8


              a)                                           y                  The graph of y ‫ ؍‬f(x) has a local
                                                                              maximum at (2, 9).
                                                   8
                                                                              This graph has a local maximum
                             y ϩ 3 ϭ f(x ϩ 5)
                                                   6                          at (؊3, 6).
                                                                              So, the graph of y ‫ ؍‬f(x) was
                                                   4
                                                                              translated 5 units left and
                                                   2                          3 units down.
                                                                              The equation of the image
                                                                      x
                    Ϫ8              Ϫ4    Ϫ2        0           2
                                                                              graph has the form:
                                                                              y ؊ k ‫ ؍‬f(x ؊ h), where
                                                 Ϫ2
                                                                              h ‫ 5؊ ؍‬and k ‫3؊ ؍‬
                                                                              So, an equation of the image
                                                                              graph is: y ؉ 3 ‫ ؍‬f(x ؉ 5)


              b)         y                                                    The graph of y ‫ ؍‬f(x) has a local
                   10                                                         maximum at (2, 9).
                                                                              This graph has a local maximum
                    8                                                         at (5, 11).
                                                                              So, the graph of y ‫ ؍‬f(x) was
                    6
                                                                              translated 3 units right and
                    4                                                         2 units up.
                                                                              The equation of the image graph
                    2
                                  y Ϫ 2 ϭ f(x Ϫ 3)                            has the form: y ؊ k ‫ ؍‬f(x ؊ h),
                                                                  x           where h ‫ 3 ؍‬and k ‫2 ؍‬
                    0         2       4     6           8       10            So, an equation of the image
                                                                              graph is: y ؊ 2 ‫ ؍‬f(x ؊ 3)


         28        Chapter 3: Transforming Graphs of Functions—Checkpoint—Solutions                               DO NOT COPY. ©P
04_ch03a_pre-calculas12_wncp_solution.qxd                 5/17/12   7:31 PM           Page 29


                                                                  Home                                    Quit


               3.2
                4. Multiple Choice The graph of y = f(x) was                                               y
                     reflected in the x-axis. Which graph below                                       4
                                                                                                                         y ϭ f(x)
                     is its reflection image?
                                                                                                      2
                                                                                                                                x
                                                                                                      0            2

                     A.                           y          B.              y
                                                                                                  x
                                          4
                                                                  Ϫ2     0        2           4
                                                                       Ϫ2
                                                      x
                                     Ϫ2   0


                     C.          y                           D.                           y
                                                      x
                                                                                      4
                             0                4
                           Ϫ2                                                         2
                                                                                                  x
                           Ϫ4
                                                                    Ϫ4       Ϫ2


                5. Here is the graph of y = k(x). On the same                                                      y
                     grid, sketch and label the graph of each                                                  4
                     function below, then state its domain and
                                                                                                      2
                     range.                                                                   y ϭ k(Ϫx) y ϭ k(x)
                                                                                                                               x
                     a) y = -k(x)                                                                     Ϫ4       0           4
                                                                                                                       y ϭ Ϫk(x)
                          The graph of y ‫؊ ؍‬k(x) is the image of the                Ϫ2
                          graph of y ‫ ؍‬k(x) after a reflection in
                                                                                    Ϫ4
                          the x-axis.
                          Mark some lattice points on y ‫ ؍‬k(x),
                          then reflect them in the x-axis. Mark these image points, then join them.
                          Domain: x ç ‫ޒ‬
                          Range: y ◊ ؊2


                     b) y = k(-x)
                          The graph of y ‫ ؍‬k(؊x) is the image of the graph of y ‫ ؍‬k(x) after a
                          reflection in the y-axis.
                          Mark some lattice points on y ‫ ؍‬k(x), then reflect them in the y-axis.
                          Mark these image points, then join them.
                          Domain: x ç ‫ޒ‬
                          Range: y » 2


              ©P DO NOT COPY.                                 Chapter 3: Transforming Graphs of Functions—Checkpoint—Solutions      29
04_ch03a_pre-calculas12_wncp_solution.qxd          5/17/12     7:31 PM           Page 30


                                                             Home                            Quit


           6. The graph of y = -x3 + 3x2 - x + 3 was reflected in the y-axis                                       10
                                                                                                                        y

                and its image is shown. What is an equation of the image?                                           8
                                                                                                                    6
                When the graph of y ‫ ؍‬f(x) is reflected in the y-axis, the equation of its                          4
                image is y ‫ ؍‬f(؊x).                                                                                 2
                                                                                                                                x
                So, an equation of the image is:                                                              Ϫ2    0       2
                y ‫ ؍‬f(؊x)
                y ‫؊(؊ ؍‬x)3 ؉ 3(؊x)2 ؊ (؊x) ؉ 3
                y ‫ ؍‬x3 ؉ 3x 2 ؉ x ؉ 3


          3.3
           7. Multiple Choice The point (Ϫ6, 2) lies on the graph of y = f(x).
                After vertical and horizontal stretches or compressions of the graph,
                the equation of the image is y = 3f(2x). Which point is the image of
                (Ϫ6, 2)?
                A. (Ϫ3, 6)     B. (Ϫ12, 6)        C. (Ϫ2, 4)             D. (Ϫ18, 1)


           8. Here is the graph of y = h(x).                             y
                                                                    12
                                                                                     y ϭ 2h(4x)
                On the same grid, sketch the
                                                                     8                            y ϭ h(x)
                graph of each function below,
                then state its domain and range.                     4                 1
                                                                                 yϭ      h(Ϫ2x)
                       1                                                               3
                a) y = 3h(-2x)                                                                            x
                                                        Ϫ4                       2       4    6       8
                   Compare y ‫ ؍‬ah(bx) to                         Ϫ4
                         1             1
                   y ‫ ؍‬h( ؊2x): a ‫؍‬      and b ‫2؊ ؍‬
                         3             3
                   So, the graph of y ‫ ؍‬h(x) is vertically compressed by a factor
                     1                                          1
                   of , horizontally compressed by a factor of , then reflected
                     3                                          2
                   in the y-axis. Use mental math and the transformation: (x, y)
                   on y ‫ ؍‬h(x) corresponds to a     , yb on y ‫ ؍‬h(؊2x), to
                                                  x 1          1
                                                  ؊2 3         3
                   mark some image points, then join them.
                   Domain: ؊4    ◊ x ◊ 2; range: ؊1 ◊ y ◊ 2


                b) y = 2h(4x)
                  Compare y ‫ ؍‬ah(bx) to y ‫2 ؍‬h(4x): a ‫ 2 ؍‬and b ‫4 ؍‬
                  So, the graph of y ‫ ؍‬h(x) is vertically stretched by a factor of 2, and
                                                           1
                  horizontally compressed by a factor of . Use mental math and the
                                                           4
                  transformation: (x, y) on y ‫ ؍‬h(x) corresponds to a , 2yb on y ‫2 ؍‬h(4x),
                                                                             x
                                                                             4
                  to mark some image points, then join them.
                  Domain: ؊1 ◊ x ◊ 2; range: ؊6 ◊ y ◊ 12


         30          Chapter 3: Transforming Graphs of Functions—Checkpoint—Solutions                                       DO NOT COPY. ©P
04_ch03a_pre-calculas12_wncp_solution.qxd        5/17/12     7:31 PM       Page 31


                                                          Home                         Quit


                9. The graph of y = g(x) is the image of               4
                                                                           y                    y ϭ f(x)
                                                                                            B
                                                                                   A
                   the graph of y = f(x) after a vertical
                                                                                                         x
                   and/or horizontal stretch and/or                    0           4    8       12     16
                   reflection. Corresponding points are             Ϫ4
                                                                                         AЈ
                   labelled. Write an equation of the image
                                                                    Ϫ8                      y ϭ g(x)
                   graph in terms of the function f.                                                         BЈ

                   Point A(4, 2) on y ‫ ؍‬f(x) corresponds to point A؅(8, ؊6) on y ‫ ؍‬g(x).
                   An equation for the image graph after a vertical or horizontal stretch or
                   compression can be written in the form y ‫ ؍‬af(bx).

                   A point (x, y) on y ‫ ؍‬f(x) corresponds to the point a , ayb on y ‫ ؍‬af(bx).
                                                                               x
                                                                               b
                   The image of A(4, 2) is a , a(2)b , which is A؅(8, ؊6).
                                             4
                                             b
                                                    1
                   Equate the x-coordinates: b ‫؍‬
                                                    2
                   Equate the y-coordinates: a ‫3؊ ؍‬
                   So, an equation of y ‫ ؍‬g(x) is: y ‫3؊ ؍‬f a xb
                                                              1
                                                              2
                   I used the coordinates of B and B؅, and mental math to verify the equation.


              ©P DO NOT COPY.                           Chapter 3: Transforming Graphs of Functions—Checkpoint—Solutions   31

Pc12 sol c03_cp

  • 1.
    04_ch03a_pre-calculas12_wncp_solution.qxd 5/17/12 7:31 PM Page 26 Home Quit Checkpoint: Assess Your Understanding, pages 213–218 3.1 1. Multiple Choice The graph of y ϭ Ϫ3x3 ϩ 4 is translated 4 units right and 5 units down. What is an equation of the translation image? A. y = -3(x + 4)3 + 9 B. y = -3(x - 4)3 + 9 C. y = -3(x + 4)3 - 1 D. y = -3(x - 4)3 - 1 26 Chapter 3: Transforming Graphs of Functions—Checkpoint—Solutions DO NOT COPY. ©P
  • 2.
    04_ch03a_pre-calculas12_wncp_solution.qxd 5/17/12 7:31 PM Page 27 Home Quit 2. Here is the graph of y = g(x). On the same grid, sketch the graph of each function below. State the domain and range of each function. a) y - 3 = g(x) Compare the equation to y ϭ g(x + 2) y ϭ g(x) y ؊ k ‫ ؍‬g(x): k ‫3 ؍‬ y So, mark some lattice points on y ‫ ؍‬g(x) and translate each point 3 units up. Both functions have domain: x ç ‫ޒ‬ 4 y + 1 ϭ g(x Ϫ 3) Both functions have 2 y Ϫ 3 ϭ g(x) range: y ç ‫ޒ‬ x Ϫ10 Ϫ4 Ϫ2 0 2 Ϫ2 Ϫ4 Ϫ6 Ϫ8 b) y = g(x + 2) Write y ‫ ؍‬g(x ؉ 2) as y ‫ ؍‬g( x ؊ (؊2)). Compare the equation to y ‫ ؍‬g(x ؊ h): h ‫2؊ ؍‬ Translate each point on the graph of y ‫ ؍‬g(x) 2 units left. The domain is: x ç ‫ޒ‬ The range is: y ç ‫ޒ‬ c) y + 1 = g(x - 3) Write y ؉ 1 ‫ ؍‬g(x ؊ 3) as y ؊ (؊1) ‫ ؍‬g(x ؊ 3). Compare the equation to y ؊ k ‫ ؍‬g(x ؊ h): h ‫ 3 ؍‬and k ‫1؊ ؍‬ Translate each point on the graph of y ‫ ؍‬g(x) 3 units right and 1 unit down. The domain is: x ç ‫ޒ‬ The range is: y ç ‫ޒ‬ ©P DO NOT COPY. Chapter 3: Transforming Graphs of Functions—Checkpoint—Solutions 27
  • 3.
    04_ch03a_pre-calculas12_wncp_solution.qxd 5/17/12 7:31 PM Page 28 Home Quit 3. The graph of y = f(x) was translated to create each graph below. Write an equation of each graph in terms of the function f. y 8 6 y ϭ f(x) 4 x Ϫ2 0 2 4 6 8 a) y The graph of y ‫ ؍‬f(x) has a local maximum at (2, 9). 8 This graph has a local maximum y ϩ 3 ϭ f(x ϩ 5) 6 at (؊3, 6). So, the graph of y ‫ ؍‬f(x) was 4 translated 5 units left and 2 3 units down. The equation of the image x Ϫ8 Ϫ4 Ϫ2 0 2 graph has the form: y ؊ k ‫ ؍‬f(x ؊ h), where Ϫ2 h ‫ 5؊ ؍‬and k ‫3؊ ؍‬ So, an equation of the image graph is: y ؉ 3 ‫ ؍‬f(x ؉ 5) b) y The graph of y ‫ ؍‬f(x) has a local 10 maximum at (2, 9). This graph has a local maximum 8 at (5, 11). So, the graph of y ‫ ؍‬f(x) was 6 translated 3 units right and 4 2 units up. The equation of the image graph 2 y Ϫ 2 ϭ f(x Ϫ 3) has the form: y ؊ k ‫ ؍‬f(x ؊ h), x where h ‫ 3 ؍‬and k ‫2 ؍‬ 0 2 4 6 8 10 So, an equation of the image graph is: y ؊ 2 ‫ ؍‬f(x ؊ 3) 28 Chapter 3: Transforming Graphs of Functions—Checkpoint—Solutions DO NOT COPY. ©P
  • 4.
    04_ch03a_pre-calculas12_wncp_solution.qxd 5/17/12 7:31 PM Page 29 Home Quit 3.2 4. Multiple Choice The graph of y = f(x) was y reflected in the x-axis. Which graph below 4 y ϭ f(x) is its reflection image? 2 x 0 2 A. y B. y x 4 Ϫ2 0 2 4 Ϫ2 x Ϫ2 0 C. y D. y x 4 0 4 Ϫ2 2 x Ϫ4 Ϫ4 Ϫ2 5. Here is the graph of y = k(x). On the same y grid, sketch and label the graph of each 4 function below, then state its domain and 2 range. y ϭ k(Ϫx) y ϭ k(x) x a) y = -k(x) Ϫ4 0 4 y ϭ Ϫk(x) The graph of y ‫؊ ؍‬k(x) is the image of the Ϫ2 graph of y ‫ ؍‬k(x) after a reflection in Ϫ4 the x-axis. Mark some lattice points on y ‫ ؍‬k(x), then reflect them in the x-axis. Mark these image points, then join them. Domain: x ç ‫ޒ‬ Range: y ◊ ؊2 b) y = k(-x) The graph of y ‫ ؍‬k(؊x) is the image of the graph of y ‫ ؍‬k(x) after a reflection in the y-axis. Mark some lattice points on y ‫ ؍‬k(x), then reflect them in the y-axis. Mark these image points, then join them. Domain: x ç ‫ޒ‬ Range: y » 2 ©P DO NOT COPY. Chapter 3: Transforming Graphs of Functions—Checkpoint—Solutions 29
  • 5.
    04_ch03a_pre-calculas12_wncp_solution.qxd 5/17/12 7:31 PM Page 30 Home Quit 6. The graph of y = -x3 + 3x2 - x + 3 was reflected in the y-axis 10 y and its image is shown. What is an equation of the image? 8 6 When the graph of y ‫ ؍‬f(x) is reflected in the y-axis, the equation of its 4 image is y ‫ ؍‬f(؊x). 2 x So, an equation of the image is: Ϫ2 0 2 y ‫ ؍‬f(؊x) y ‫؊(؊ ؍‬x)3 ؉ 3(؊x)2 ؊ (؊x) ؉ 3 y ‫ ؍‬x3 ؉ 3x 2 ؉ x ؉ 3 3.3 7. Multiple Choice The point (Ϫ6, 2) lies on the graph of y = f(x). After vertical and horizontal stretches or compressions of the graph, the equation of the image is y = 3f(2x). Which point is the image of (Ϫ6, 2)? A. (Ϫ3, 6) B. (Ϫ12, 6) C. (Ϫ2, 4) D. (Ϫ18, 1) 8. Here is the graph of y = h(x). y 12 y ϭ 2h(4x) On the same grid, sketch the 8 y ϭ h(x) graph of each function below, then state its domain and range. 4 1 yϭ h(Ϫ2x) 1 3 a) y = 3h(-2x) x Ϫ4 2 4 6 8 Compare y ‫ ؍‬ah(bx) to Ϫ4 1 1 y ‫ ؍‬h( ؊2x): a ‫؍‬ and b ‫2؊ ؍‬ 3 3 So, the graph of y ‫ ؍‬h(x) is vertically compressed by a factor 1 1 of , horizontally compressed by a factor of , then reflected 3 2 in the y-axis. Use mental math and the transformation: (x, y) on y ‫ ؍‬h(x) corresponds to a , yb on y ‫ ؍‬h(؊2x), to x 1 1 ؊2 3 3 mark some image points, then join them. Domain: ؊4 ◊ x ◊ 2; range: ؊1 ◊ y ◊ 2 b) y = 2h(4x) Compare y ‫ ؍‬ah(bx) to y ‫2 ؍‬h(4x): a ‫ 2 ؍‬and b ‫4 ؍‬ So, the graph of y ‫ ؍‬h(x) is vertically stretched by a factor of 2, and 1 horizontally compressed by a factor of . Use mental math and the 4 transformation: (x, y) on y ‫ ؍‬h(x) corresponds to a , 2yb on y ‫2 ؍‬h(4x), x 4 to mark some image points, then join them. Domain: ؊1 ◊ x ◊ 2; range: ؊6 ◊ y ◊ 12 30 Chapter 3: Transforming Graphs of Functions—Checkpoint—Solutions DO NOT COPY. ©P
  • 6.
    04_ch03a_pre-calculas12_wncp_solution.qxd 5/17/12 7:31 PM Page 31 Home Quit 9. The graph of y = g(x) is the image of 4 y y ϭ f(x) B A the graph of y = f(x) after a vertical x and/or horizontal stretch and/or 0 4 8 12 16 reflection. Corresponding points are Ϫ4 AЈ labelled. Write an equation of the image Ϫ8 y ϭ g(x) graph in terms of the function f. BЈ Point A(4, 2) on y ‫ ؍‬f(x) corresponds to point A؅(8, ؊6) on y ‫ ؍‬g(x). An equation for the image graph after a vertical or horizontal stretch or compression can be written in the form y ‫ ؍‬af(bx). A point (x, y) on y ‫ ؍‬f(x) corresponds to the point a , ayb on y ‫ ؍‬af(bx). x b The image of A(4, 2) is a , a(2)b , which is A؅(8, ؊6). 4 b 1 Equate the x-coordinates: b ‫؍‬ 2 Equate the y-coordinates: a ‫3؊ ؍‬ So, an equation of y ‫ ؍‬g(x) is: y ‫3؊ ؍‬f a xb 1 2 I used the coordinates of B and B؅, and mental math to verify the equation. ©P DO NOT COPY. Chapter 3: Transforming Graphs of Functions—Checkpoint—Solutions 31