A detailed analysis of three major dynamics and Non Linear analysis was done, which included:
1. Normal Modes and Frequency Response Analysis (FRA).
2. Large Deformation, Geometric Non-Linearity.
3. Elastoplastic Material Analysis, Material Non-Linearity.
Designed a torque arm, with Multi Point Constraints applied to the center of the arm. The FEA software used for this purpose was ABAQUS. The analysis was performed two major element types: Triangular Elements and Quadrilateral Elements, with relatively equal number of nodes in each case and a convergence study was conducted. The aim of the project was to obtain the optimal design parameters of the torque arm by optimization (minimize weight).
The document summarizes a finite element analysis of a torque arm performed in Abaqus to optimize the design. It includes:
1) A preliminary analysis using mechanics of materials approximations to estimate stress and displacement.
2) An analysis of different element types to determine appropriate meshing.
3) A convergence study to determine optimal mesh size.
4) A parameter study that varies arm dimensions to minimize mass while meeting stress constraints.
The analysis aims to find the lightest torque arm design that keeps stresses below 240 MPa.
A finite element analysis was performed on a 6 bay plane truss structure using ABAQUS software to determine deflections and member forces under tension, shear, and bending loads. The results were used to calculate equivalent cross-sectional properties, assuming the truss behaved like a cantilever beam. Additional analysis was conducted using fully stressed design to minimize the structure's weight by resizing members to be fully stressed at their allowable limit of 100 MPa under at least one load case, while maintaining a minimum gauge of 0.1 cm^2. Iterative resizing reduced member areas and increased stresses until all members were fully stressed at their limits.
- The document describes a simple, high sensitivity system for measuring magnetostriction in thin film or foil samples.
- The system uses a strain gauge to measure voltage changes caused by dimensional changes in the sample when placed in a rotating magnetic field provided by Nd-Fe-B magnets.
- Data processing involves subtracting positive and negative bias measurements to isolate the magnetostriction component, then using relationships between voltage, strain, and magnetization to calculate the magnitude of magnetostriction.
This document describes a tunable dynamics platform for milling experiments that uses an eddy current damper to introduce adjustable damping. The platform uses a leaf-type flexure to support the workpiece, allowing adjustment of stiffness and natural frequency. An eddy current damper embedded in the flexure provides a model-based means of tuning damping. Experimental validation showed the damper increased damping by 229% and expanded stability limits as predicted by modeling, demonstrating the platform's ability to prescribe structural dynamics for machining stability testing.
1. A finite element analysis was conducted on an original aluminum bicycle crankarm design and three redesigns to reduce weight by at least 50% while maintaining structural integrity.
2. The optimal mesh was determined to be a Sweep (Quad/Tri) mesh with an element size of 2.5mm based on convergence of maximum deformation values.
3. Analysis of the original design found maximum deformation and stress occurred at 90 degrees of applied force. Redesign 1, a basic I-beam shape, reduced mass by 59.53% while maintaining lowest structural stresses and errors.
Application of particle swarm optimization to microwave tapered microstrip linescseij
Application of metaheuristic algorithms has been of continued interest in the field of electrical engineering
because of their powerful features. In this work special design is done for a tapered transmission line used
for matching an arbitrary real load to a 50Ω line. The problem at hand is to match this arbitray load to 50
Ω line using three section tapered transmission line with impedances in decreasing order from the load. So
the problem becomes optimizing an equation with three unknowns with various conditions. The optimized
values are obtained using Particle Swarm Optimization. It can easily be shown that PSO is very strong in
solving this kind of multiobjective optimization problems.
Reliability Analysis of the Sectional Beams Due To Distribution of Shearing S...researchinventy
This paper shows the results of the Reliability Analysis of the sectional beams due to distribution of Shear Stress. It is assumed that the load was uniformly distributed over the beam. It is discussed that the distribution of shear stress over the beam. It is discussed that the average shears stress and maximum shear stress across the section of the beam for Weibull distribution. The reliability analysis of distribution of shearing stresses over sectional beams is performed. Also it is derived that the hazard functions for these types of beams. Reliability comparison has also been done for the sectional beams. It is observed that the reliability of the beam decreased when the width (b) of the beam decreases, and the load (F) is high. The reliability of the beam is increased when the height (h) of the triangular section increases , diameter(d) of the circular beam is increased and parameter 푘 decreasses
This document summarizes research on the dynamic properties of a magnetic levitation system using high-temperature superconductors. Researchers measured the spring constant and damping constant of the system by analyzing its damped oscillatory behavior. They found that the spring constant decreased with increasing initial oscillation position, while the damping constant increased. They also proposed a new measurement method using repetitive control to evaluate properties as a function of oscillation velocity. This showed both spring and damping constants decreased with increasing input frequency. Analysis of hysteresis losses implied hysteresis significantly affects oscillation attenuation. In summary, the document examines the dynamic behavior of a superconductor-based magnetic levitation system through oscillation analysis and a new repetitive control method.
Higher-Order Squeezing of a Generic Quadratically-Coupled Optomechanical SystemIOSRJAP
Using short-time dynamics and analytical solution of Heisenberg equation of motion for the Hamiltonian of quadratically-coupled optomechanical system for different field modes, we have investigated the existence of higher-order single mode squeezing, sum squeezing and difference squeezing in absence of driving and dissipation. Depth of squeezing increases with order number for higher-order single mode squeezing. Squeezing factor exhibits a series of revival-collapse phenomena for single mode, which becomes more pronounced as order number increases. In case of sum squeezing amounts of squeezing is greater than single mode higher-order squeezing (n = 2). It is also greater than from difference squeezing for same set of interaction parameters. Sum squeezing is prominently better for extracting information regarding squeezing.
1. The document discusses four common failure theories used in engineering: maximum shear stress theory, maximum principal stress theory, maximum normal strain theory, and maximum shear strain theory.
2. It provides details on the maximum shear stress (Tresca) theory, which states that failure occurs when the maximum shear stress equals the yield point stress under simple tension.
3. An example problem is presented involving determining the required diameter of a circular shaft using the maximum shear stress theory with a safety factor of 3, given the material properties and loads on the shaft.
Finite element analysis (FEA) is a numerical technique used to approximate solutions to boundary value problems by dividing the domain into smaller elements. The document discusses the three main stages of FEA: building the model, solving the model, and displaying the results. It provides details on how to create nodes and finite elements to represent an object's geometry, assign material properties and constraints, define the type of analysis, and select parameters to display in the results. Examples of different types of FEA analyses are also listed, such as static, thermal, modal, and buckling analyses.
This document discusses Mohr's circle and its representation of different states of stress, including uniaxial tension and compression, biaxial tension and compression, triaxial tension and compression, and combined tension and compression. It also covers engineering stress-strain curves and how they are obtained from tensile testing. Key parameters like yield strength, tensile strength, ductility measures, and how the curve is influenced by material properties and prior processing are summarized. Videos are embedded to demonstrate some of the stress states and a wire drawing process.
This summary provides the key details about four failure theories in 3 sentences:
The document discusses four common failure theories: 1) Maximum shear stress (Tresca) theory, which predicts failure when maximum shear stress equals yield stress, applies to ductile materials. 2) Maximum principal stress (Rankine) theory, which predicts failure when largest principal stress reaches ultimate stress. 3) Maximum normal strain (Saint Venant) theory, which predicts failure when maximum normal strain equals yield strain. 4) Maximum shear strain (distortion energy) theory, which predicts failure when distortion energy per unit volume equals strain energy at failure. The theories attempt to predict failure of materials subjected to multiaxial stress states.
Examining Non-Linear Transverse Vibrations of Clamped Beams Carrying N Concen...ijceronline
The discrete model used is an N-Degree of Freedom system made of N masses placed at the ends of solid bars connected by springs, presenting the beam flexural rigidity. The large transverse displacements of the bar ends induce a variation in their lengths giving rise to axial forces modeled by longitudinal springs causing nonlinearity. Nonlinear vibrations of clamped beam carrying n masses at various locations are examined in a unified manner. A method based on Hamilton’s principle and spectral analysis has been applied recently to nonlinear transverse vibrations of discrete clamped beam, leading to calculation of the nonlinear frequencies. After solution of the corresponding linear problem and determination of the linear eigen vectors and eigen values, a change of basis, from the initial basis, i.e. the displacement basis (DB) to the modal basis (MB), has been performed using the classical matrix transformation. The nonlinear algebraic system has then been solved in the modal basis using an explicit method and leading to nonlinear frequency response function in the neighborhood of the first mode. If the masses are placed where the amplitudes are maximized, stretching in the bars becomes significant causing increased nonlinearity
This document outlines the use of the finite element method to analyze beam problems. It discusses:
1) Discretizing beams into elements, representing distributed loads as equivalent nodal forces, and assembling the global stiffness matrix.
2) Solving for unknown displacements and rotations using the reduced stiffness matrix after applying boundary conditions.
3) Calculating the effective global nodal forces to determine support reactions and internal forces.
Several examples are provided to demonstrate solving beam problems with different loading conditions using this finite element process in 3 steps.
This document discusses the results of an investigation into splitting of timber dowel joints. It summarizes the following key points in 3 sentences:
The document critiques the empirical methods used in previous studies, arguing they do not fit theoretical models and have high variability. It then precisely fits the experimental data from one study to limit analysis theory, demonstrating a 10% coefficient of variation. The analysis shows the empirical data can be trusted but that exact theory, not empirical approaches, provides the proper design rules for timber dowel joints.
This project involves analyzing a plane truss structure using finite element analysis to determine stresses and displacements under different loading conditions. The truss is modeled and analyzed for three loading cases. Equivalent beam properties are then determined for the truss. Finally, the analysis is repeated after extending the truss by two additional bays to observe how the properties change with the increased size.
This document discusses three common failure theories: 1) Maximum Normal Stress Theory, which applies to brittle materials and states failure occurs when normal stresses exceed a threshold; 2) Maximum Shear Stress Theory, which is conservative and applies to ductile materials, stating failure occurs when shear stresses exceed a limit; and 3) Distortion Energy Theory, which more accurately models ductile failure as a function of both normal and shear stresses. Each theory is accompanied by a design equation to calculate failure thresholds.
Maximum principal stress theory.
Maximum shear stress theory.
Maximum shear strain theory.
Maximum strain energy theory.
Maximum shear strain energy theory.
Students used a charpy impact tester to collect data on testing brass and marble specimens. They analyzed the data to calculate the absorbed impact energy, work done during impact, and elastic and plastic portions of energy absorption. Brass absorbed more energy and required more work to fracture, showing it is the stronger material. The rate at which a force is applied affects material properties, and dynamic loading is different than static loading since the applied force is not constant during impact.
FREQUENCY RESPONSE ANALYSIS OF 3-DOF HUMAN LOWER LIMBSIJCI JOURNAL
Frequent and prolonged expose of human body to vibrations can induce back pain and physical disorder
and degeneration of tissue. The biomechanical model of human lower limbs are modeled as a three degree
of freedom linear spring-mass-damper system to estimate forces and frequencies. Then three degree of
freedom system was analysed using state space method to find natural frequency and mode shape. A
program was develop to solve simplified equations and results were plotted and discussed in detail. The
mass, stiffness and damping coefficient of various segments are taken from references. The optimal values
of the damping ratios of the body segments are estimated, for the three degrees of freedom model. At last
resonance frequencies are found to avoid expose of lower limbs to such environment for optimum comfort.
The document discusses various theories of failure that are used to determine the safe dimensions of components under combined loading conditions. It describes five theories: (1) Maximum principal stress theory, (2) Maximum principal strain theory, (3) Maximum strain energy theory, (4) Maximum distortion energy theory, and (5) Maximum shear stress theory. The maximum distortion energy theory provides the safest design for ductile materials as it results in the largest allowable stresses before failure compared to the other theories. The document also compares the various theories and discusses when each is best applied depending on the material type and stress conditions.
Multi-Objective Genetic Topological Optimization for Design of composite wall...Sardasht S. Weli
The aim of this presentation is to show the utilization of Topology Optimization to optimize a wall barrier thickness and its resistance under the extreme environment which is blast loading.
INTRODUCTION TO FINITE ELEMENT ANALYSISAchyuth Peri
Finite element analysis (FEA) is a numerical technique used to find approximate solutions to partial differential equations. It involves dividing a system into small elements and solving for variables within each element. This allows for analysis of complex geometries, loadings, and materials. The FEM process includes discretizing the system, selecting functions to approximate the solution, assembling element equations into a global system, applying boundary conditions, and calculating displacements, stresses, and strains. FEA offers advantages like analyzing irregular shapes and nonlinear problems, reducing testing costs, and optimizing designs.
The part is axisymmetrically modeled in solidworks(2D) before importing to ansys workbench where the boundary zones are identified and appropriate mesh settings is applied. The model is then imported in Fluent for analysis . Significant setting changes are Density based solver , Enhanced Eddy viscosity model with near wall treatment , solution steering , FMG initialization etc.
Finite Element Analysis (FEA) is a numerical method for solving complex engineering problems. The document discusses conducting FEA on a fixed-free cantilever beam to study the effect of mesh density on solution accuracy. Analytical solutions are derived and used to validate FEA results. A beam model is created in ABAQUS with varying element sizes. As element count increases, FEA results converge towards analytical solutions, though with increased computation time. An element count of 4125 provided an optimal balance between accuracy and cost.
International Journal of Engineering Research and Applications (IJERA) is an open access online peer reviewed international journal that publishes research and review articles in the fields of Computer Science, Neural Networks, Electrical Engineering, Software Engineering, Information Technology, Mechanical Engineering, Chemical Engineering, Plastic Engineering, Food Technology, Textile Engineering, Nano Technology & science, Power Electronics, Electronics & Communication Engineering, Computational mathematics, Image processing, Civil Engineering, Structural Engineering, Environmental Engineering, VLSI Testing & Low Power VLSI Design etc.
1) The document analyzes the boundedness and domain of attraction of a fractional-order wireless power transfer (WPT) system.
2) It establishes a fractional-order piecewise affine model of the WPT system and derives sufficient conditions for boundedness using Lyapunov functions and inequality techniques.
3) The results provide a way to estimate the domain of attraction of the fractional-order WPT system and systems with periodically intermittent control.
2016 Fall ME 7210 Elasticity and Plasticity Final ProjectJoey F An
This project analyzes the stress field in a uniform loaded strip over a half-space using both theoretical equations and finite element analysis in Solidworks. The theoretical equations from a textbook are implemented in MATLAB to calculate and plot stress along three lines. Different boundary conditions are tested in FEA and the correct boundary condition is fixtures on the bottom and sides with roller supports. Mesh size is refined to better match the theoretical results. The FEA analysis generally agrees with theory, validating the use of plane stress assumptions to model this problem.
Stress Analysis of Chain Links in Different Operating Conditionsinventionjournals
The work covers the stress analysis in a 3D model of chain link analitically and numerically, and based on a real model, experimental examination was carried out. First, the cases when the links are vertical to each other and their tensile load were considered. The analysis was done in both work and experimental conditions and also the tensile load just before the chain broke. Second, the position in which the links are rotated for the calculated maximum angle. Experimental analysis of the high resistance chain (high hardness), insignia stress 14x50 G80 E5 was carried out on an universal testing mashine and the results are used for verification of numerical model.
A Weighted Duality based Formulation of MIMO SystemsIJERA Editor
This work is based on the modeling and analysis of multiple-input multiple-output (MIMO) system in downlink communication system. We take into account a recent work on the ratio of quadratic forms to formulate the weight matrices of quadratic norm in a duality structure. This enables us to achieve exact solutions for MIMO system operating under Rayleigh fading channels. We outline couple of scenarios dependent on the structure of eigenvalues to investigate the system behavior. The results obtained are validated by means of Monte Carlo simulations.
Comparative Study between DCT and Wavelet Transform Based Image Compression A...IOSR Journals
This document compares DCT and wavelet transform based image compression algorithms. It finds that wavelet transforms provide better compression ratios and lower mean square errors than DCT. As the level of the wavelet transform increases, the compression ratio increases while the mean square error initially decreases for wavelet levels 1-3. While DCT has faster encoding, it produces blocking artifacts, whereas wavelet transforms maintain good visual quality at higher compression ratios by considering correlations across blocks. Overall, the study shows that wavelet transforms enable higher compression with better visual quality than DCT.
The document presents a procedure for quantifying the roughness of diamond samples at the nanoscale. It involves calculating the ratio of the total surface area of the sample to its base area using 3D calculus. The procedure approximates the surface area formula and provides 11 steps to determine roughness factor from the data. It was tested on 3 samples and produced roughness factors of 26.17, 29.98, and 5.71 respectively. The goal was to create an easy-to-use method for the Materials Research Team to evaluate nano-scale coatings.
A New Method Based on MDA to Enhance the Face Recognition PerformanceCSCJournals
A novel tensor based method is prepared to solve the supervised dimensionality reduction problem. In this paper a multilinear principal component analysis(MPCA) is utilized to reduce the tensor object dimension then a multilinear discriminant analysis(MDA), is applied to find the best subspaces. Because the number of possible subspace dimensions for any kind of tensor objects is extremely high, so testing all of them for finding the best one is not feasible. So this paper also presented a method to solve that problem, The main criterion of algorithm is not similar to Sequential mode truncation(SMT) and full projection is used to initialize the iterative solution and find the best dimension for MDA. This paper is saving the extra times that we should spend to find the best dimension. So the execution time will be decreasing so much. It should be noted that both of the algorithms work with tensor objects with the same order so the structure of the objects has been never broken. Therefore the performance of this method is getting better. The advantage of these algorithms is avoiding the curse of dimensionality and having a better performance in the cases with small sample sizes. Finally, some experiments on ORL and CMPU-PIE databases is provided.
Implementation Of Geometrical Nonlinearity in FEASTSMTiosrjce
Analysis of the structures used in aerospace applications is done using finite element
method. These structures may face unexpected loads because of variable environmental situations.
These loads could lead to large deformation and inelastic manner. The aim of this research is to
formulate the finite elements considering the effect of large deformation and strain. Here total
Lagrangian method is used to consider the effect of large deformation. After deriving required
relations, implementation of formulated equation is done in FEASTSMT(Finite Element Analysis of
Structures - Substructured and Multi-Threading). .Newton-Raphson method was utilized to solve
nonlinear finite element equations. The validation is carried out with the results obtained from the
Marc Software.
The document describes the implementation of geometrical nonlinearity in finite element analysis software FEASTSMT. It discusses total Lagrangian formulation and the Newton-Raphson method to solve nonlinear finite element equations arising from large deformations. Element formulations accounting for incremental strains, strain-displacement relationships, and stresses are developed. The implementation is validated on a solid element and beam bending problem by comparing results with MARC software and analytical solutions, showing good agreement.
This paper presents an approach for image restoration in the presence of blur and noise. The image is divided into independent regions modeled with a Gaussian prior. Wavelet-based methods are used for image denoising, while classical Wiener filtering is used for deblurring. The algorithm finds the maximum a posteriori estimate at the intersection of convex sets generated by Wiener filtering. It provides efficient image restoration without sacrificing the simplicity of filtering, and generates a better restored image compared to previous methods.
This paper presents an approach for image restoration in the presence of blur and noise. The image is divided into independent regions modeled with a Gaussian prior. Wavelet based methods are used for image denoising, while classical Wiener filtering is used for deblurring. The algorithm finds the maximum a posteriori estimate at the intersection of convex sets generated by Wiener filtering. It provides efficient image restoration without sacrificing the simplicity of filtering, and generates a better restored image.
The document provides an introduction to the Finite Element Method (FEM). It discusses the history and development of FEM from the 1950s to the present. It outlines the basic concepts of FEM including discretization of the domain into finite elements connected at nodes, and the approximation of displacements within each element. The document also discusses minimum potential energy theory, which is the variational principle that FEM is based on. Example problems and a tutorial are mentioned. Advantages of FEM include its ability to model complex geometries and loading, while disadvantages include increased computational time and memory requirements compared to other methods.
1. The document describes a study that used finite element analysis to simulate the burst pressure of a vibration welded plastic vessel and determine the yield stress at the weld bead.
2. An experimental hydrostatic pressure test showed rupture occurred at the weld bead, so the goal was to model this and obtain the stress at the weld bead.
3. Various meshing techniques were tested in the FEA software ABAQUS to find the best correlation with experimental data, including different element types, sizes, and modeling of the weld bead. The results showed second order elements with two layers of dragged elements for the weld bead membrane provided the most accurate stresses at the weld bead.
Similar to Linear Dynamics and Non-Linear Finite Element Analysis using ANSYS Workbench (20)
Discover the latest insights on Data Driven Maintenance with our comprehensive webinar presentation. Learn about traditional maintenance challenges, the right approach to utilizing data, and the benefits of adopting a Data Driven Maintenance strategy. Explore real-world examples, industry best practices, and innovative solutions like FMECA and the D3M model. This presentation, led by expert Jules Oudmans, is essential for asset owners looking to optimize their maintenance processes and leverage digital technologies for improved efficiency and performance. Download now to stay ahead in the evolving maintenance landscape.
Rainfall intensity duration frequency curve statistical analysis and modeling...bijceesjournal
Using data from 41 years in Patna’ India’ the study’s goal is to analyze the trends of how often it rains on a weekly, seasonal, and annual basis (1981−2020). First, utilizing the intensity-duration-frequency (IDF) curve and the relationship by statistically analyzing rainfall’ the historical rainfall data set for Patna’ India’ during a 41 year period (1981−2020), was evaluated for its quality. Changes in the hydrologic cycle as a result of increased greenhouse gas emissions are expected to induce variations in the intensity, length, and frequency of precipitation events. One strategy to lessen vulnerability is to quantify probable changes and adapt to them. Techniques such as log-normal, normal, and Gumbel are used (EV-I). Distributions were created with durations of 1, 2, 3, 6, and 24 h and return times of 2, 5, 10, 25, and 100 years. There were also mathematical correlations discovered between rainfall and recurrence interval.
Findings: Based on findings, the Gumbel approach produced the highest intensity values, whereas the other approaches produced values that were close to each other. The data indicates that 461.9 mm of rain fell during the monsoon season’s 301st week. However, it was found that the 29th week had the greatest average rainfall, 92.6 mm. With 952.6 mm on average, the monsoon season saw the highest rainfall. Calculations revealed that the yearly rainfall averaged 1171.1 mm. Using Weibull’s method, the study was subsequently expanded to examine rainfall distribution at different recurrence intervals of 2, 5, 10, and 25 years. Rainfall and recurrence interval mathematical correlations were also developed. Further regression analysis revealed that short wave irrigation, wind direction, wind speed, pressure, relative humidity, and temperature all had a substantial influence on rainfall.
Originality and value: The results of the rainfall IDF curves can provide useful information to policymakers in making appropriate decisions in managing and minimizing floods in the study area.
Electric vehicle and photovoltaic advanced roles in enhancing the financial p...IJECEIAES
Climate change's impact on the planet forced the United Nations and governments to promote green energies and electric transportation. The deployments of photovoltaic (PV) and electric vehicle (EV) systems gained stronger momentum due to their numerous advantages over fossil fuel types. The advantages go beyond sustainability to reach financial support and stability. The work in this paper introduces the hybrid system between PV and EV to support industrial and commercial plants. This paper covers the theoretical framework of the proposed hybrid system including the required equation to complete the cost analysis when PV and EV are present. In addition, the proposed design diagram which sets the priorities and requirements of the system is presented. The proposed approach allows setup to advance their power stability, especially during power outages. The presented information supports researchers and plant owners to complete the necessary analysis while promoting the deployment of clean energy. The result of a case study that represents a dairy milk farmer supports the theoretical works and highlights its advanced benefits to existing plants. The short return on investment of the proposed approach supports the paper's novelty approach for the sustainable electrical system. In addition, the proposed system allows for an isolated power setup without the need for a transmission line which enhances the safety of the electrical network
Applications of artificial Intelligence in Mechanical Engineering.pdfAtif Razi
Historically, mechanical engineering has relied heavily on human expertise and empirical methods to solve complex problems. With the introduction of computer-aided design (CAD) and finite element analysis (FEA), the field took its first steps towards digitization. These tools allowed engineers to simulate and analyze mechanical systems with greater accuracy and efficiency. However, the sheer volume of data generated by modern engineering systems and the increasing complexity of these systems have necessitated more advanced analytical tools, paving the way for AI.
AI offers the capability to process vast amounts of data, identify patterns, and make predictions with a level of speed and accuracy unattainable by traditional methods. This has profound implications for mechanical engineering, enabling more efficient design processes, predictive maintenance strategies, and optimized manufacturing operations. AI-driven tools can learn from historical data, adapt to new information, and continuously improve their performance, making them invaluable in tackling the multifaceted challenges of modern mechanical engineering.
Software Engineering and Project Management - Introduction, Modeling Concepts...Prakhyath Rai
Introduction, Modeling Concepts and Class Modeling: What is Object orientation? What is OO development? OO Themes; Evidence for usefulness of OO development; OO modeling history. Modeling
as Design technique: Modeling, abstraction, The Three models. Class Modeling: Object and Class Concept, Link and associations concepts, Generalization and Inheritance, A sample class model, Navigation of class models, and UML diagrams
Building the Analysis Models: Requirement Analysis, Analysis Model Approaches, Data modeling Concepts, Object Oriented Analysis, Scenario-Based Modeling, Flow-Oriented Modeling, class Based Modeling, Creating a Behavioral Model.
Comparative analysis between traditional aquaponics and reconstructed aquapon...bijceesjournal
The aquaponic system of planting is a method that does not require soil usage. It is a method that only needs water, fish, lava rocks (a substitute for soil), and plants. Aquaponic systems are sustainable and environmentally friendly. Its use not only helps to plant in small spaces but also helps reduce artificial chemical use and minimizes excess water use, as aquaponics consumes 90% less water than soil-based gardening. The study applied a descriptive and experimental design to assess and compare conventional and reconstructed aquaponic methods for reproducing tomatoes. The researchers created an observation checklist to determine the significant factors of the study. The study aims to determine the significant difference between traditional aquaponics and reconstructed aquaponics systems propagating tomatoes in terms of height, weight, girth, and number of fruits. The reconstructed aquaponics system’s higher growth yield results in a much more nourished crop than the traditional aquaponics system. It is superior in its number of fruits, height, weight, and girth measurement. Moreover, the reconstructed aquaponics system is proven to eliminate all the hindrances present in the traditional aquaponics system, which are overcrowding of fish, algae growth, pest problems, contaminated water, and dead fish.
Null Bangalore | Pentesters Approach to AWS IAMDivyanshu
#Abstract:
- Learn more about the real-world methods for auditing AWS IAM (Identity and Access Management) as a pentester. So let us proceed with a brief discussion of IAM as well as some typical misconfigurations and their potential exploits in order to reinforce the understanding of IAM security best practices.
- Gain actionable insights into AWS IAM policies and roles, using hands on approach.
#Prerequisites:
- Basic understanding of AWS services and architecture
- Familiarity with cloud security concepts
- Experience using the AWS Management Console or AWS CLI.
- For hands on lab create account on [killercoda.com](https://killercoda.com/cloudsecurity-scenario/)
# Scenario Covered:
- Basics of IAM in AWS
- Implementing IAM Policies with Least Privilege to Manage S3 Bucket
- Objective: Create an S3 bucket with least privilege IAM policy and validate access.
- Steps:
- Create S3 bucket.
- Attach least privilege policy to IAM user.
- Validate access.
- Exploiting IAM PassRole Misconfiguration
-Allows a user to pass a specific IAM role to an AWS service (ec2), typically used for service access delegation. Then exploit PassRole Misconfiguration granting unauthorized access to sensitive resources.
- Objective: Demonstrate how a PassRole misconfiguration can grant unauthorized access.
- Steps:
- Allow user to pass IAM role to EC2.
- Exploit misconfiguration for unauthorized access.
- Access sensitive resources.
- Exploiting IAM AssumeRole Misconfiguration with Overly Permissive Role
- An overly permissive IAM role configuration can lead to privilege escalation by creating a role with administrative privileges and allow a user to assume this role.
- Objective: Show how overly permissive IAM roles can lead to privilege escalation.
- Steps:
- Create role with administrative privileges.
- Allow user to assume the role.
- Perform administrative actions.
- Differentiation between PassRole vs AssumeRole
Try at [killercoda.com](https://killercoda.com/cloudsecurity-scenario/)
artificial intelligence and data science contents.pptxGauravCar
What is artificial intelligence? Artificial intelligence is the ability of a computer or computer-controlled robot to perform tasks that are commonly associated with the intellectual processes characteristic of humans, such as the ability to reason.
› ...
Artificial intelligence (AI) | Definitio
Linear Dynamics and Non-Linear Finite Element Analysis using ANSYS Workbench
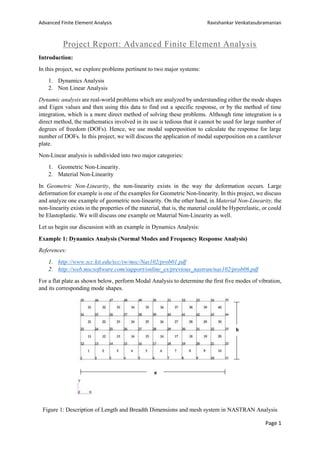
1. Advanced Finite Element Analysis Ravishankar Venkatasubramanian
Page 1
Project Report: Advanced Finite Element Analysis
Introduction:
In this project, we explore problems pertinent to two major systems:
1. Dynamics Analysis
2. Non Linear Analysis
Dynamic analysis are real-world problems which are analyzed by understanding either the mode shapes
and Eigen values and then using this data to find out a specific response, or by the method of time
integration, which is a more direct method of solving these problems. Although time integration is a
direct method, the mathematics involved in its use is tedious that it cannot be used for large number of
degrees of freedom (DOFs). Hence, we use modal superposition to calculate the response for large
number of DOFs. In this project, we will discuss the application of modal superposition on a cantilever
plate.
Non-Linear analysis is subdivided into two major categories:
1. Geometric Non-Linearity.
2. Material Non-Linearity
In Geometric Non-Linearity, the non-linearity exists in the way the deformation occurs. Large
deformation for example is one of the examples for Geometric Non-linearity. In this project, we discuss
and analyze one example of geometric non-linearity. On the other hand, in Material Non-Linearity, the
non-linearity exists in the properties of the material, that is, the material could be Hyperelastic, or could
be Elastoplastic. We will discuss one example on Material Non-Linearity as well.
Let us begin our discussion with an example in Dynamics Analysis:
Example 1: Dynamics Analysis (Normal Modes and Frequency Response Analysis)
References:
1. http://www.scc.kit.edu/scc/sw/msc/Nas102/prob01.pdf
2. http://web.mscsoftware.com/support/online_ex/previous_nastran/nas102/prob06.pdf
For a flat plate as shown below, perform Modal Analysis to determine the first five modes of vibration,
and its corresponding mode shapes.
Figure 1: Description of Length and Breadth Dimensions and mesh system in NASTRAN Analysis
2. Advanced Finite Element Analysis Ravishankar Venkatasubramanian
Page 2
Figure 2: Material Properties
The system is excited by a 0.1 psi pressure load over the total surface of the plate and a 1.0 lb. force at
a corner of the tip lagging 45°. Use a modal damping of ξ = 0.03. Use a frequency step of 20 Hz between
a range of 20Hz and 1000 Hz. Perform Modal Frequency Response analysis for the mentioned loads
and boundary conditions:
Figure 3: Boundary Conditions and Load
Solution:
We use ANSYS Workbench 17.0 for the analysis and simulation. The solution was first attempted using
3D- Hexahedral elements. The initial analysis to be done was Modal Analysis. A fixed support boundary
condition is applied to the system, as shown in Figure 4.
3. Advanced Finite Element Analysis Ravishankar Venkatasubramanian
Page 3
Figure 4: Boundary Condition for Eigen Value Analysis
After the boundary conditions are applied, the number of modes to be found are written in the Analysis
settings tab, as shown in Figure 5:
Figure 5: Analysis Settings – Modal Analysis
After this step, Eigen value analysis is run to find out the Mode shapes (Eigen vectors) and Eigen Values
(Natural Frequency), as shown in Figure 6 and Figure 7.
Figure 6: Natural Frequency for each mode
4. Advanced Finite Element Analysis Ravishankar Venkatasubramanian
Page 4
Figure 7: Mode Shape 1 for a Natural Frequency of 131.79 Hz.
These answers of fundamental frequencies from Figure 6 match closely with the answers obtained in
the NASTRAN Example problem (from reference), as shown in Figure 8 (Natural Frequency circled in
blue):
Figure 8: Eigen Values and Natural Frequencies from NASTRAN Example Problem.
Varying the mesh density and the type of element (From Hexahedral to Tetrahedral) gives tiny change
in Modal Frequency, which is not highly significant.
Using these Eigen Values, we now move on to Frequency Response Analysis. In frequency response
analysis, we use the Eigen values to find out Frequency response as a function of these mode shapes
and modal frequencies. This method saves a lot of time compared to the direct method. Figure 9
provides the geometry, and the requisite boundary conditions applied.
5. Advanced Finite Element Analysis Ravishankar Venkatasubramanian
Page 5
Figure 9: Boundary Conditions on the Model
Initially, hexahedral elements are used for the analysis, and the mesh density is at its coarsest. This
analysis is run with the mentioned damping ratio and the frequency range, with mentioned steps in
frequency is taken, as shown in Figure 10.
Figure 10: Analysis Settings
6. Advanced Finite Element Analysis Ravishankar Venkatasubramanian
Page 6
With the mentioned Analysis settings, the Frequency Response Analysis (FRA) was run. The FRA
peaks are shown in Figure 11:
Figure 11: FRA peaks for Hexahedral Elements
The FRA peaks show that the displacement amplitude is highest near the resonance frequencies between
10Hz- 1000Hz. This is expected for the question as instability generally exists near the resonant
frequencies. The value of displacement can be further refined by using a finer mesh. Testing has also
been done using Tetrahedral mesh, and the displacement has been found to be close to the answer
mentioned in the NASTRAN Manual (Figure 12) for fine Hexahedral mesh. Hexahedral elements have
more nodes, and hence can handle bending better than Tetrahedral elements. A finer mesh provides
closer interpolation values, and more accurate results.
Figure 12: PATRAN Results from Reference for FRA
7. Advanced Finite Element Analysis Ravishankar Venkatasubramanian
Page 7
FRA analysis for higher number of solution intervals, i.e., higher number of frequencies between 20Hz-
1000Hz provides a smoother curve with higher accuracy of results. But these results cannot be
compared with the results from Figure 12, which is based on a solution interval of 49.
For Tetrahedral elements, the FRA provides a higher displacement, since the tetrahedral elements
cannot handle bending and oscillatory movements as effectively as Hexahedral elements, there is a
slightly higher displacement, as shown in Figure 13.
Figure 13: FRA peaks for Tetrahedral Elements
The system is a plate system, and cannot be modeled as a 1D system, and hence, we restrict its modeling.
With increase in mesh density, there is an increase in accuracy. Hence, the most accurate mesh to use
in this case is a Fine-Hexahedral mesh.
Example 2: (Large Deformation; Geometric Non-Linearity)
Reference: http://support.midasnfx.com/files/NAFEMS-PDF/Z-shaped%20cantilever.pdf
Figure 14 shows a Z-shaped cantilever laid along the oblique line of 45˚. The total load P at all the
points on the free end D in the positive Z-direction is conservative (non-follower load). The material
properties are also given.
Figure 14: Z- Shaped Cantilever
8. Advanced Finite Element Analysis Ravishankar Venkatasubramanian
Page 8
Solution:
This system is designed on ANSYS Workbench 17.0 using the Design Modeler. The model was initially
modeled as a 3D system, and later modeled as a 2D system and a 1D system. We will discuss about the
results of each system in detail.
Figure 15: Hexahedral Coarse Mesh
Figure 16 shows details of the boundary conditions. The fixed support boundary condition and Force is
applied in a ramped fashion, over a period of time.
Figure 16: Boundary Conditions on the Z-Shaped Cantilever
9. Advanced Finite Element Analysis Ravishankar Venkatasubramanian
Page 9
Figure 17: Application of Ramped Force
Ramped force is essential to make sure that the system does not collapse due to sudden application of
forces up to 4000N.
Figure 18: Analysis Settings
The number of steps is set to 100 to obtain an accurate non-linear solution. The other controls are set to
program controlled as the question does not mention any other specific changes to make to the system.
The final deformation, at Load = 4000N is shown in Figure 19:
10. Advanced Finite Element Analysis Ravishankar Venkatasubramanian
Page 10
Figure 19: Directional Deformation of the system at 4000N Load
A graph is drawn with displacement in the X-Axis and Load in the Y-axis, to get an idea about how the
system deforms with increasing force. The displacement rapidly increases with load for the first 500N.
After this force, the deformation has reached around 100mm, where the mid-section of the Z-shaped
cantilever causes ‘tension stiffening’, as shown in Figure 20. This tension stiffening continues all the
way upto the load of 4000N, and it can be see that there is very less displacement (43mm) over a large
amount of force (3500N). This can be attributed solely to the stiffening in the mid-section of the Z
shaped cantilever. Please note that the deformation shown in Figure 19 is only for the tip of the
cantilever.
Figure 20: Tip Displacement vs Load (Z Shaped Cantilever)
This graph is compared with the graph obtained from the Midas-NFX reference, shown in Figure 20.
0
500
1000
1500
2000
2500
3000
3500
4000
4500
0 20 40 60 80 100 120 140 160
Load(N)
Tip Displacement (mm)
Tip Displacement vs Load
11. Advanced Finite Element Analysis Ravishankar Venkatasubramanian
Page 11
Figure 21: Tip Displacement vs Displacement (Midas-NFX)
Comparing both Figure 20 and Figure 21, we can conclude that the graphs are almost the same.
Increasing the mesh density in both 3D and 1D has not provided a significant increase in the accuracy
of the system. This is probably because the system is well equipped to handle bending as such, and the
slow increase in displacement due to tension stiffening has provided sufficient iterations to weed out
any numerical errors, which might creep in the analysis. The 3D Hexahedral elements can handle
bending effectively, and hence, provide accurate results. Figure 22, 23 show pictures of the final
deformation in both 2D and 1D systems.
Figure 22: Tip Deformation – Quadrilateral Shell Elements
12. Advanced Finite Element Analysis Ravishankar Venkatasubramanian
Page 12
Figure 23: Tip Deformation – 1D Beam Elements
As seen from Figure 22, 1D beam elements can handle bending effectively, and hence, the deformation
at the tip matches with 3D Tetrahedral/Hexahedral elements. 2D triangular and Quadrilateral elements
on the other hand, cannot handle bending as effectively as beam elements, and provide slightly more
deformation. This is seen in Figure 21. There is no significant change in tip displacement with mesh
density, and hence, that has not been discussed in detail. For further information, the attached input files
provide 3 different mesh densities, along with all element types (3D, 2D and 1D).
The solution has been compared with the reference Midas-NFX, and has been found to match with the
prescribed result.
Example 3: (Material Non-Linearity: Elasto-Plastic Material)
Reference: http://www.scc.kit.edu/scc/sw/msc/Nas103/Workshop_6.pdf
Figure 24: Diagram of Problem
L=50, W=10, T=0.1.
The material used in this system has the following properties:
Young’s Modulus = 3.0E+6, Poisson’s Ratio = 0.25, Tangent Modulus = 30303, Yield Stress = 850.
13. Advanced Finite Element Analysis Ravishankar Venkatasubramanian
Page 13
Find the Elastic and Plastic Strain at the end of the loading. The loading cycle is:
1. Load P=800
2. Load P= 1000
3. Unload P= 950
4. Unload P=0
Solution:
The modeling can be done by using a quarter of the model (symmetry), and it will yield the same result
with a lesser time duration involved. But for this problem, we use a system which has the entire bar.
Figure 25 shows the meshed bar, with a coarse hexahedral mesh.
Figure 25: Meshed Part – Hexahedral Mesh
We expect, from the loading pattern that the material yields between 1 and 2 seconds, since the Yield
stress is 850. After yielding, the material will maintain its plastic nature, even if it unloads, as done in
t=3 and t=4. The loading history is shown in Figure 26 (This is because the stress is
F/A=Load/(10*0.1)=> Stress = Load).
Figure 26: Load curve with time
14. Advanced Finite Element Analysis Ravishankar Venkatasubramanian
Page 14
The boundary conditions applied on the system are shown in Figure 27.
Figure 27: Application of Boundary Conditions
The analysis is run, and the requested outputs are equivalent plastic strain, the total strain in the body
and the equivalent von-mises stress. The analysis is run under these conditions. Applying a fixed
boundary condition on one end provides a system which is constrained, and the simulation can proceed
as expected. The system is the same as the one where the tensile load is applied to both ends.
The equivalent plastic strain is shown in Figure 28:
Figure 28: Equivalent Plastic Strain in the system at t=4s (Final)
The system shows an equivalent plastic strain of 5.73mm, which is the same as plastic strain obtained
when the load is 1000.
15. Advanced Finite Element Analysis Ravishankar Venkatasubramanian
Page 15
The graph between time and equivalent plastic strain is:
Figure 29: Plastic Strain vs Time
The plastic strain remains constant in unloading, as expected, as all the elastic strain is dissipated in
unloading.
The graph between time and Equivalent total strain is:
Figure 30: Total Strain vs Time
The total strain reduces over time in the unloading process as the elastic strain is dissipated over time
during the unloading procedure. Now, we can draw a graph between the equivalent stress and plastic
strain.
Figure 31: Plastic Strain and Equivalent Stress
0
200
400
600
800
1000
1200
-0.001 0 0.001 0.002 0.003 0.004 0.005 0.006 0.007
Plastic Strain vs Equivalent Stress
16. Advanced Finite Element Analysis Ravishankar Venkatasubramanian
Page 16
This graph can now be compared with Figure 32, which is the graph between Plastic Strain and
Equivalent stress in the reference:
Figure 32: Plastic Strain vs Stress (Reference Material)
As seen in this system, we can say that the solution is an almost perfect match. Increasing the mesh
density provides more accuracy in the system, but changing the element type from 3D to 2D will not
cause much improvement in results. This is because Hexahedral or any element in the 3D domain can
handle stretching efficiently. Hence, this system can be meshed with any element, 3D, 2D or 1D to get
effective results.