Downloaded 16 times


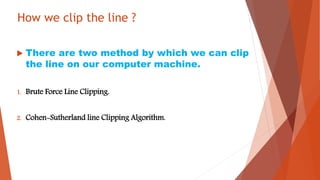


![Line in the window:-Lines completely contained within the window
boundaries have region code [0000] for both end-points so are not clipped.
Line out of window:-Any lines with a common
set bit in the region codes of both end-points
can be clipped
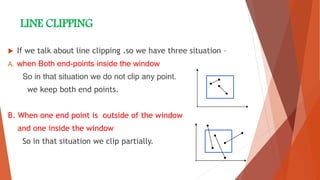
when Lines In The Window and out of the window
wymax
wymin
wxmin wxmax
Window
P3 [0001]
P6 [0000]
P5 [0000]
P7 [0001]
P10 [0100]
P9 [0000]
P4 [1000]
P8 [0010]
P12 [0010]
P11 [1010]
P13 [0101] P14 [0110]
wymax
wymin
wxmin wxmax
Window
P3 [0001]
P6 [0000]
P5 [0000]
P7 [0001]
P10 [0100]
P9 [0000]
P4 [1000]
P8 [0010]
P12 [0010]
P11 [1010]
P13 [0101] P14 [0110]](https://image.slidesharecdn.com/cgppt-170525102257/85/line-clipping-12-320.jpg)


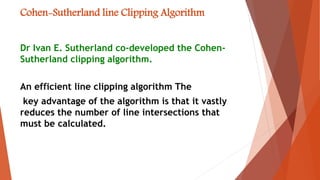
![Some examples
Consider the line P9 to P10 below
Start at P10
From the region codes of the two end-points we
know the line doesn’t cross the left or right
boundary
Calculate the intersection of the line with
the bottom boundary to generate point P10’
The line P9 to P10’ is completely inside
the window so is retained
wymax
wymin
wxmin wxmax
Window
P10 [0100]
P9 [0000]
P10’ [0000]
P9 [0000]](https://image.slidesharecdn.com/cgppt-170525102257/85/line-clipping-15-320.jpg)
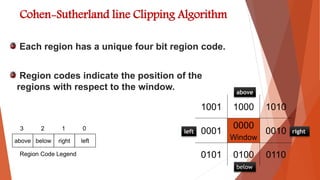
![Consider the line P3 to P4 below
Start at P4
From the region codes of the two end-points we know the line
crosses the left boundary so calculate the intersection point
to generate P4’
The line P3 to P4’ is completely outside the window so is clipped
wymax
wymin
wxmin wxmax
Window
P4’ [1001]
P3 [0001]
P4 [1000]
P3 [0001]](https://image.slidesharecdn.com/cgppt-170525102257/85/line-clipping-16-320.jpg)
![Consider the line P7 to P8 below
Start at P7
From the two region codes of the two end-points we know
the line crosses the left boundary so
calculate the intersection point to
generate P7’
wymax
wymin
wxmin wxmax
Window
P7’ [0000]
P7 [0001] P8 [0010]
P8’ [0000]](https://image.slidesharecdn.com/cgppt-170525102257/85/line-clipping-17-320.jpg)


This document summarizes line clipping techniques in computer graphics. It discusses point clipping, line clipping, and area clipping. For line clipping, it describes the three situations of both endpoints inside the window, one endpoint inside and one outside, and both outside. It then explains the brute force and Cohen-Sutherland algorithms for line clipping. The Cohen-Sutherland algorithm uses region codes to efficiently determine which lines are fully inside, fully outside, or need clipping against window boundaries. It provides examples of applying the algorithm to different line scenarios. Finally, it compares the brute force and Cohen-Sutherland methods, noting Cohen-Sutherland is faster but more complex.