
Recommended
More Related Content
Similar to Non-Parametric Survival Models
Similar to Non-Parametric Survival Models (20)
More from MangaiK4
More from MangaiK4 (20)
Recently uploaded
Recently uploaded (20)
Non-Parametric Survival Models
- 1. Integrated Intelligent Research (IIR) International Journal of Computing Algorithm Volume: 03 Issue: 03 December 2014 Pages: 232-235 ISSN: 2278-2397 232 Non-Parametric Survival Models H.Alexis Selvaraj1 , G.Stephen Vincent2 1 Assistant Professor of Statistics,Periyar E.V.R College,Tiruchirappalli 2 Associate Professor of Statistics(Rtd.),St.Joseph’s College(Autonomous), Tiruchirappalli Abstract - Statistical models include issues such as statistical characterization of numerical data, estimating the probabilistic future behaviour of a system based on past behaviour, extrapolation or interpolation of data based on some best-fit, error estimates of observations or model generated output. If the statistical model is used to analyse the survival data it is known as statistical model in survival analysis. There are different statistical data. Censored data is one of its kinds. Censoring means the actual survival time is unknown. Censoring may occur when a person does not experience the event before the study ends or lost to follow-up during the study period or withdraws from the study. For this type of censored data the suitable model is survival models. Survival models are classified as non-parametric, semi-parametric and parametric models. The survival probability can be obtained using these models. Using the health data of cancer registry in Tiruchirappalli, Tamil Nadu , a study on survival pattern of cancer patients was explored, the non-parametric modelling that is Kaplan-Meier method was used to estimate the survival probability and the comparison of survival probability of obtained by life table and Kaplan Meier methods for each stage of the disease were made. Log rank test has been used for the comparison between the estimates obtained at the different stages of the disease. Keywords- censored data ,survival models, survival probability, Kaplan_Meier estimate. I. INTRODUCTION Study of diagnosis of cancer is considered as a human tragedy. But for the concern over the society, cancer is one of the major chronic diseases which affect the human population a lot. There are different statistical analysis are used to the study of cancer survival data. The initial step in the analysis of a set of survival data is to present numerical or graphical summaries of the survival times for individuals in a particular group (Collett,1994). Perhaps the most vital issue in the analysis of any clinical material is the integrity of the data, within which we include the quality, completeness and relevance of the information collected (Dambrosia and Ellenberg,1980). To determine the Kaplan Meier estimate of the survivor function from a sample of censored survival data, a series of time intervals has been formed, as in the life table estimate. However, each of these intervals is to be constructed that one death time is contained in the interval, and this death time is taken to occur at the start of the interval (Collett, 1994). The main objective of this study is to compare the survival probability by non-parametric survival models. II. MATERIALS AND METHODS The relevant lifetime data on the patients of breast cancer is obtained from one of the reputed hospital in Tiruchirappalli, Tamil Nadu from 1st January2009 to 31st December 2009. Among the 523 diagnosed during this period, 478 have completed the treatment and fulfilled the inclusion criteria. The remaining 45 patients have been excluded either because of they moved to other hospitals or who haven’t completed the treatment were excluded from the present study. III. ASSUMPTION AND NOTATIONS For this present study the generalized type I censoring was used. The censoring was due to the following reasons: (i) A patient emigrated out of the study area was impossible to follow. (ii)An individual survived past the end of the study period. (iii)The censoring was no-informative. For this representation of the data considered in this study, each individual had its own specific lifetime, which was rescaled at starting time to t0=0 (Klein and Moeschberger,1997). T was taken as a non-negative random variable, the time until the event of interest (death) due to cancer occurred. The time interval is denoted by i , Di denotes the number of deaths during i and Wi stands for the number of censored observations during i. A. Non-Parametric Survival methods The survival probabilities can be calculated using the four methods of non-parametric survival methods. (i) Minimum Survival Probability(MISP). (ii) Maximum Survival Probability(MASP). (iii) Life Table Method and (iv) Kaplan Merier Method. In Minimum Survival Probability method, the survival probabilities are calculated by assuming that in all those who are censored, the outcome of interest has occurred. Then MISP for the time interval i is given by MISP = 1 – (Di +Wi)/N Where Di denotes the number of deaths during i, Wi denotes the number of censored observations and Ni denotes the number of subjects at the beginning of i.In Maximum Survival Probability method, the survival probabilities are calculated by assuming that all those who are censored at time i are alive till the end of the time interval i. Then MASP for the time interval i is given by MASP = 1-(Di/Ni)The Life Table method involves the construction of a life table, which permits the calculation of the cumulative probability of survival at time ti+1 from the conditional probabilities of survival during consecutive intervals of follow up time up to and including ti+1. For each time period ti to ti+1, ni is the number of subjects at risk of outcome at the beginning of the time interval. The number of cases censored during the interval, because they are lost to follow up is shown as Wj. The symbol di denotes subjects who have experienced the outcome during each interval. The effective number of subjects at risk during each interval is calculated as Nj=nj-(Wj/2)By this way , subjects who are alive and at the risk of experiencing the outcome during the interval
- 2. Integrated Intelligent Research (IIR) International Journal of Computing Algorithm Volume: 03 Issue: 03 December 2014 Pages: 232-235 ISSN: 2278-2397 233 ti to ti+1, but who are censored at some point of time during the interval, are assumed to have been followed up for, on average, half of their interval. As such, the probability of occurrence of the outcome during their interval is given by qi=di/NiThe probability of survival during the interval beginning ti is then calculated as pi=1-qi from which the cumulative probability of survival upto time ti+1 is derived from the product of the pi’s Pi+1= This quantity Pi+1 is often multiplied by 100 to give the “percentage survival” at time ti+1. B. Kaplan-Meier Estimate To determine the Kaplan-Meier estimate of the survivor function from a sample of censored survival data, a series of time intervals has been formed, as in the life-table estimate. However, each of these intervals is to be constructed that one death time is contained in the interval, and this death time is taken to occur at the start of the interval (Collett, 1994).The conditional probabilities of surviving between two events are estimated every time an event occurs. It is a product limit estimate(PLE) in the sense that the cumulative probability of survival is obtained by the product of probabilities calculated for each successive interval. For random sample N, the PLE is obtained by listing the N observed lifetimes, either attained outcome or censored, in an increasing order of magnitude such that, 0<t1<t2<……<tN. The PLE’s are derived using the products of conditional probabilities surviving the interval. P(ti)= Where Pk= 1-1/Rk if outcome occurs at tk = 1 otherwise Rk is the number of individuals alive at tk(Kaplan and Meier, 1958and Swaminathan, 2002)The following table shows the cumulative survival probabilities at the end of each year from the date of completion of treatment through different methods. These estimates are obtained by using MISP, MASP, Life Table and Kaplan-Meier Methods. Table 1 Showing the Number of cases, Deaths and Lost to follow-up for 5 years Outcome Status Year lapsed since of date of completion treatment Ist Year IInd Year IIIrd Year IVth Year Vth Year Number of Cases 478 415 332 297 259 Deaths 36 62 29 19 5 Lost to follow-up 27 21 6 19 6 Table 2 -Cumulative Survival Rates Methods Percentage values Ist Year IInd Year IIIrd Year IVth Year Vth Year MISP 86.6 69.4 62.1 54.2 51.9 MASP 92.5 78.6 77.2 72.3 70.9 Life Table 92.0 78.0 71.0 67.0 65.0 Kaplan Meier 90.6 77.7 71.0 66.3 65.3 In general, by all these methods, estimates of the cumulative probabilities have been decreased as the survival period has increased. The higher probabilities have been estimated by MISP. And the estimates of MISP and MASP provide the two extreme values of the survival band within which the true survival probability lies. Hence the overall five-year survival probability(%) for the cancer patients has been found to be 65%, which is very much similar to other findings(Rouzier et al.2005). However, this overall survival probability may not be an appropriate one, since the stage of the disease at diagnosis is one of the significant factors associated with the number of deaths occurred. Hence the ideal method to calculate separate cumulative probabilities with stage of the disease at diagnosis which is shown in the following table. Table-3 Comparison of Survival Probability Obtained by Life Table and Kaplan Meier Methods for each Stage of the Disease Stage Method Survival Probability(%) Ist Year IInd Year IIIrd Year IVth Year Vth Year I Life Table 96 90 85 82 81 Kaplan Meier 94.5 88.9 85.4 81.8 80.5 II Life Table 94 82 75 71 69 Kaplan Meier 92.2 80.9 75 70.8 69.3 III Life Table 89 65 54 49 47 Kaplan Meier 86.2 64.5 53 49.5 47.5 IV Life Table 40 0 - - - Kaplan Meier 40 0 - - - The estimates obtained by Life Table and Kaplan-Meier methods are almost similar for overall data as well as stage wise data, though not identical. Both these methods aim at estimating the same quantity and both are using the product of conditional survival probabilities for estimation. The slight difference between Kaplan-Meier and Life Table estimates is that the Kaplan-Meier method assumes that all the individuals with censored survival times are at risk at the time of the death(S), whereas the Life Table method assumes that half of these individuals are at risk at the time of the death(s). And another reason is that the Kaplan-Meier method is meant continuous time,(although the Kaplan-Meier estimator is discrete in nature) and the Life Table method for grouped data and the ways the estimates are interpreted. In general, the Life Table method is very much influenced by the choice of the class interval like histogram (Collett, 1994). Hence, the chances of bias are high in Life Table method compared to Kaplan Meier method. C. Standard Error of Kaplan-Meier Estimator The most widely used method for estimating the standard error of the survival proportion is the method described by Greenwood (1926), which is known as Greenwood’s formula. The formula is that, SE{ (t)}= Where S(t) is the survivor function nj is the number of individuals at risk at the start of jth interval. Dj is the number of deaths in the interval j.A common problem arises in the Greenwood’s formula is that in the tails of the distribution of the survival times, that is, when S(t) is close to zero or unity, it can underestimate the actual variance(Collett, 1994). Hence, an alternative expression for standard error
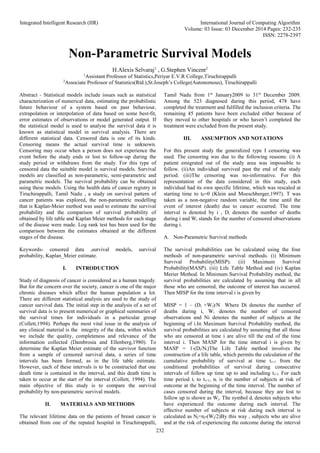
- 3. Integrated Intelligent Research (IIR) International Journal of Computing Algorithm Volume: 03 Issue: 03 December 2014 Pages: 232-235 ISSN: 2278-2397 234 is derived by Peto et al.(1977). The standard error of S(t) can be obtained from the equation SE{ (t)}= for t(k)<t(k+1), k=1,2,.....,r where is the Kaplan-Meier estimate of and nk is the number of individuals at risk at t(k), the start of the kth constructed time interval. The expression of the standard error of is conservative in nature(Collett, 1994). Cantor(2001) has projected the standard error of the Kaplan- Meier estimator for both Greenwood and Peto formulae. The result obtained Cantor indicates that there is little difference from each other in the sample standard errors until, the “right hand tail” of the survival curve. Cantor concludes that the tendency of the Greenwood estimate to underestimate the standard error is not seen upto the tail end, while the conservatism of the Peto estimate appears to be more severe. The Kaplan-Meier survival curve for the overall data is shown in the following Figure(1) with the 95% confidence limits(using standard error of Greenwood). And the Kaplan- Meier estimate for each stage of the disease is shown in Figure(2). Figure(1): Survival Plot with 95% Confidence Limits Figure 2 D. Testing the Equality of Survival Pattern with Every Stage of the Disease Survival in two or more groups of patients can be compared using a non-parametric test. The log rank test(Peto et al.1977) is the most widely used method for comparing two or more survival curves. The groups may be of treatment aims or prognostic groups. This method calculates, at each event time, for each group, the number of events one would expect since the previous event, if there were no difference between the groups. The log rank test compares the observed number of events, say Oi for treatment group i, to the expected number by calculating the test statistic, χ2 = This value is compared to a χ2 distribution with (g-1) degrees of freedom, where g is the number of groups (Clark et al.2003(1)). Probability value may be computed to calculate the statistical significance of the difference between the completed survival curves. Calculation of Oi and Ei for each group could be the basis on which survival may increase or decrease across the groups that indicates the power of the test. For the new Oi and Ei, the test statistic for trend is compared with the χ2 distribution with one degree of freedom (Collett,1994).The stage of the disease at diagnosis, which explains the level of the spread or severity of the disease, is an ordinal variable. Hence, log rank test for trend has been used to compare the survival pattern of each stage. The log rank test for trend provides a significant result showing variations in the survival patterns of each stage of t he disease. Since only 5 patients are in stage IV, they are omitted and log rank test bas been recalculated. Again a significant variation has been obtained. From Figure (3) it is clear that the stage I and stage III survival curves are different. Hence, the pair wise comparison between stages I and II, and stage II and stage III have been done using simple log rank test. Figure(3): Survival Probability by Stage III IV. RESULTS AND DISCUSSION Cancer is an important public health concern throughout the world(Greenlee et al., 2001). The overall estimation of survival probability has been calculated by standard methods of estimation, MASP, MISP, Kaplan-Meier and Life Table Method. The estimations by the Kaplan-Meier and Life Table method are found to be almost similar. However, Kaplan- Meier Method provides an estimate of S(t) for all values of t, although the estimate of S(t)is constant between two event times. It can be concluded that for this data set which is not heavily grouped, such as estimation of survival time to the nearest month, the Kaplan-Meier Method could be considered as superior to the Life Table Method. Finally, log rank test for trend has been used to compare the survival pattern by stages of the disease. The test shows a significant result that as the severity of the disease increases the probability of survival decreases.
- 4. Integrated Intelligent Research (IIR) International Journal of Computing Algorithm Volume: 03 Issue: 03 December 2014 Pages: 232-235 ISSN: 2278-2397 235 REFERENCES [1] Cantor B A (2001): Projecting the Standard Error of the Kaplan-Meier estimator, Statistics in Medicine; 20:2091-2097. [2] Clark T G, Bardburn J J, Love S B and Altman D G(2003(1)): Survival Analysis Part I: Basic Concepts and First Analyses, British Journal of Cancer; 89:232-238. [3] Collett D. (1994): Modelling Survival Data in Medical Research, London: Chapman and Hall/CRC. [4] Dambrosia J M and Ellenberg J H (1980): Statistical Considerations for a Medical Data Base, Biometrics; 36:323-332. [5] Greenlee , R.T., M.B. Hill-Harmon, T.Murray and M. Thun, (2001): Cancer Statistics. Cancer J. Clin., 50:7-33. [6] Greenwood M(1926): The Natural Duration of Cancer, Reports on Public Health and Medical Subjects 33:1-26. [7] Kaplan, E.L and P. Meier( 1958): Non-Parametric estimation from incomplete observations, J.Amer.Stat.Assoc., 53:457-481 [8] Klein J.P and Moeschberger M.L(1997): Survival Analysis: Techniques for censored and truncated data, New York, Springer. [9] Peto R, Pike M.C, Amrmitage P.Breslow N.E, Cox D.R and Howard S.V(1977): Design and Analysis of Randomised Clinical trials requiring prolonged observation of each patients: II analysis and examples, British Journal of Cancer;35:1-39. [10] Rouzier R, Morice P, Decrevoisier, Pomel C, Rey A, Bonnet K (2005): Survival in Cervix Cancer Patients treated with Radiotheraphy Followed by Radical Surgery, EJSO-The Journal of Cancer Surgery; 31: 424-433.