Downloaded 12 times
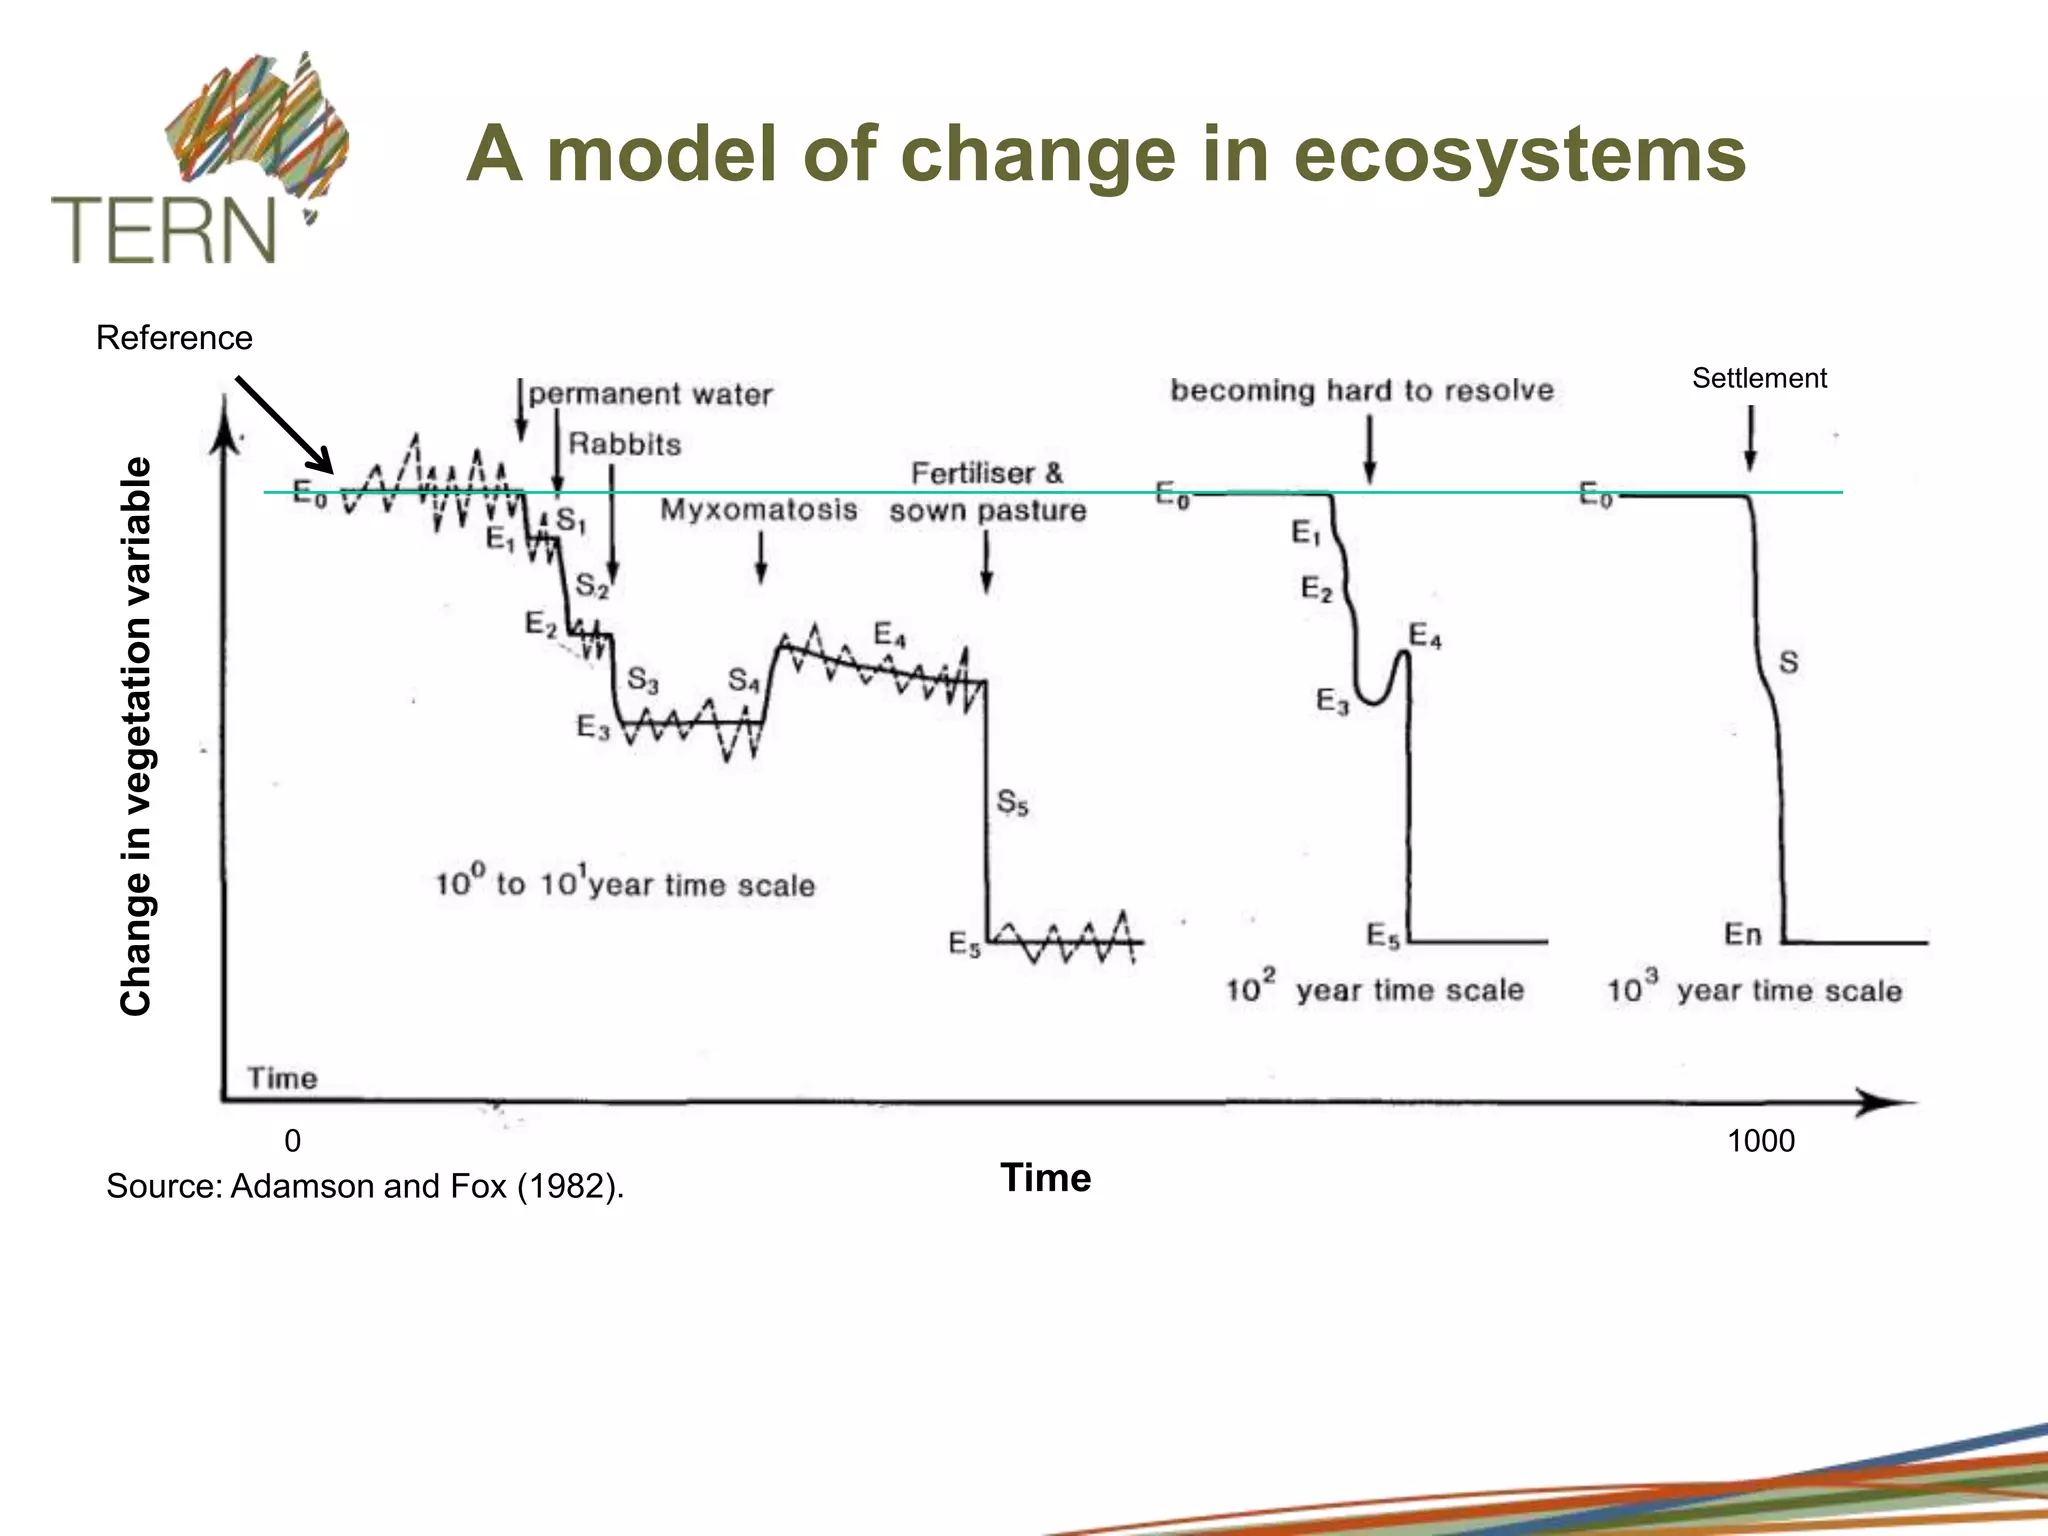
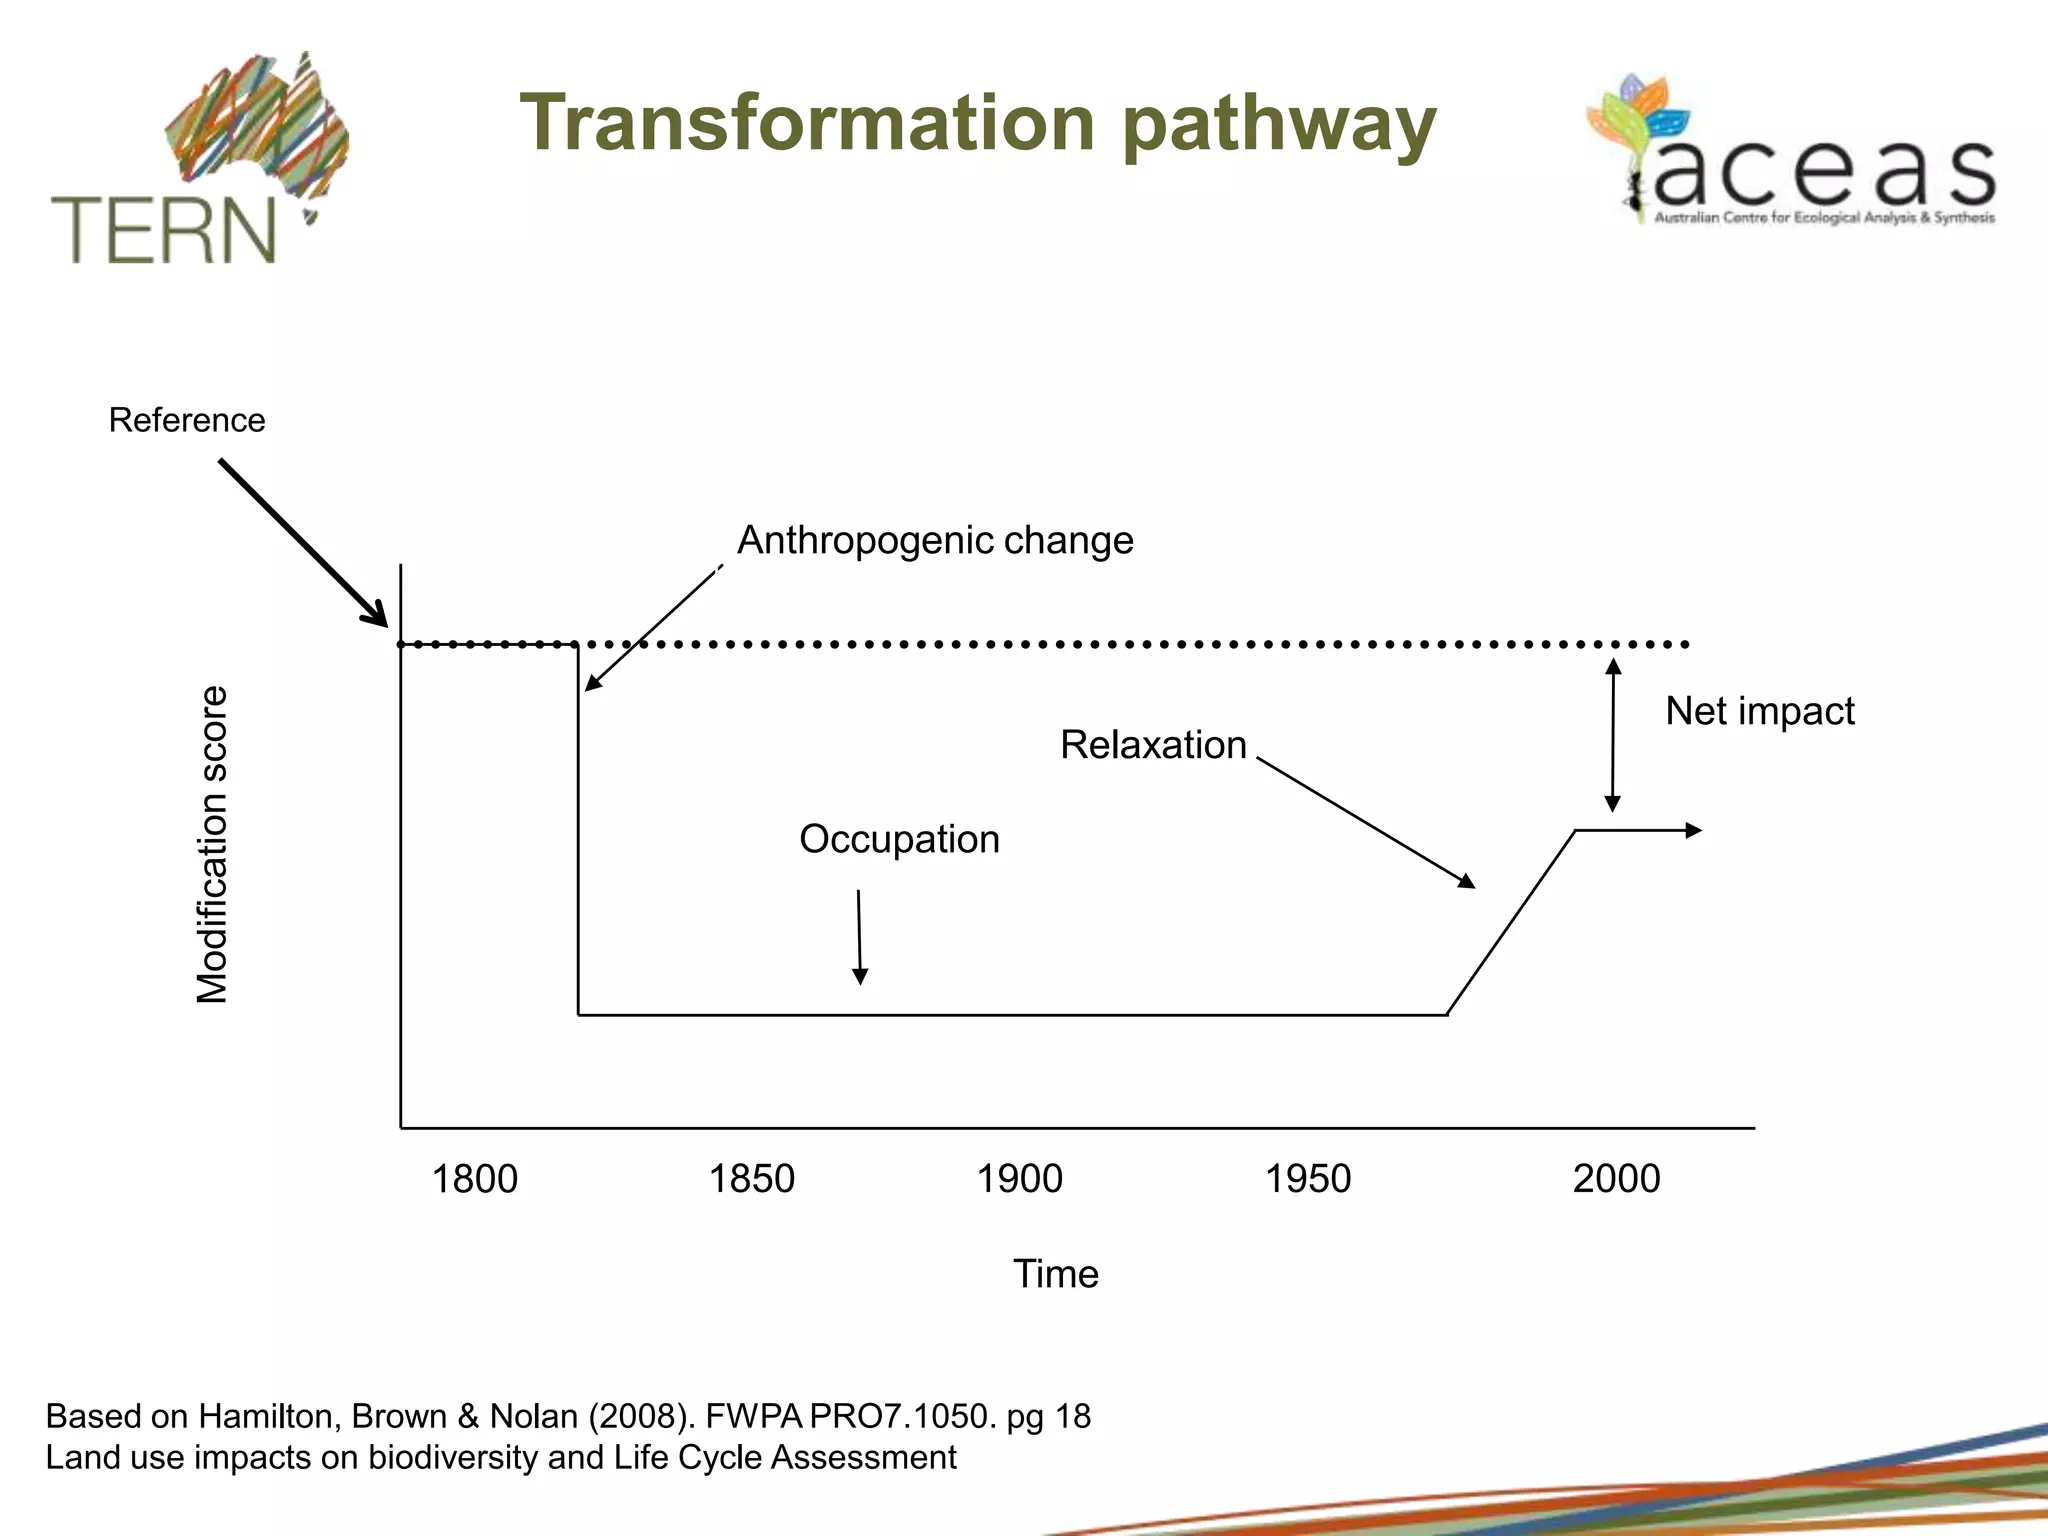
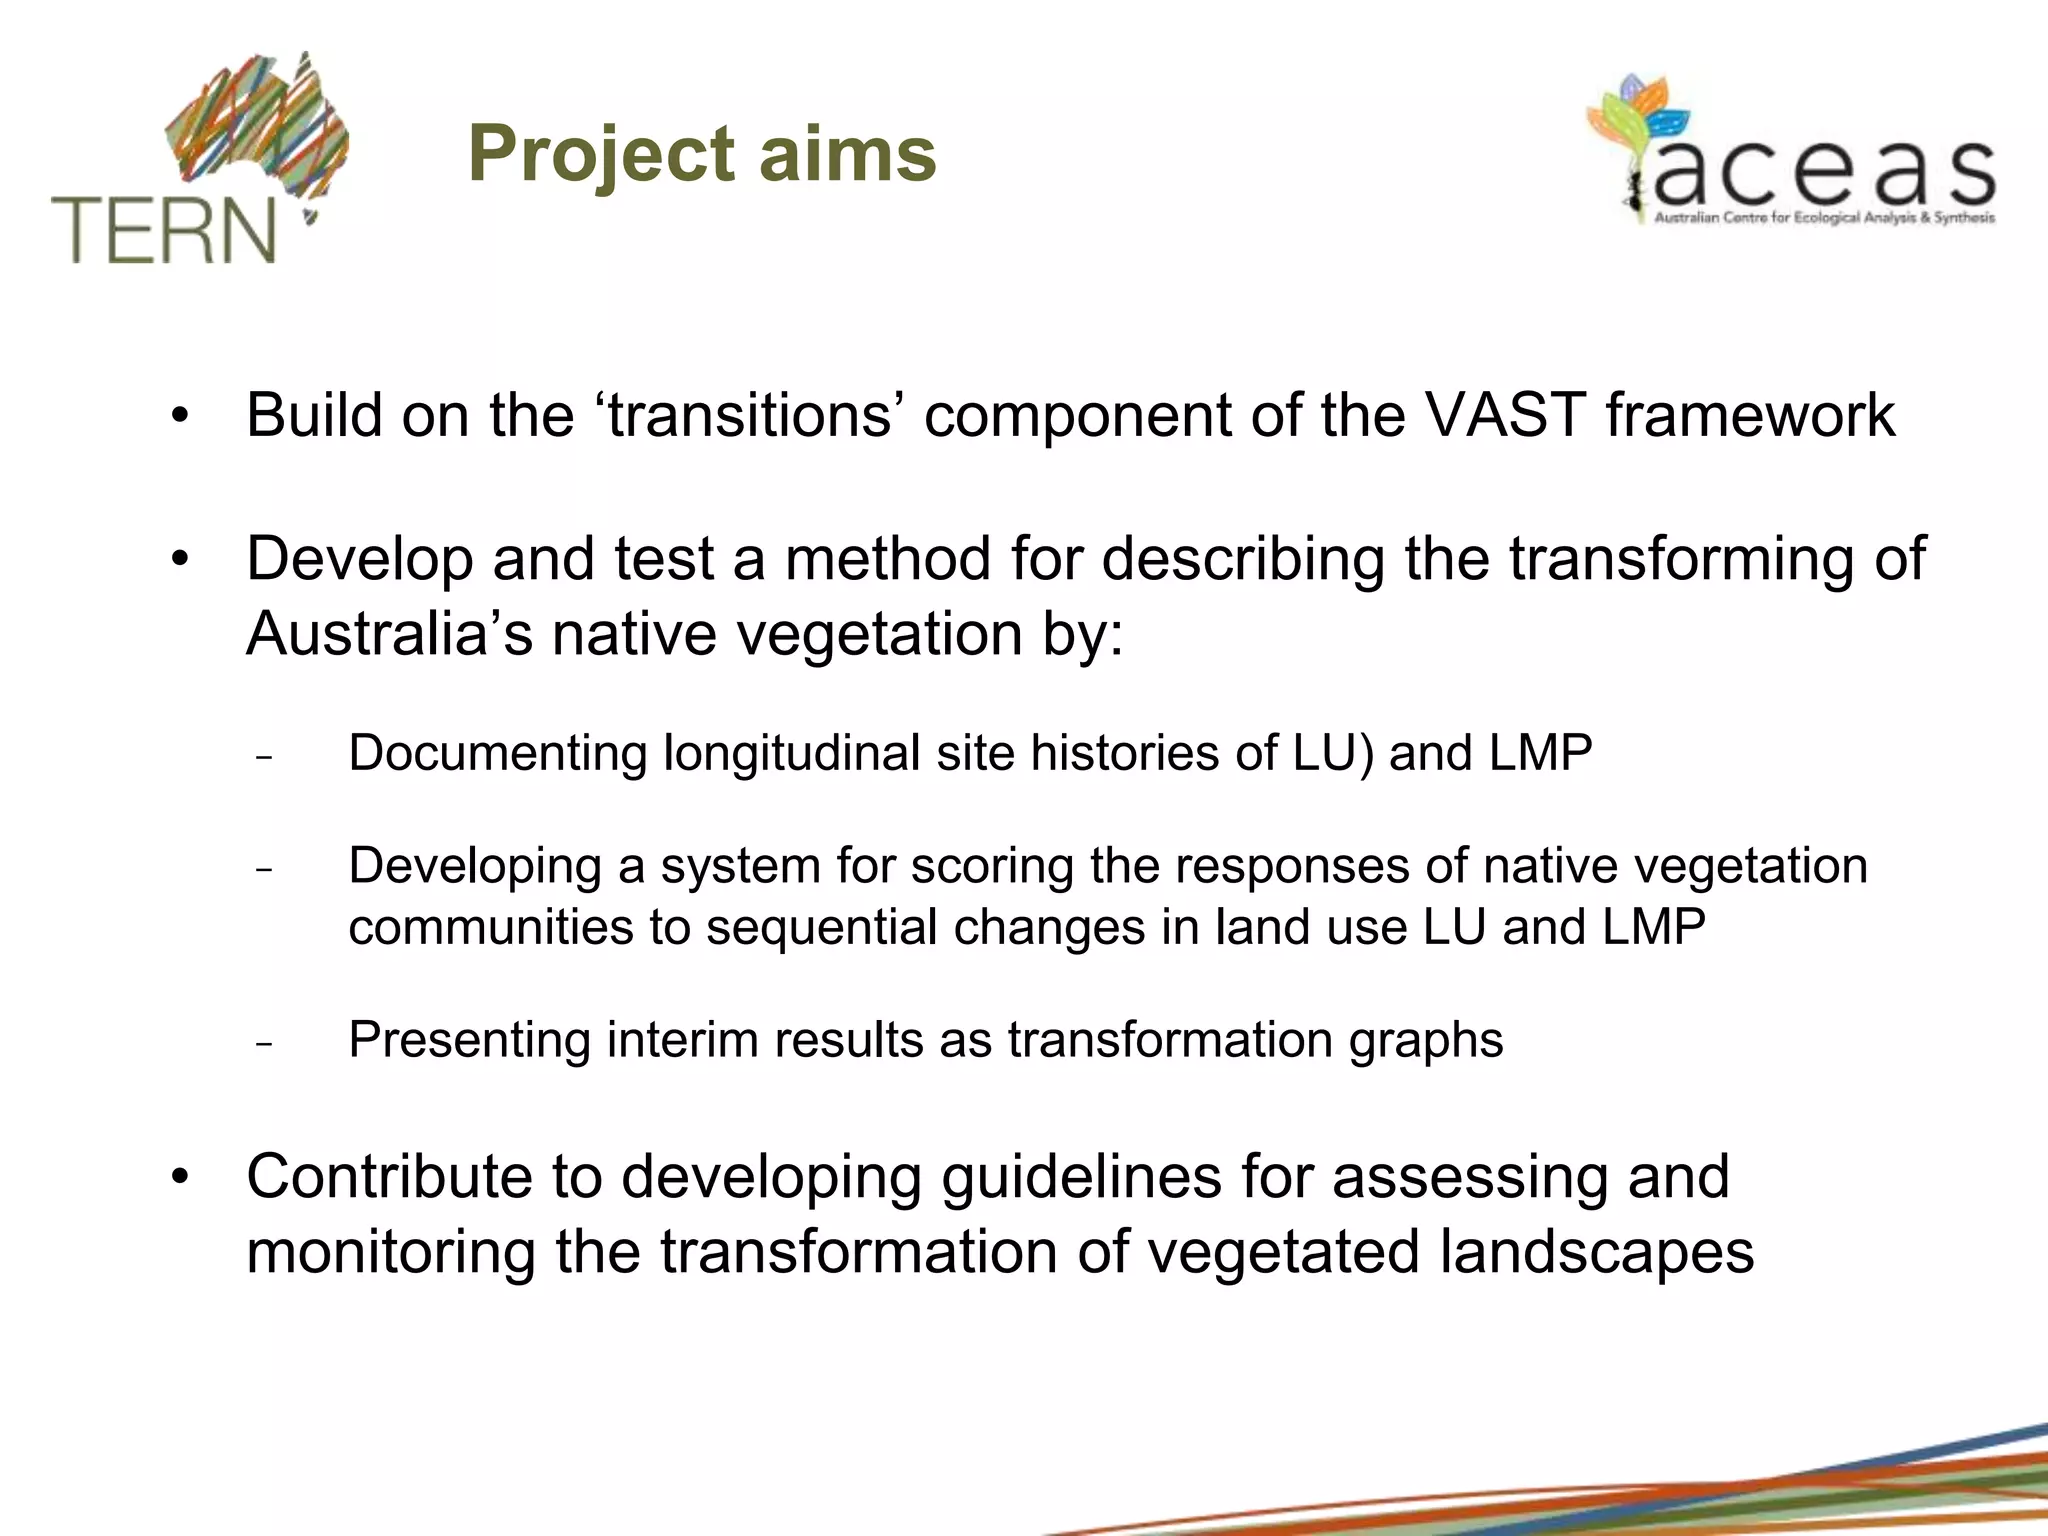
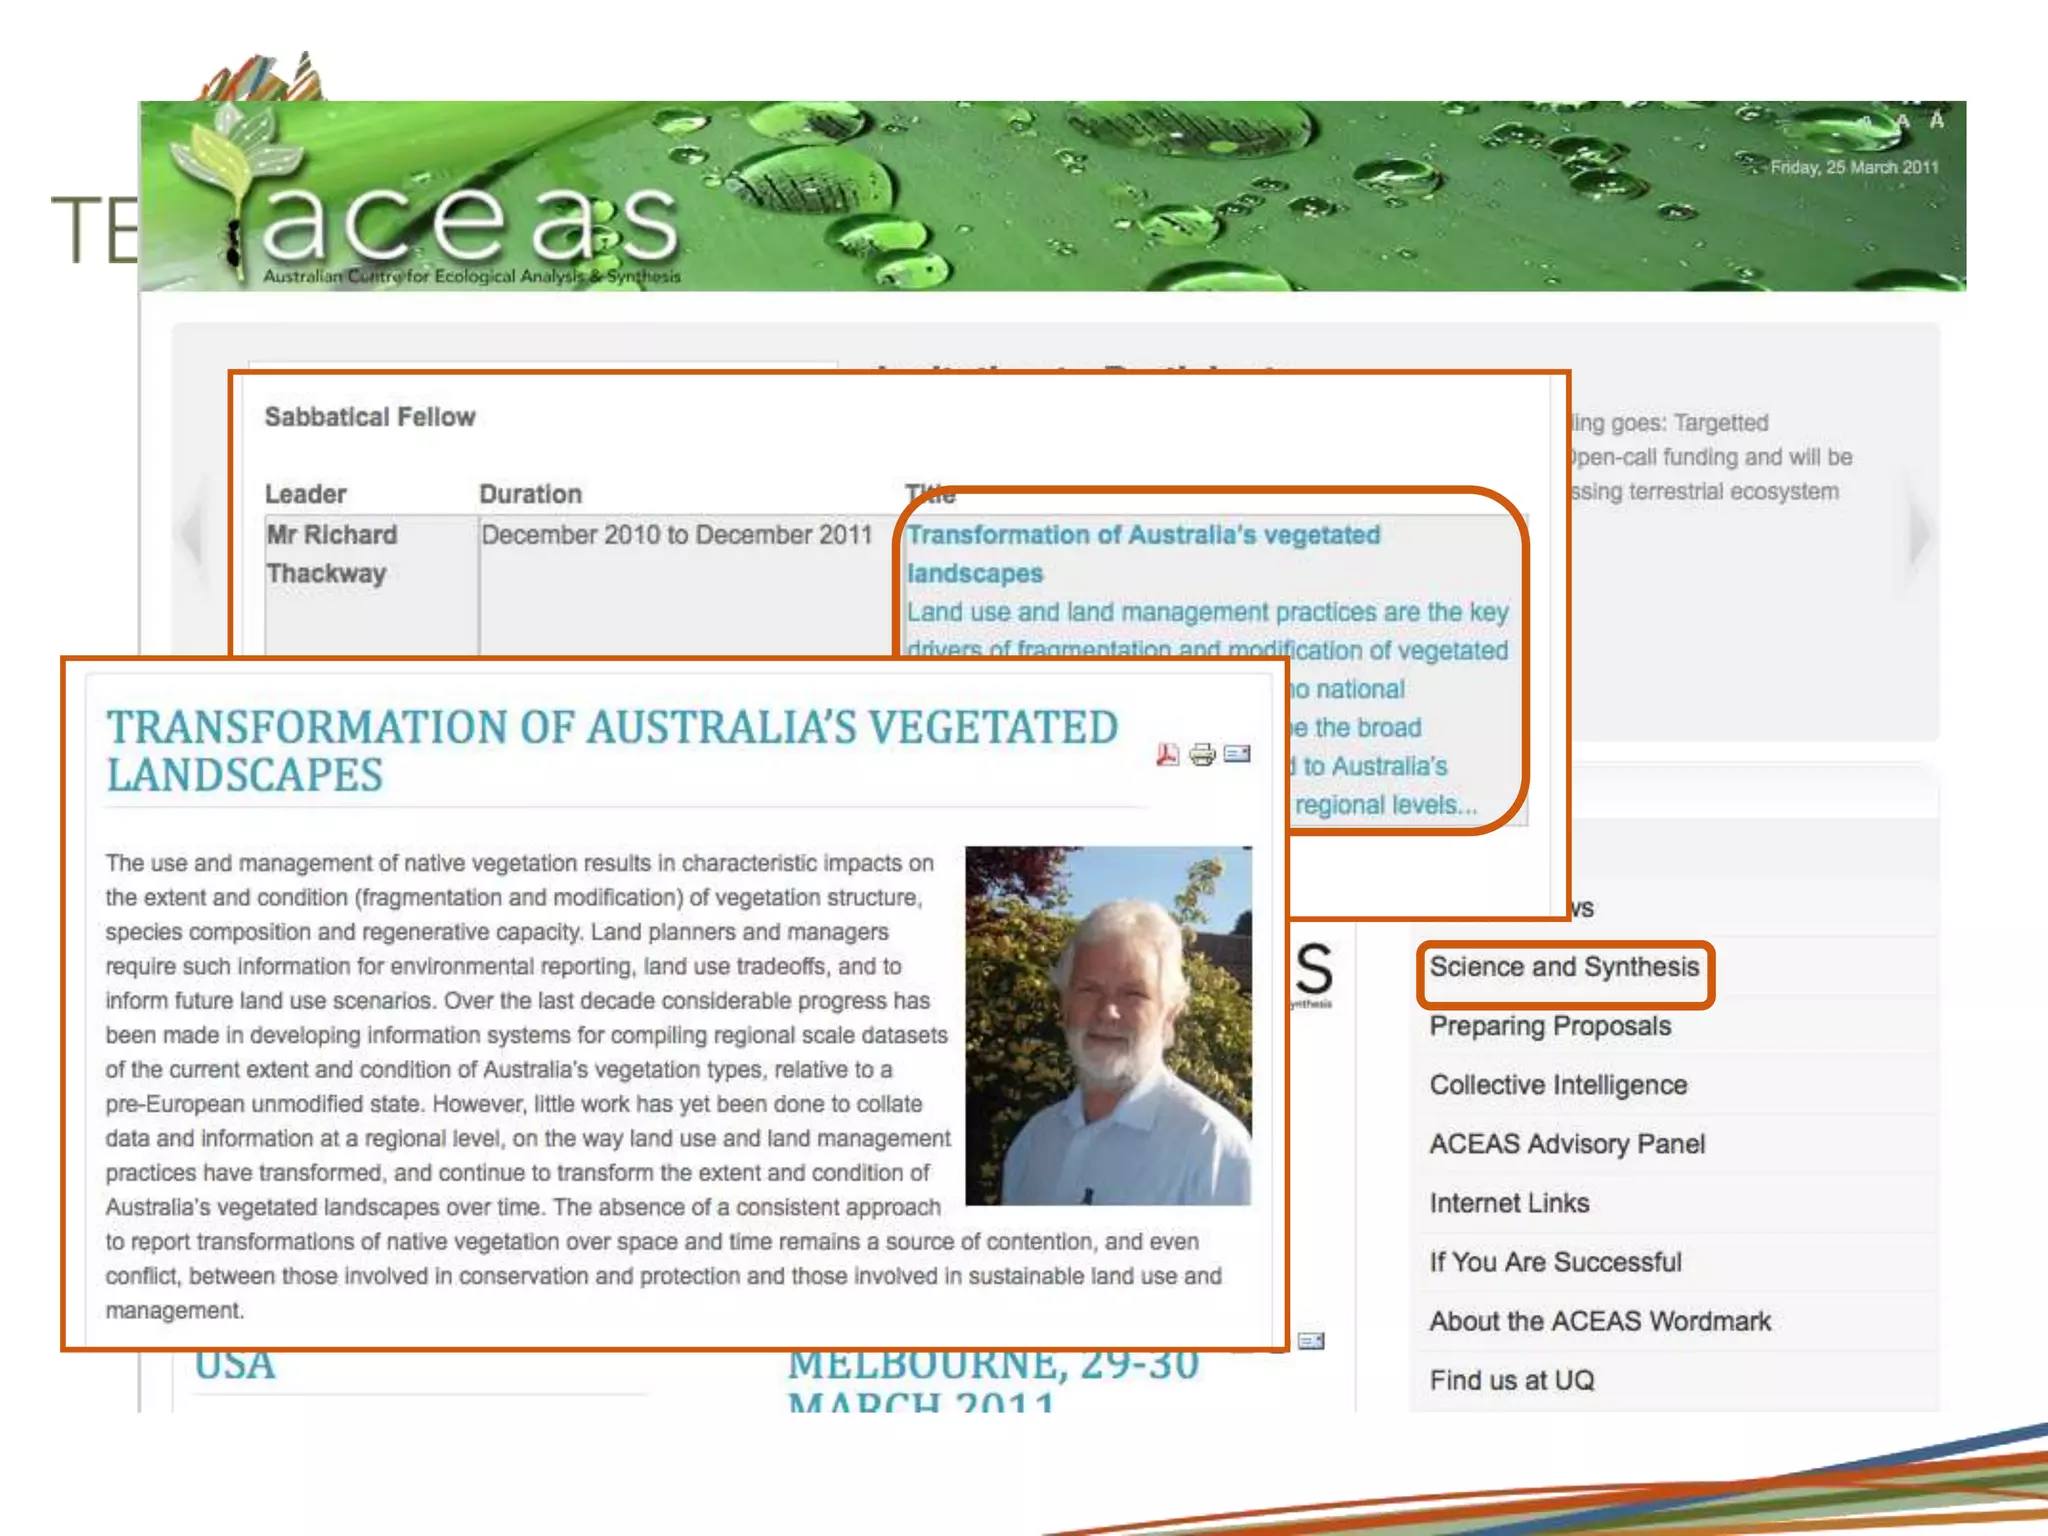
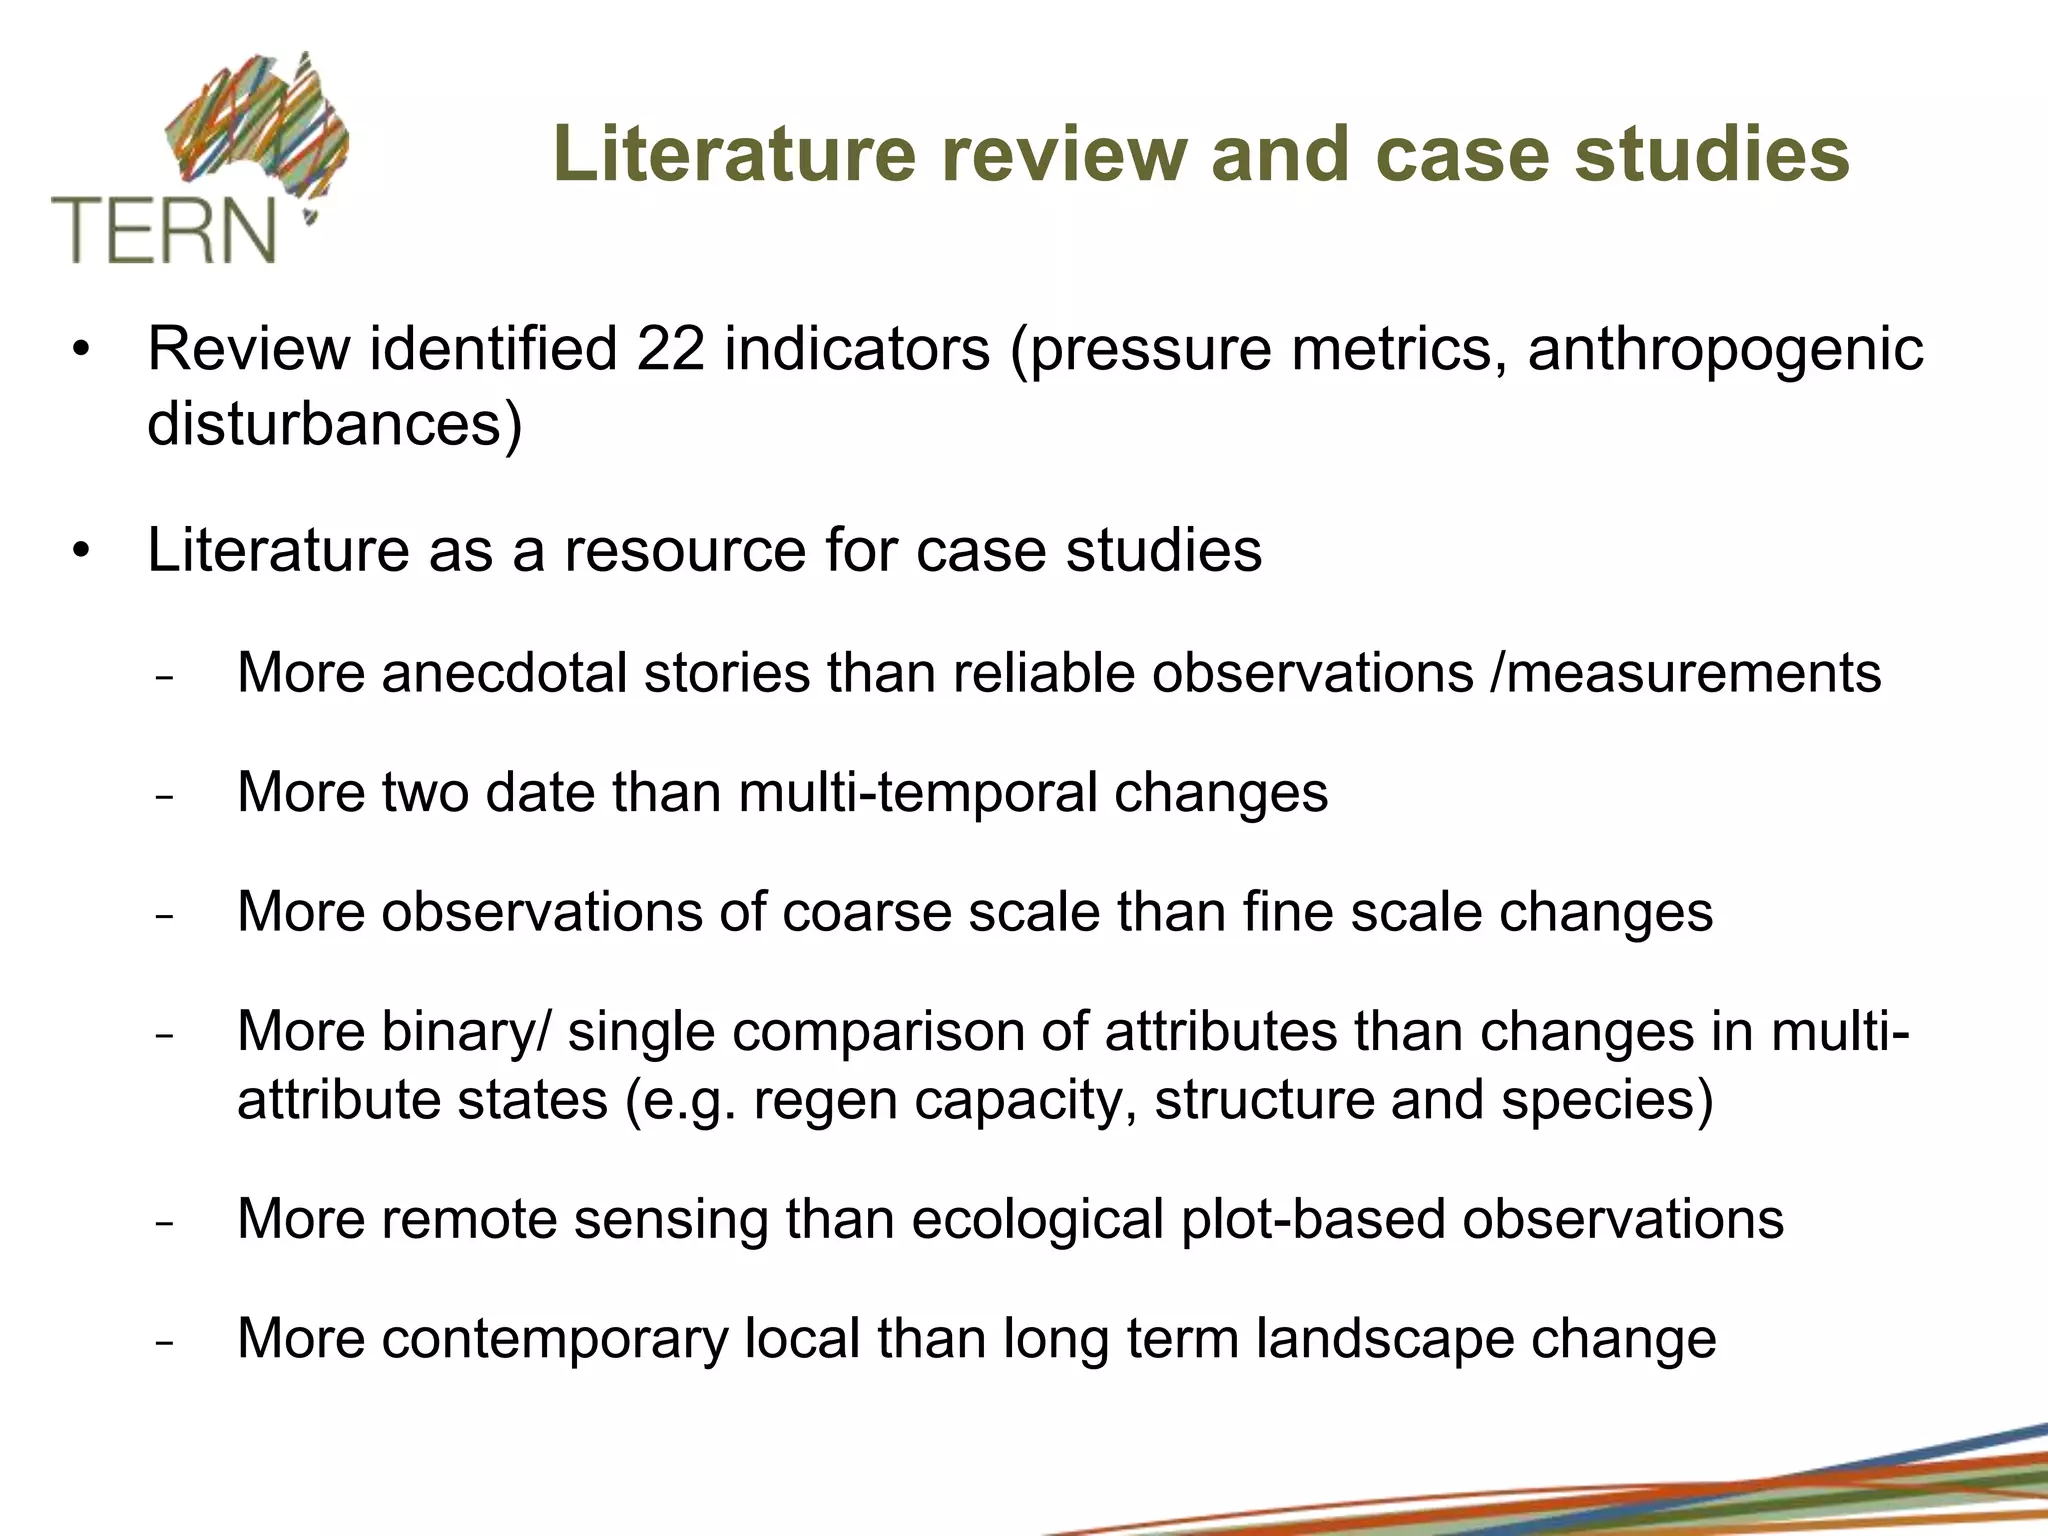
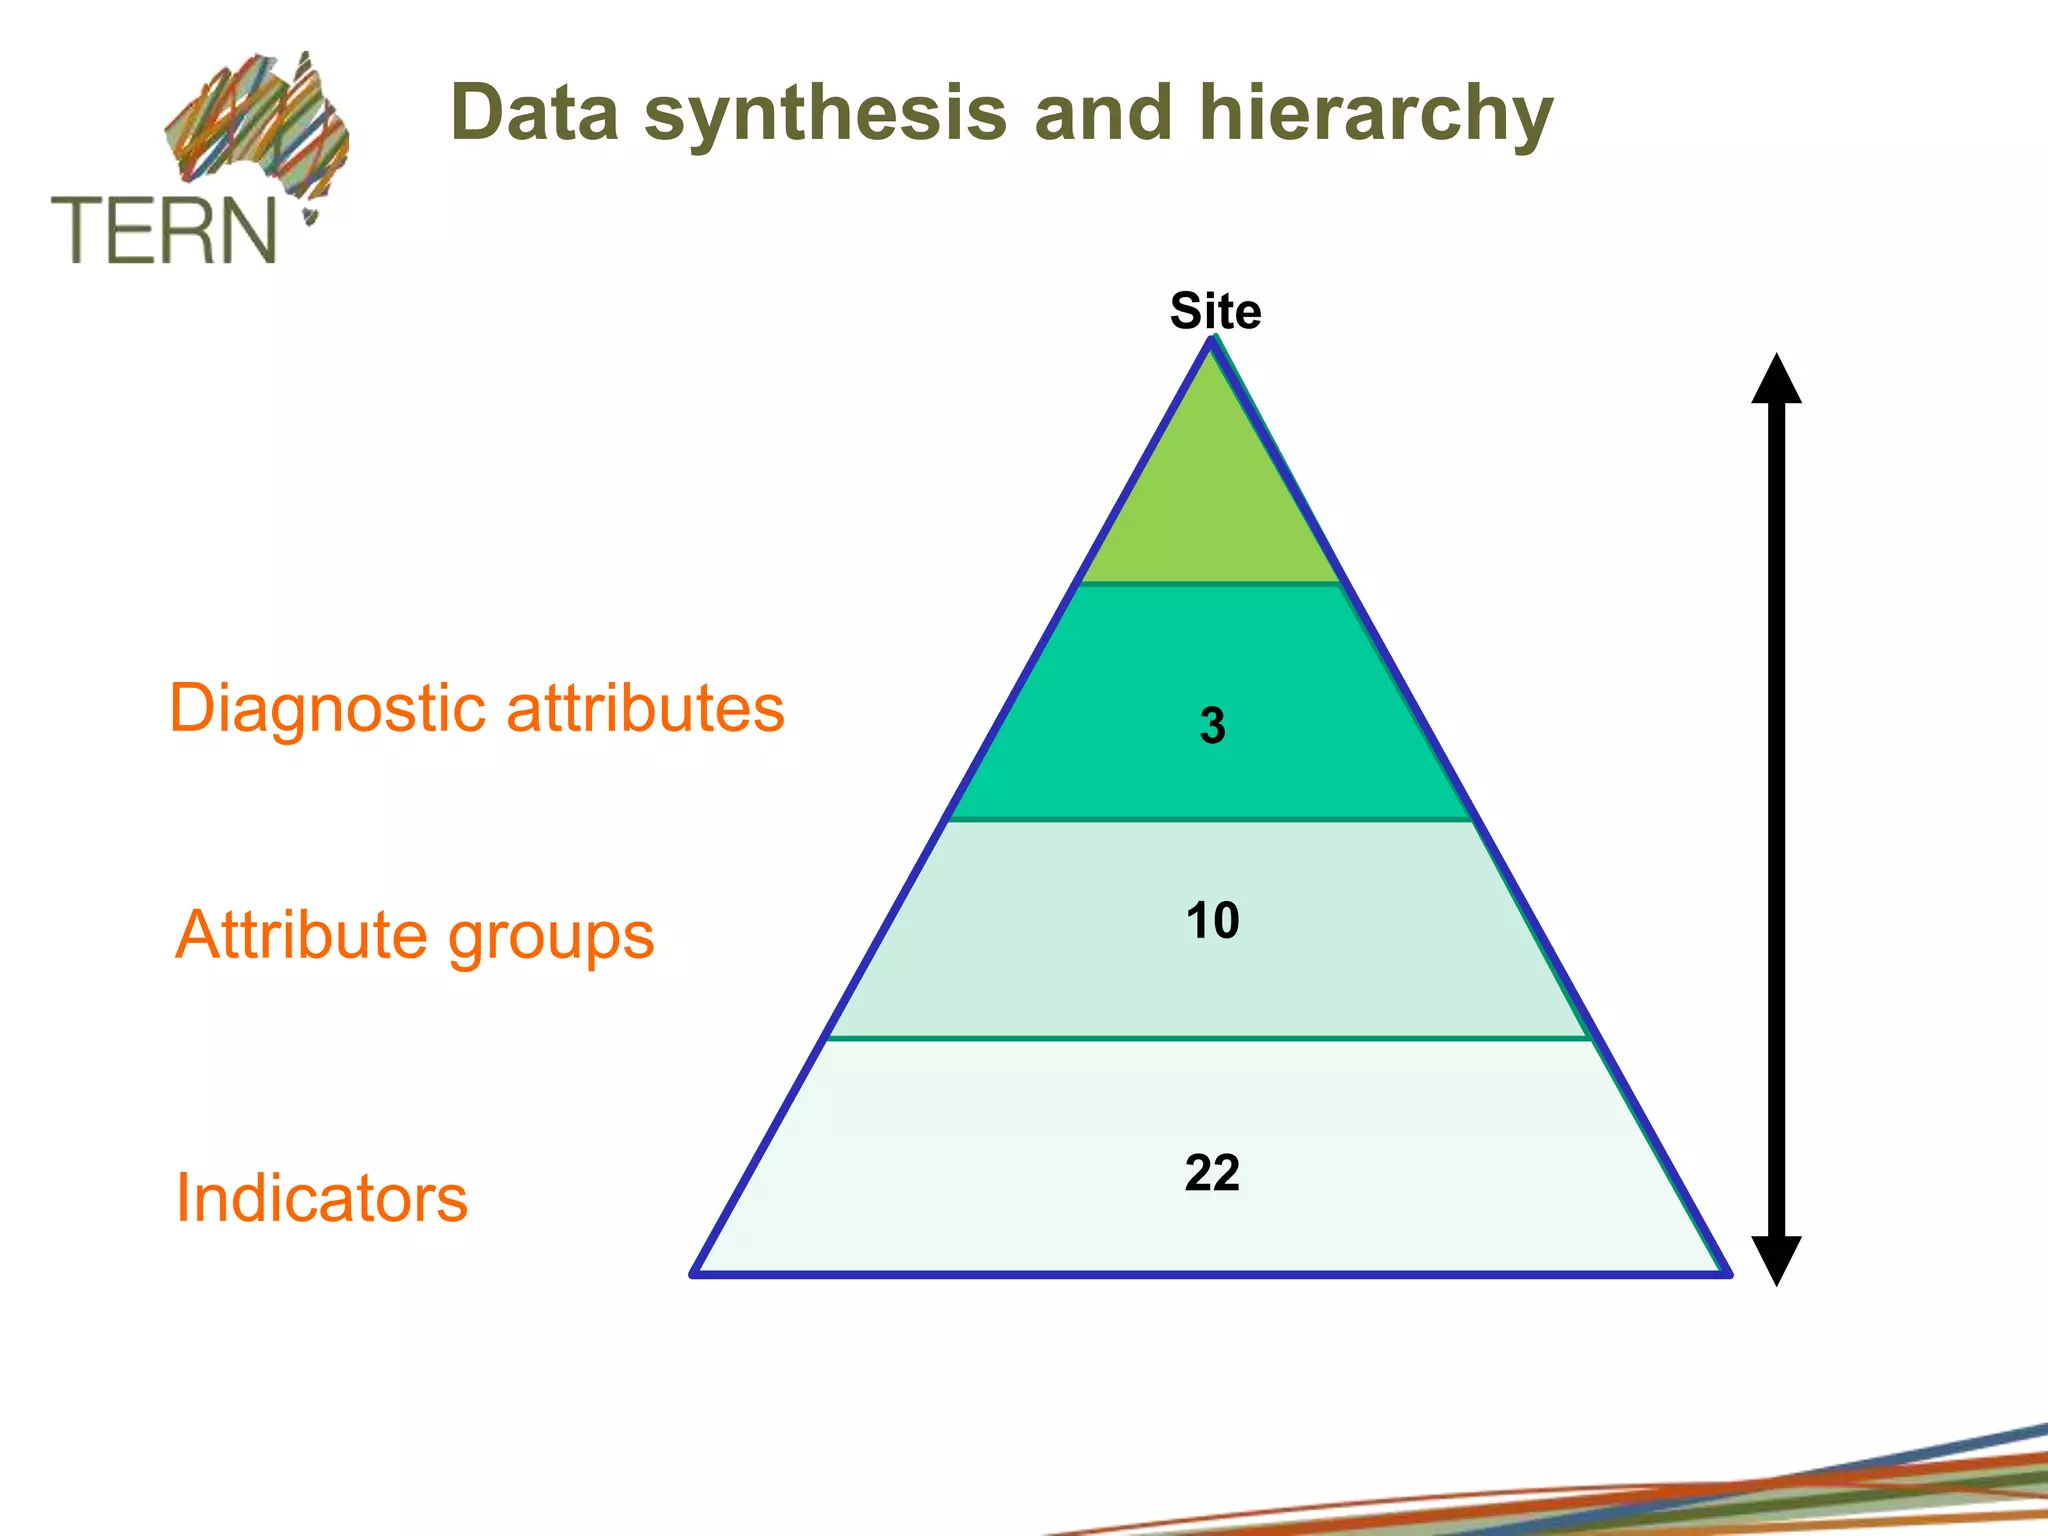
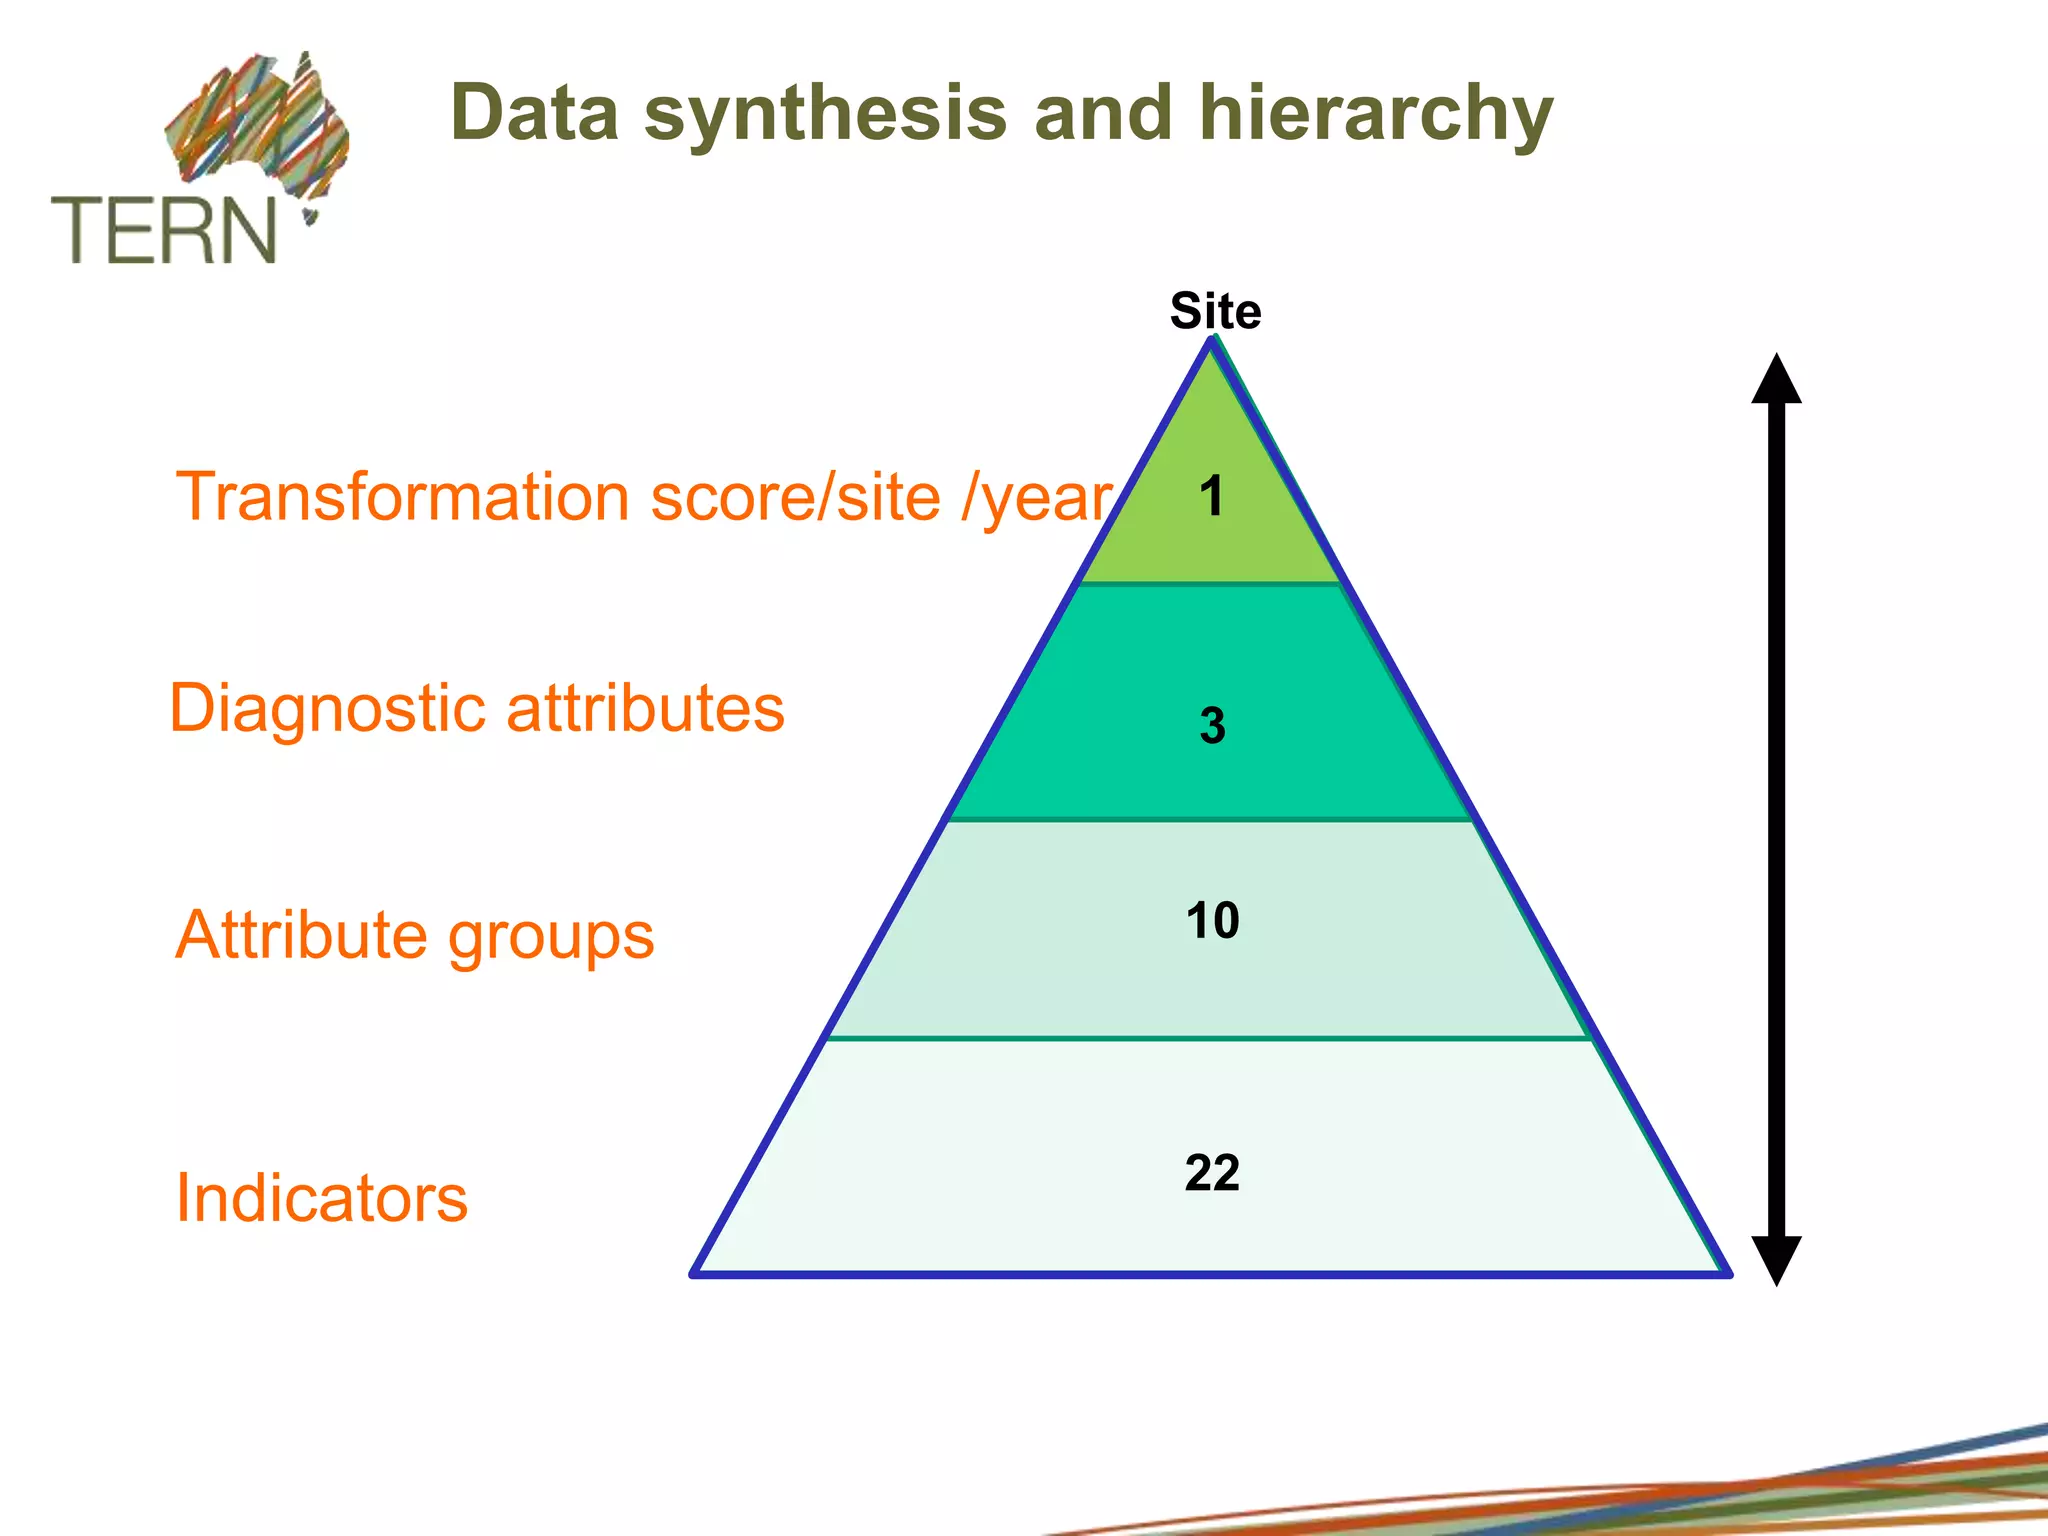
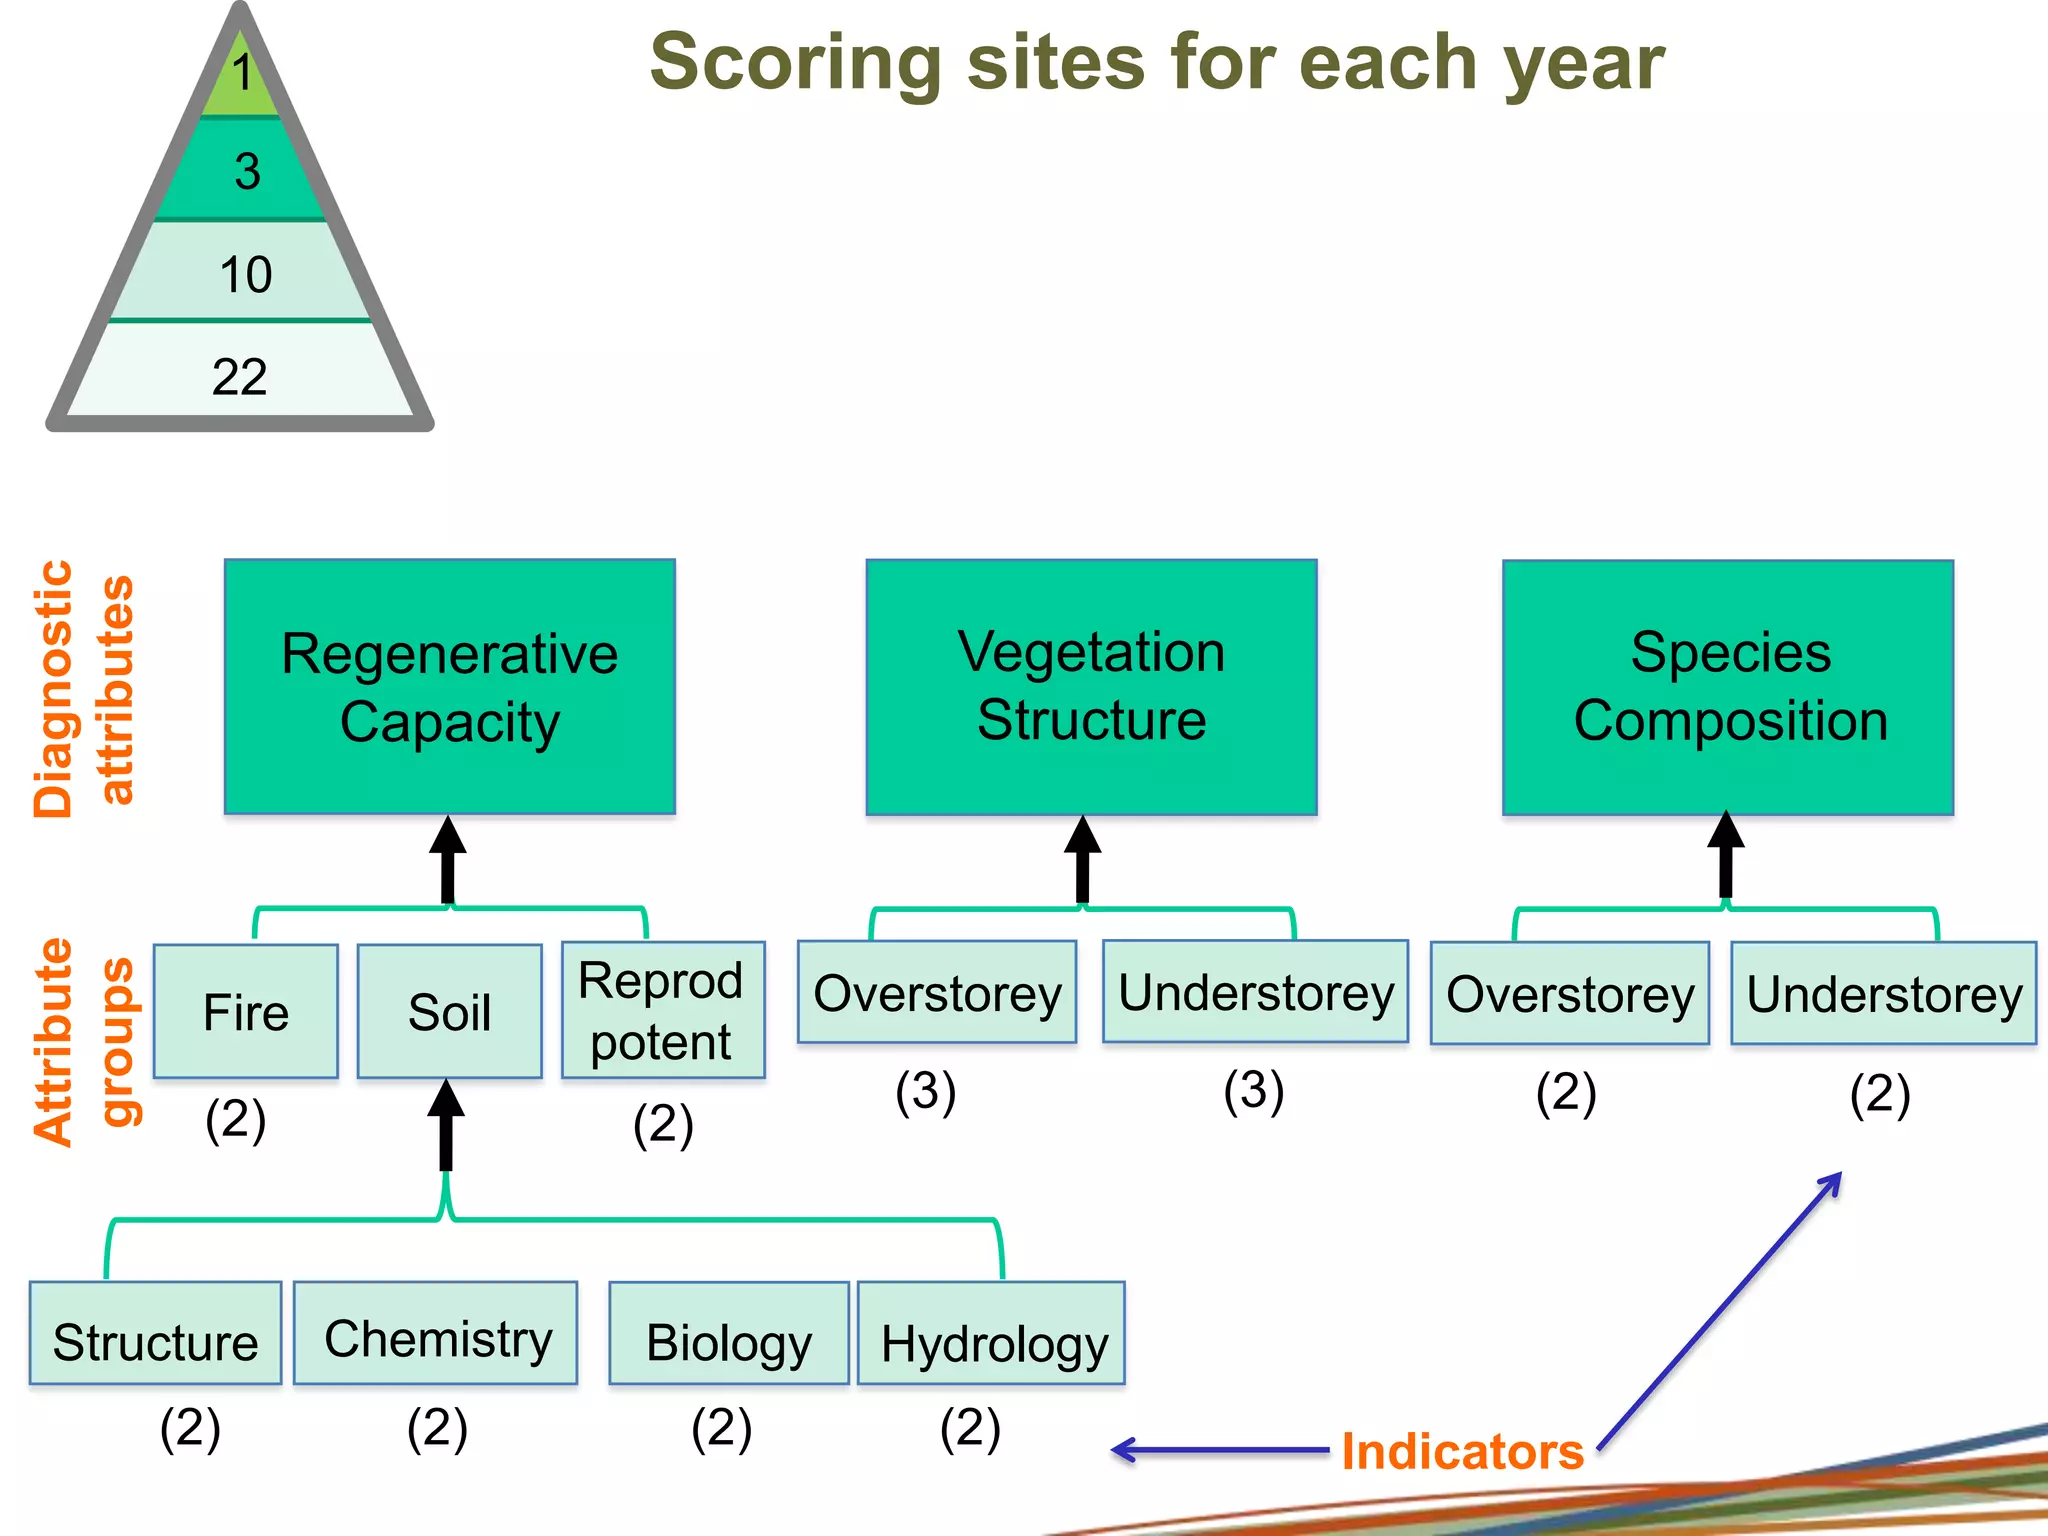
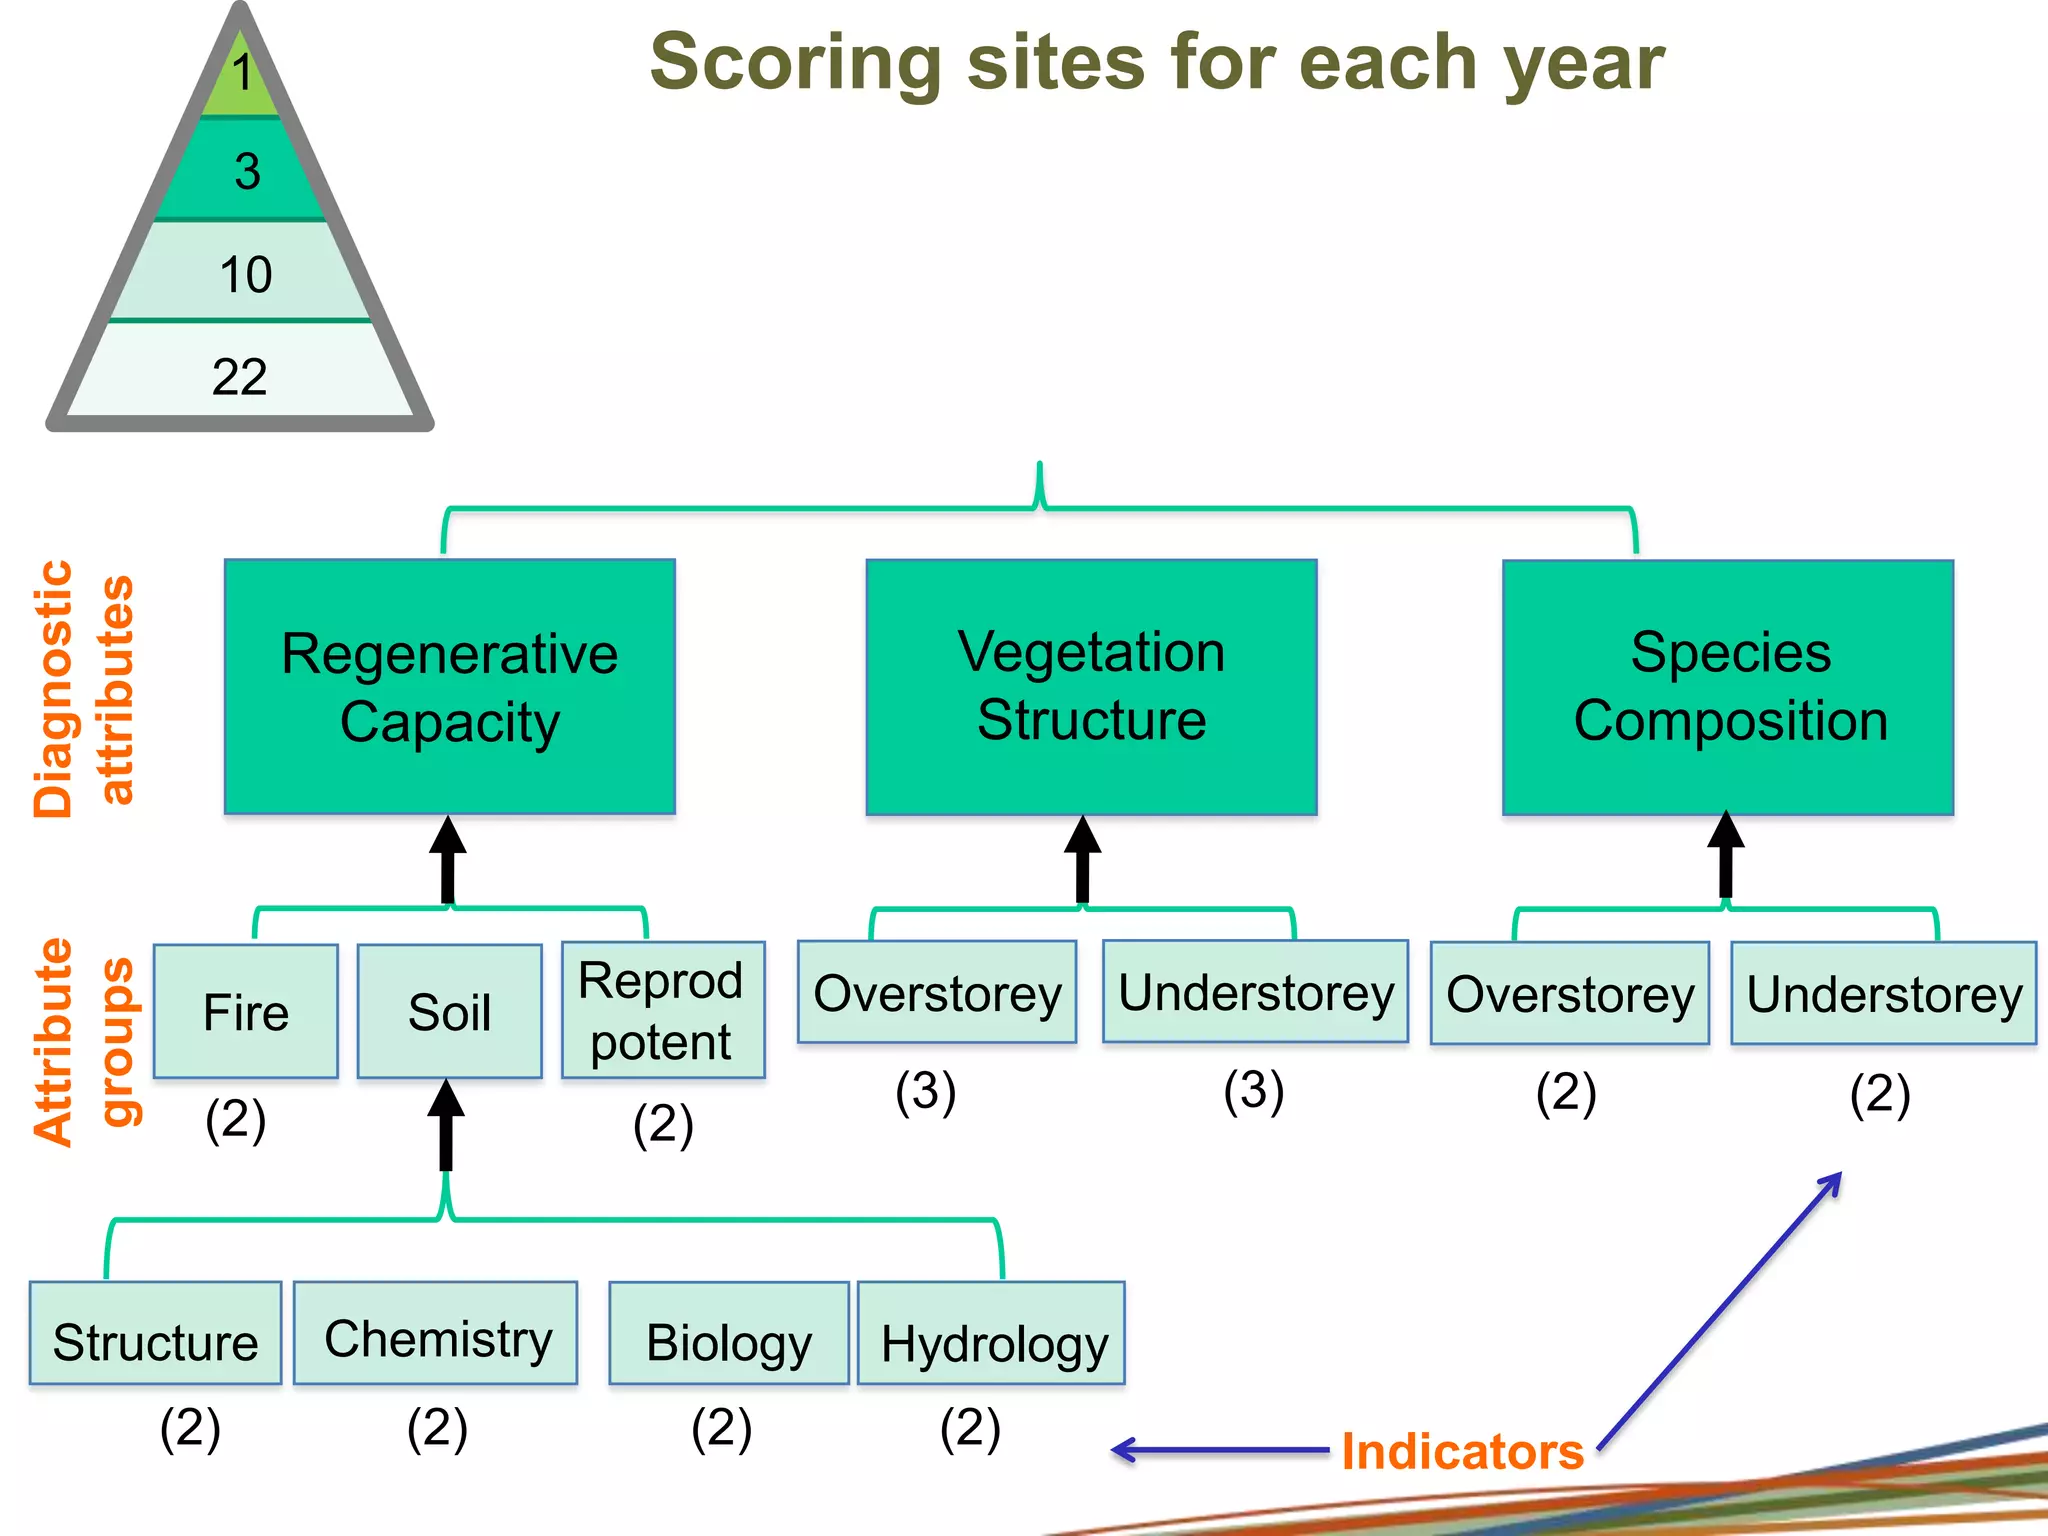
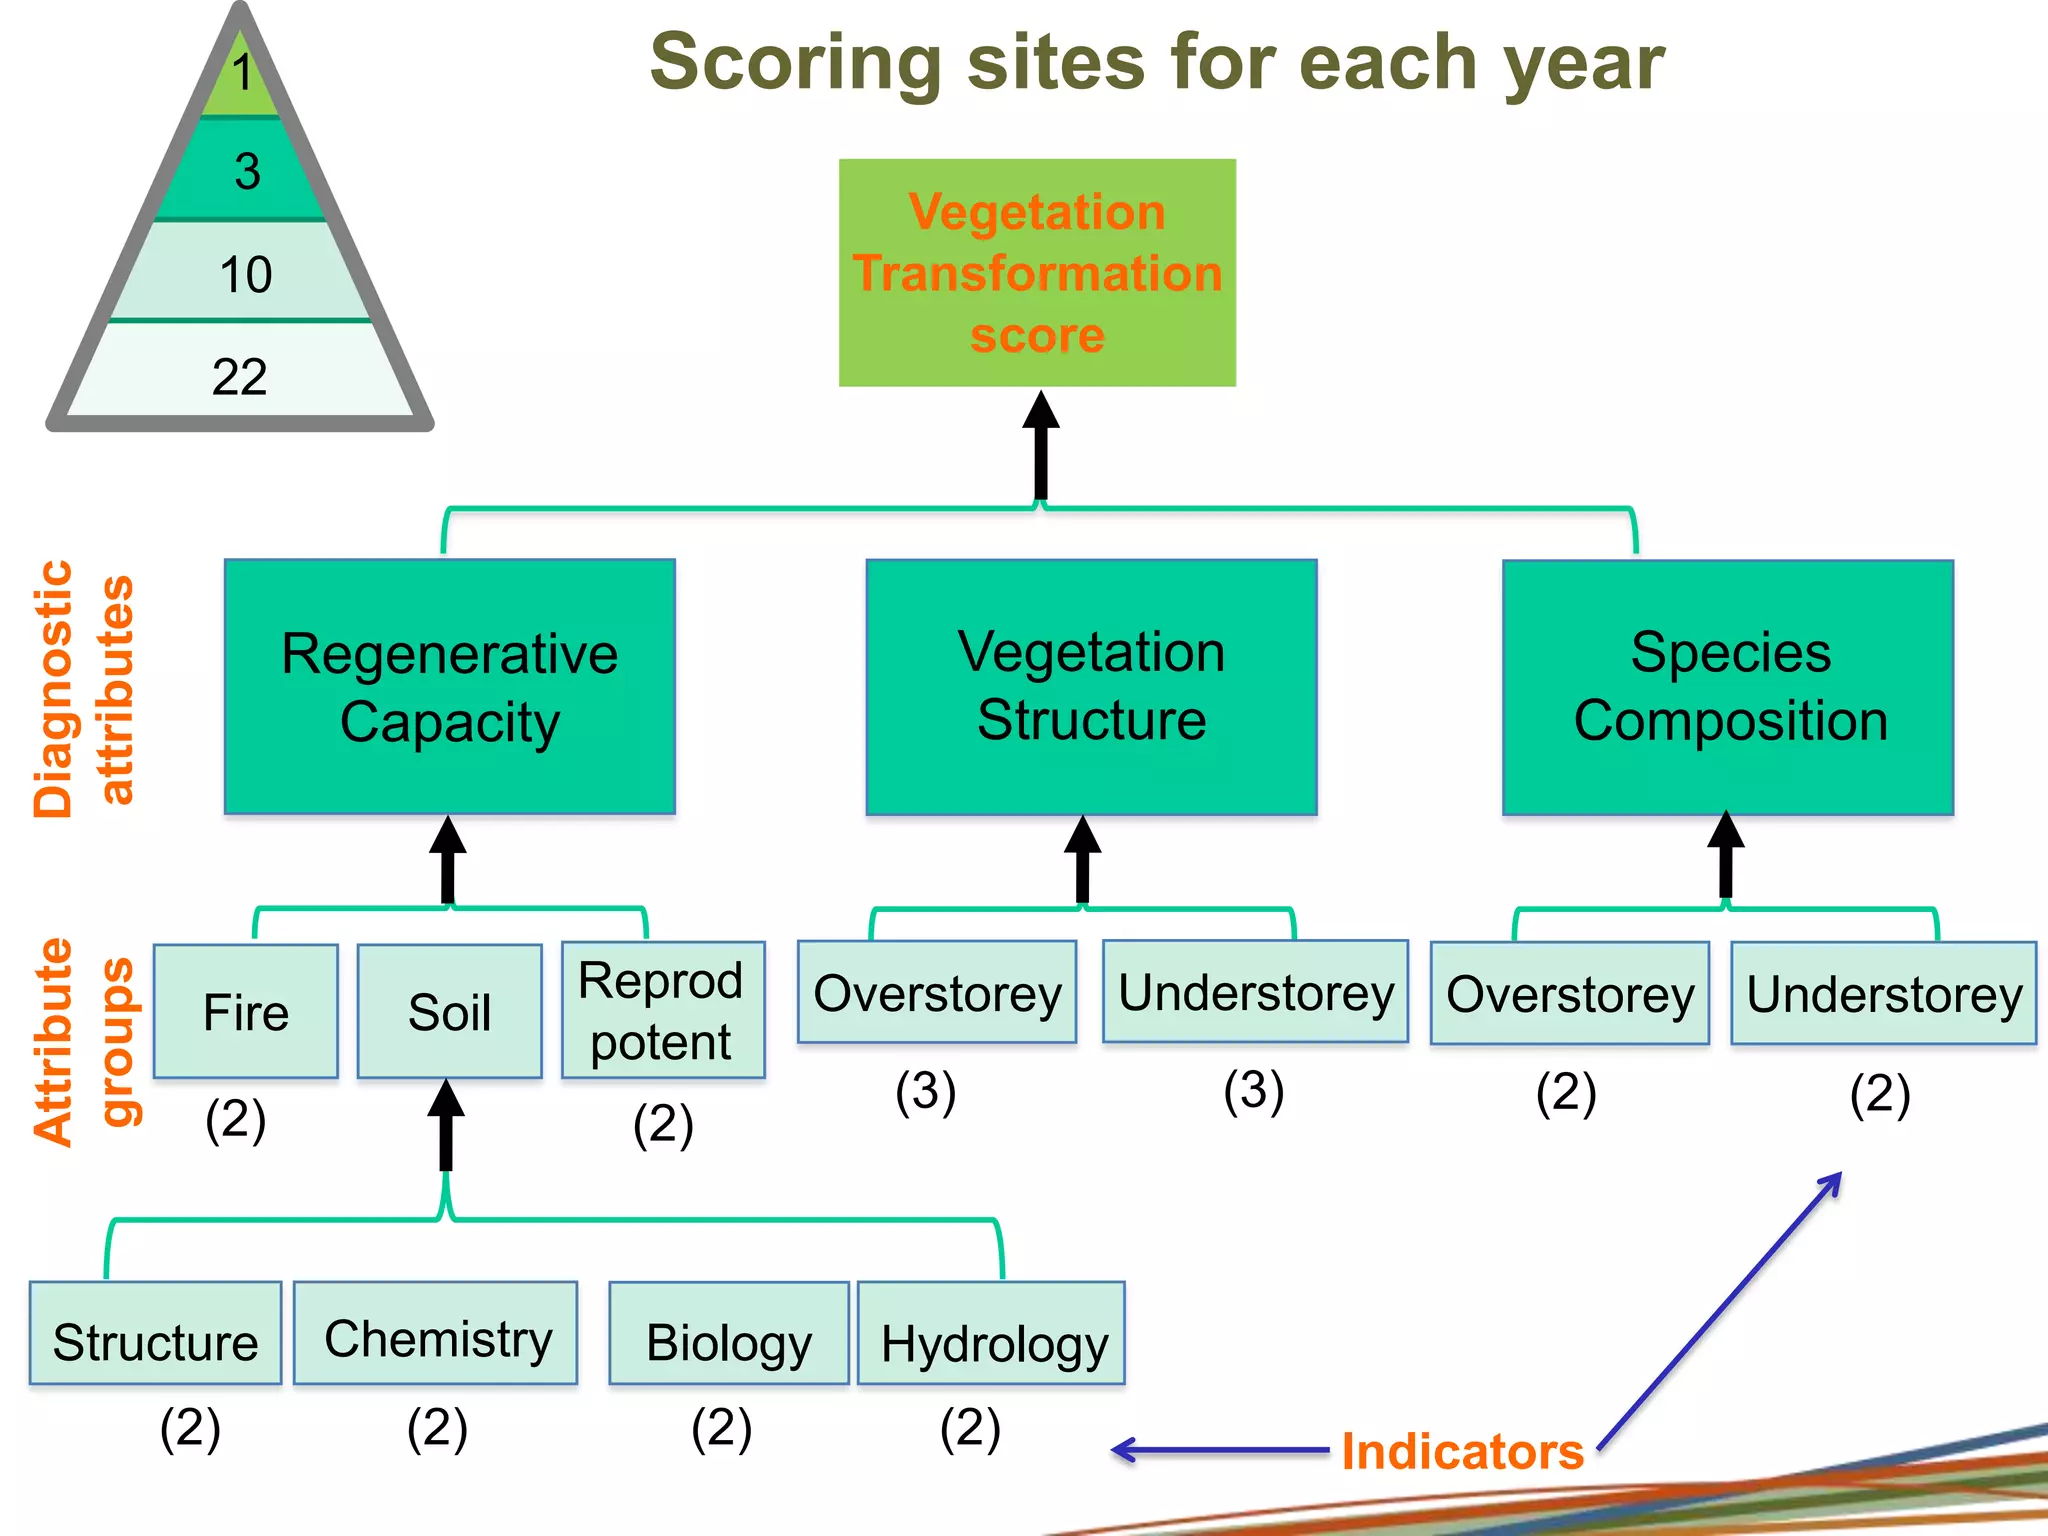
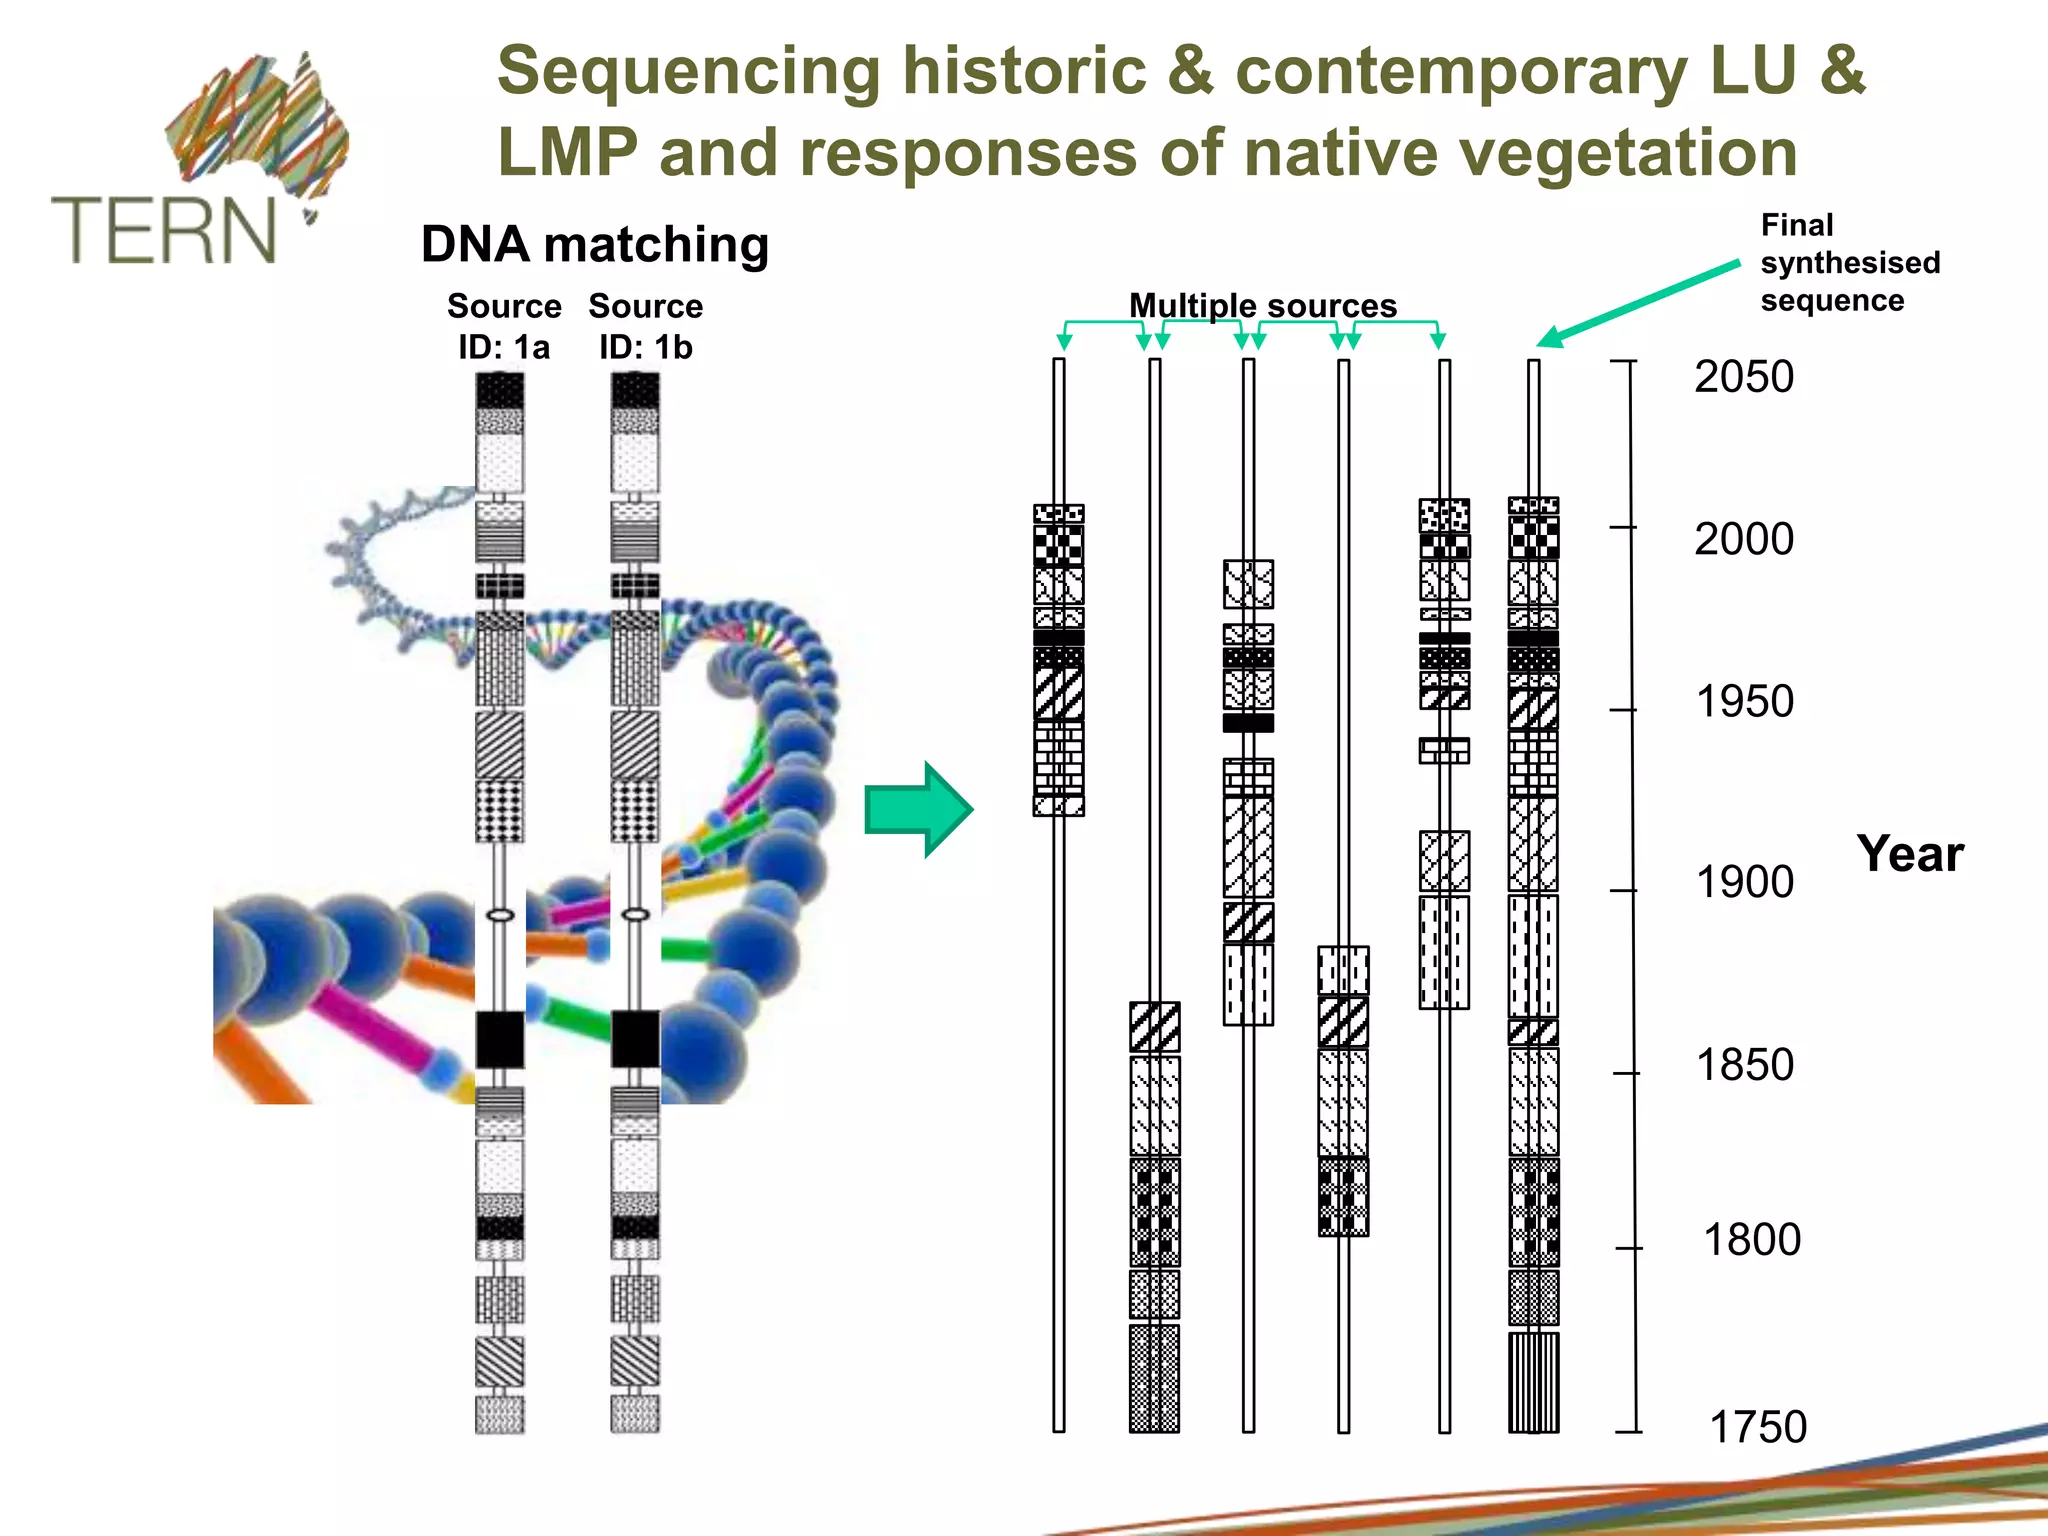
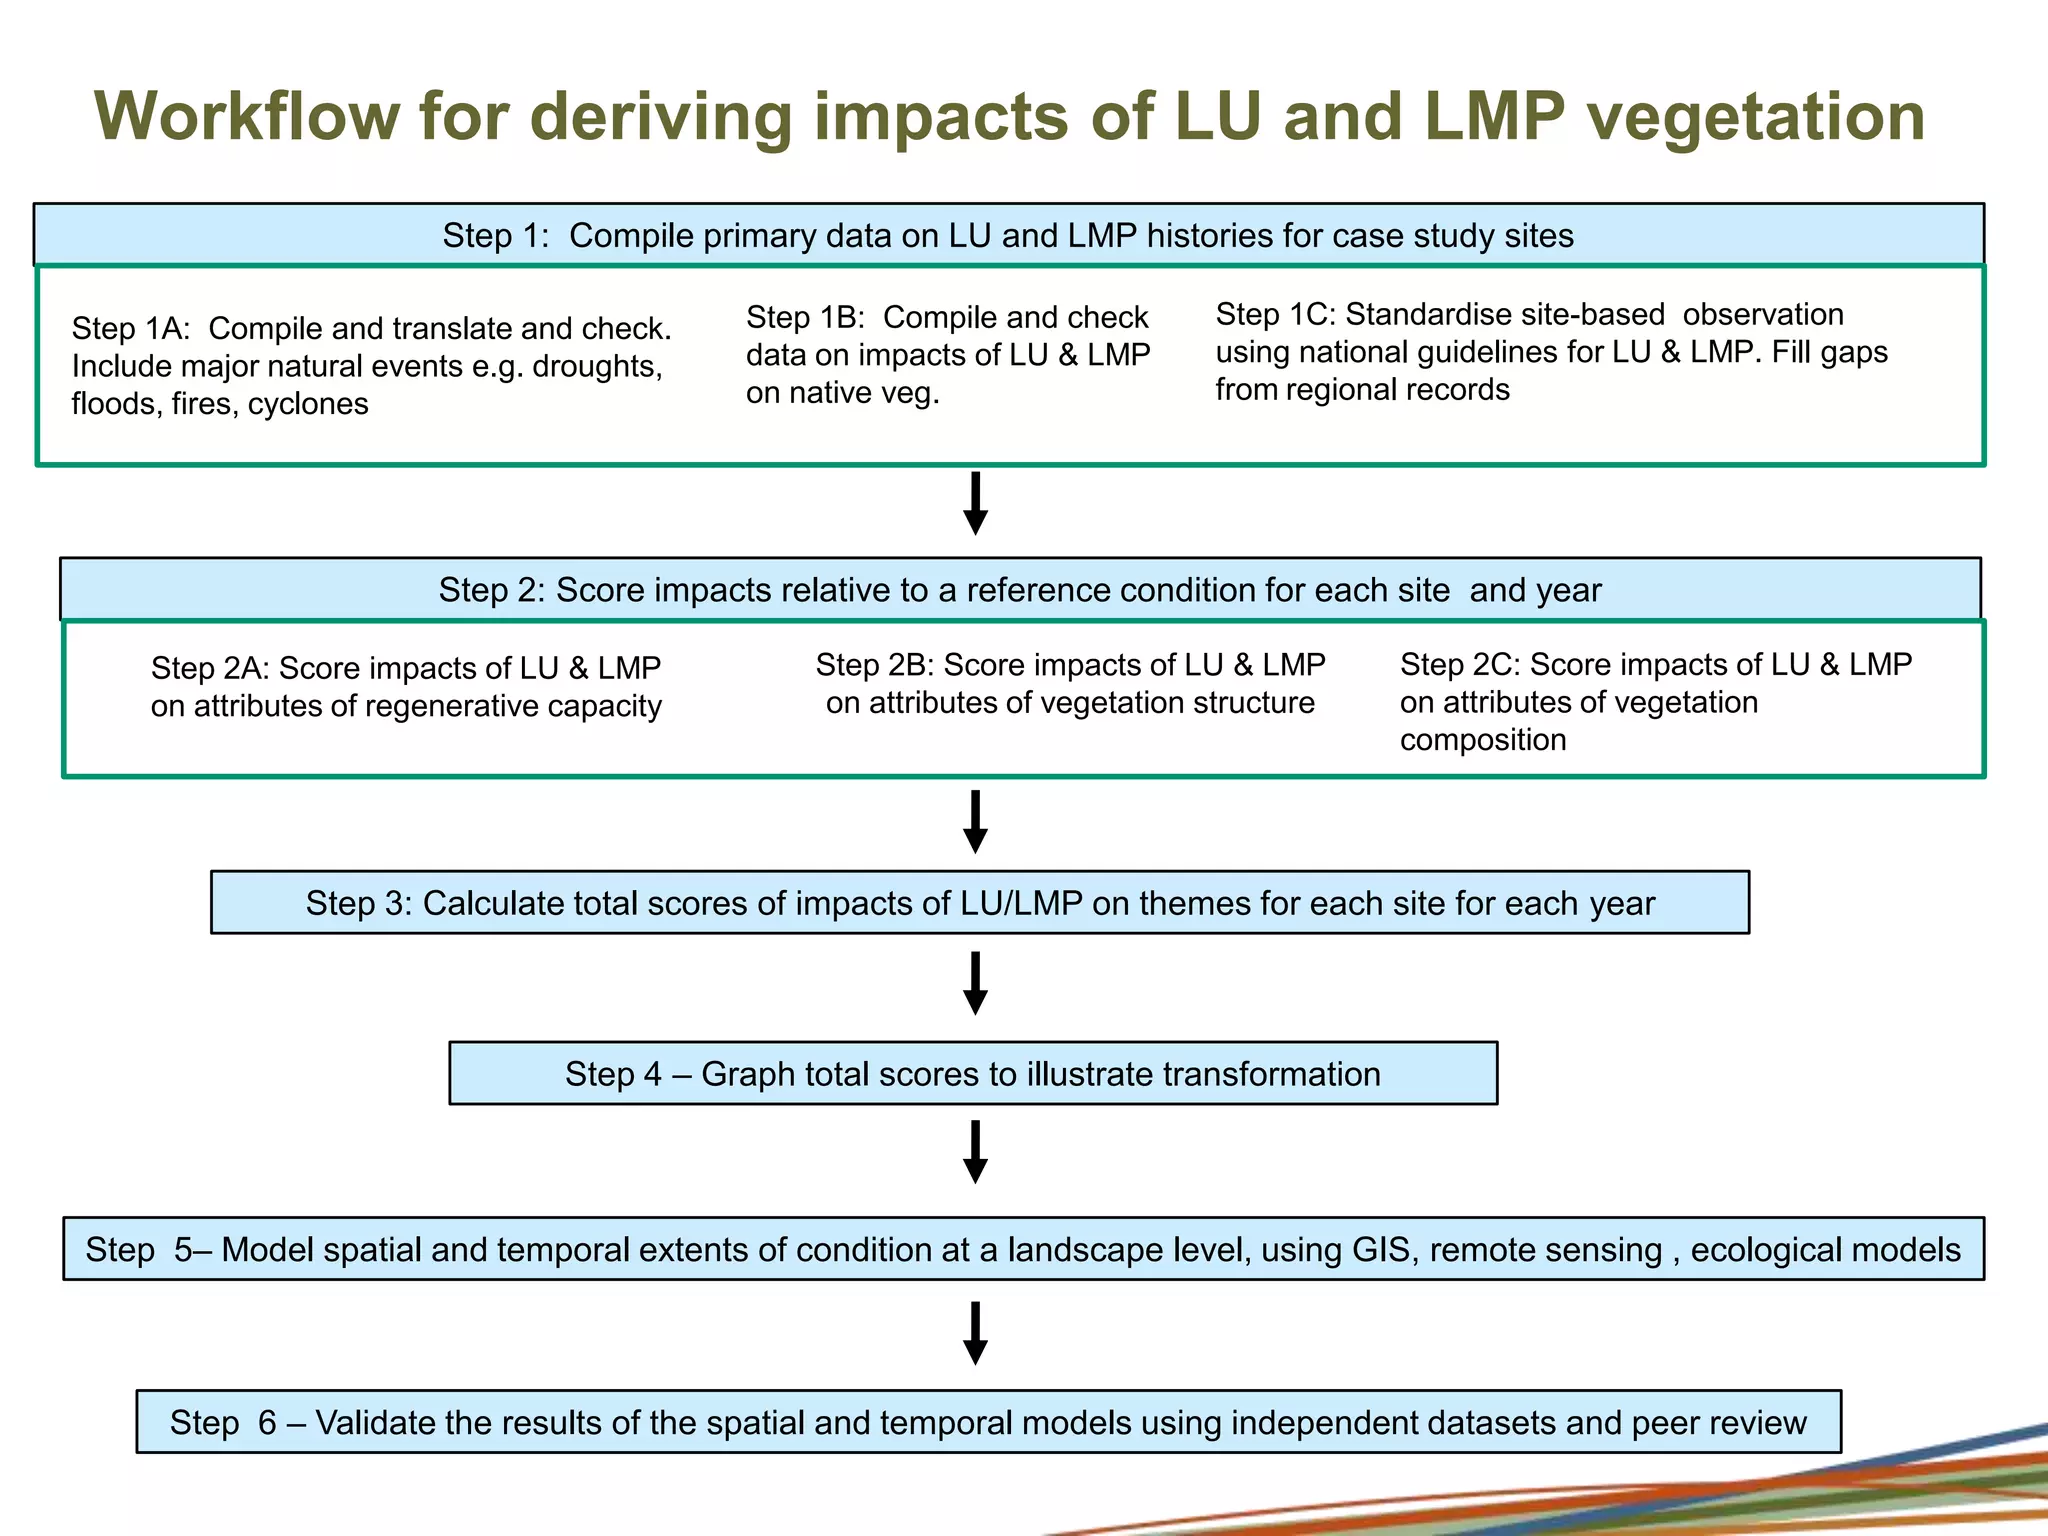
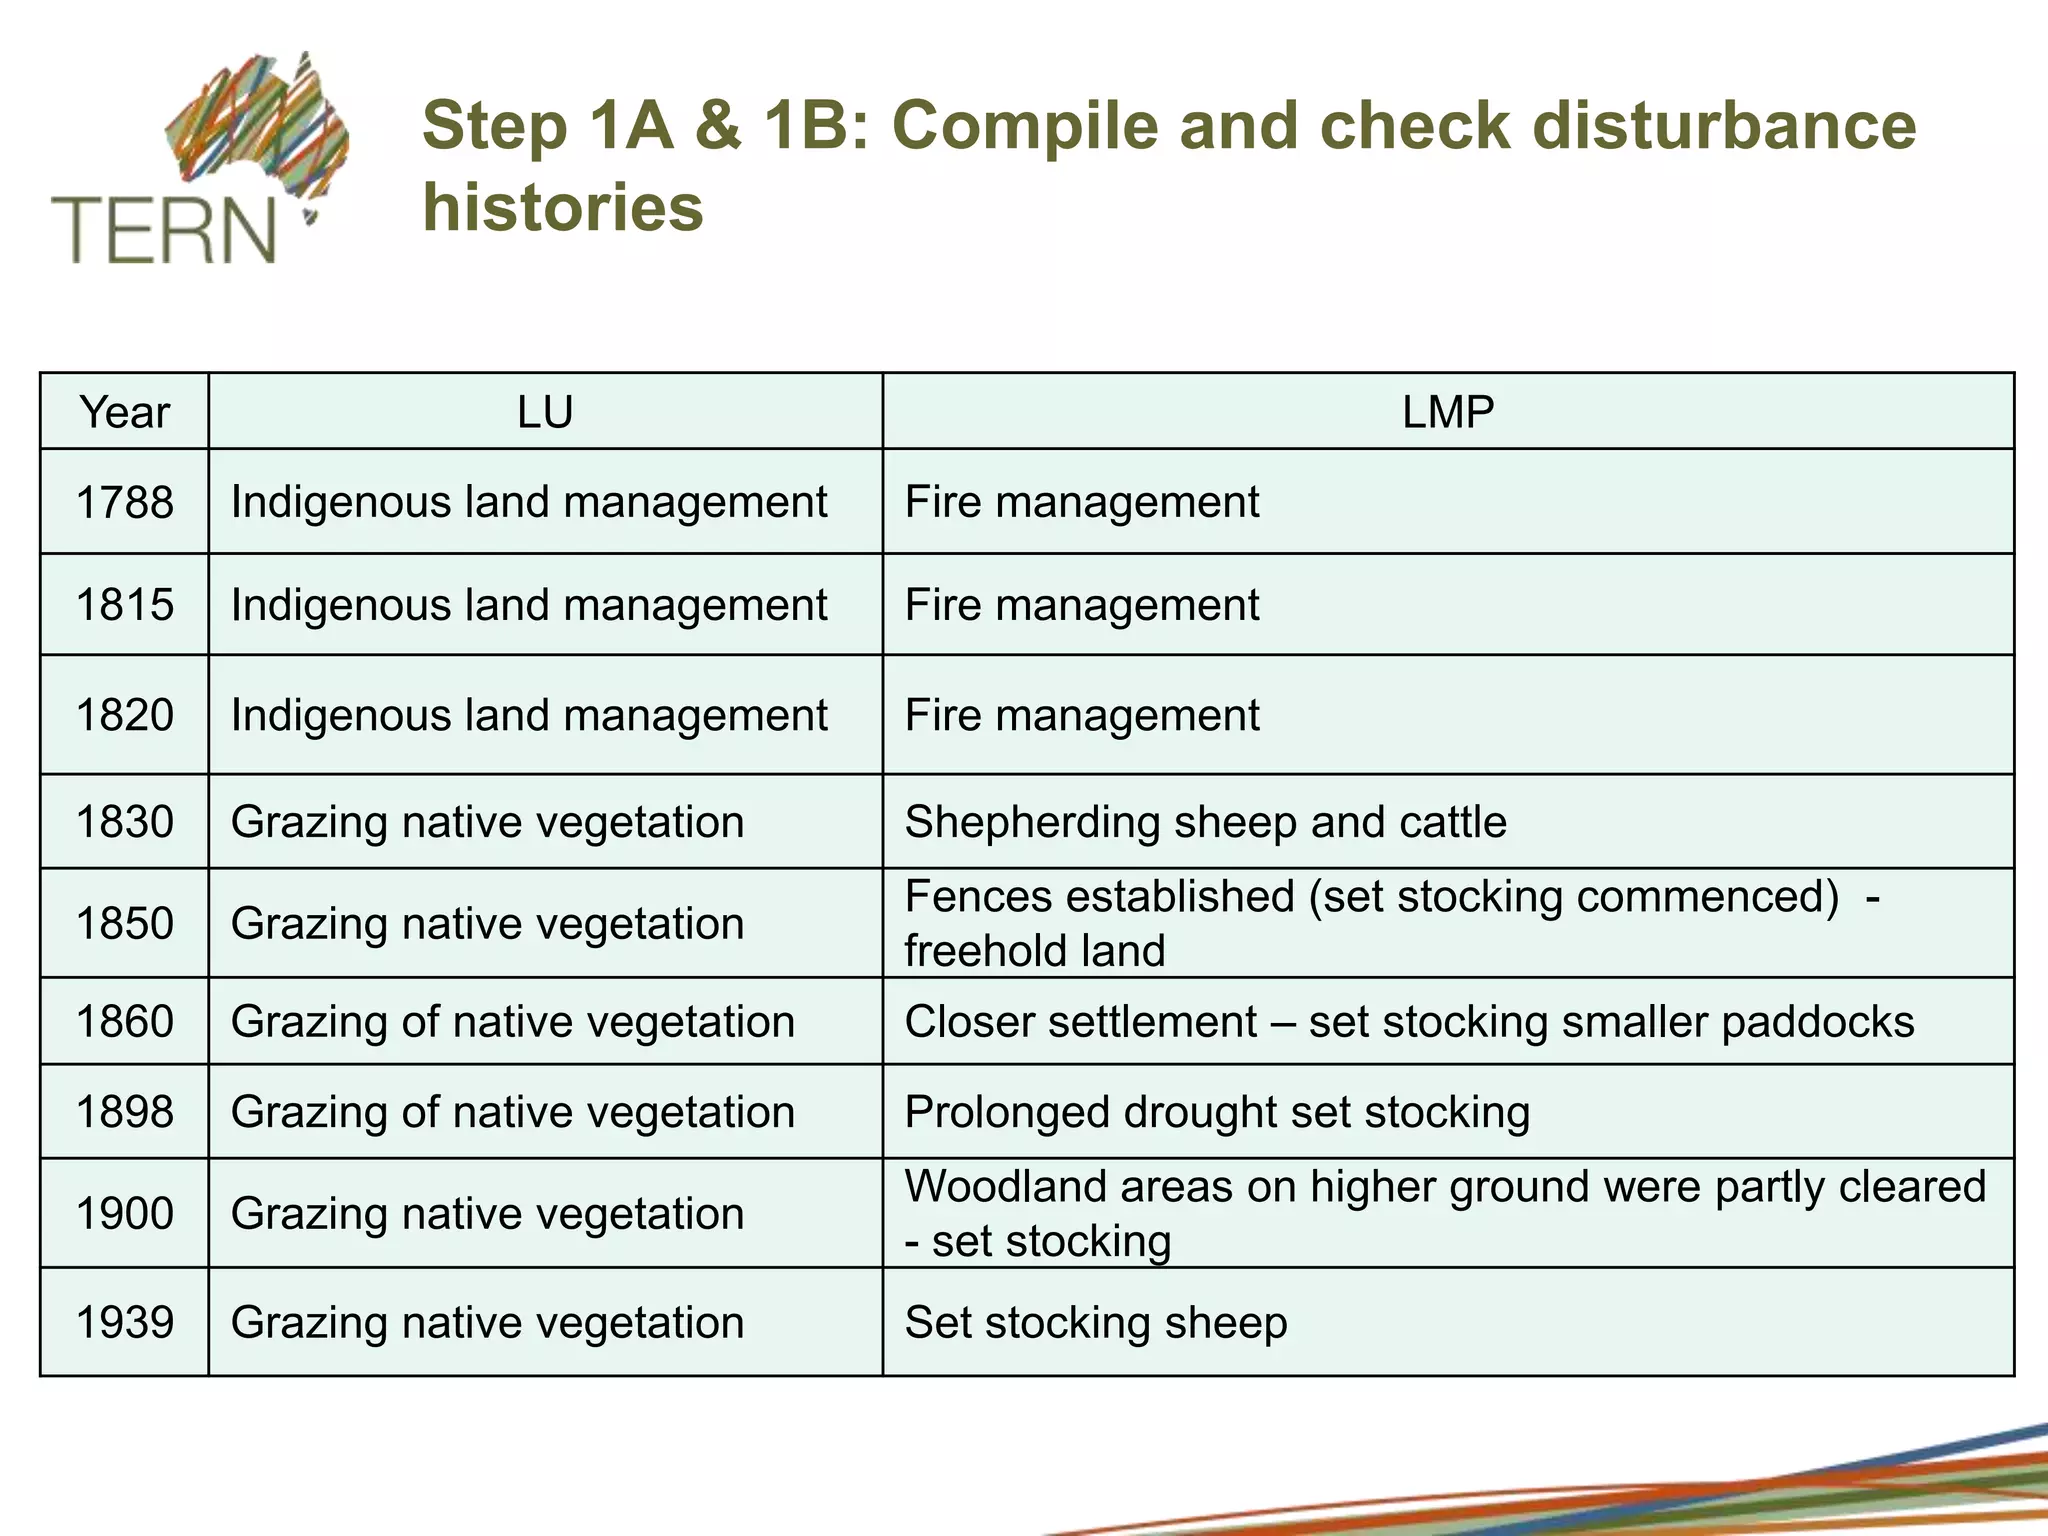
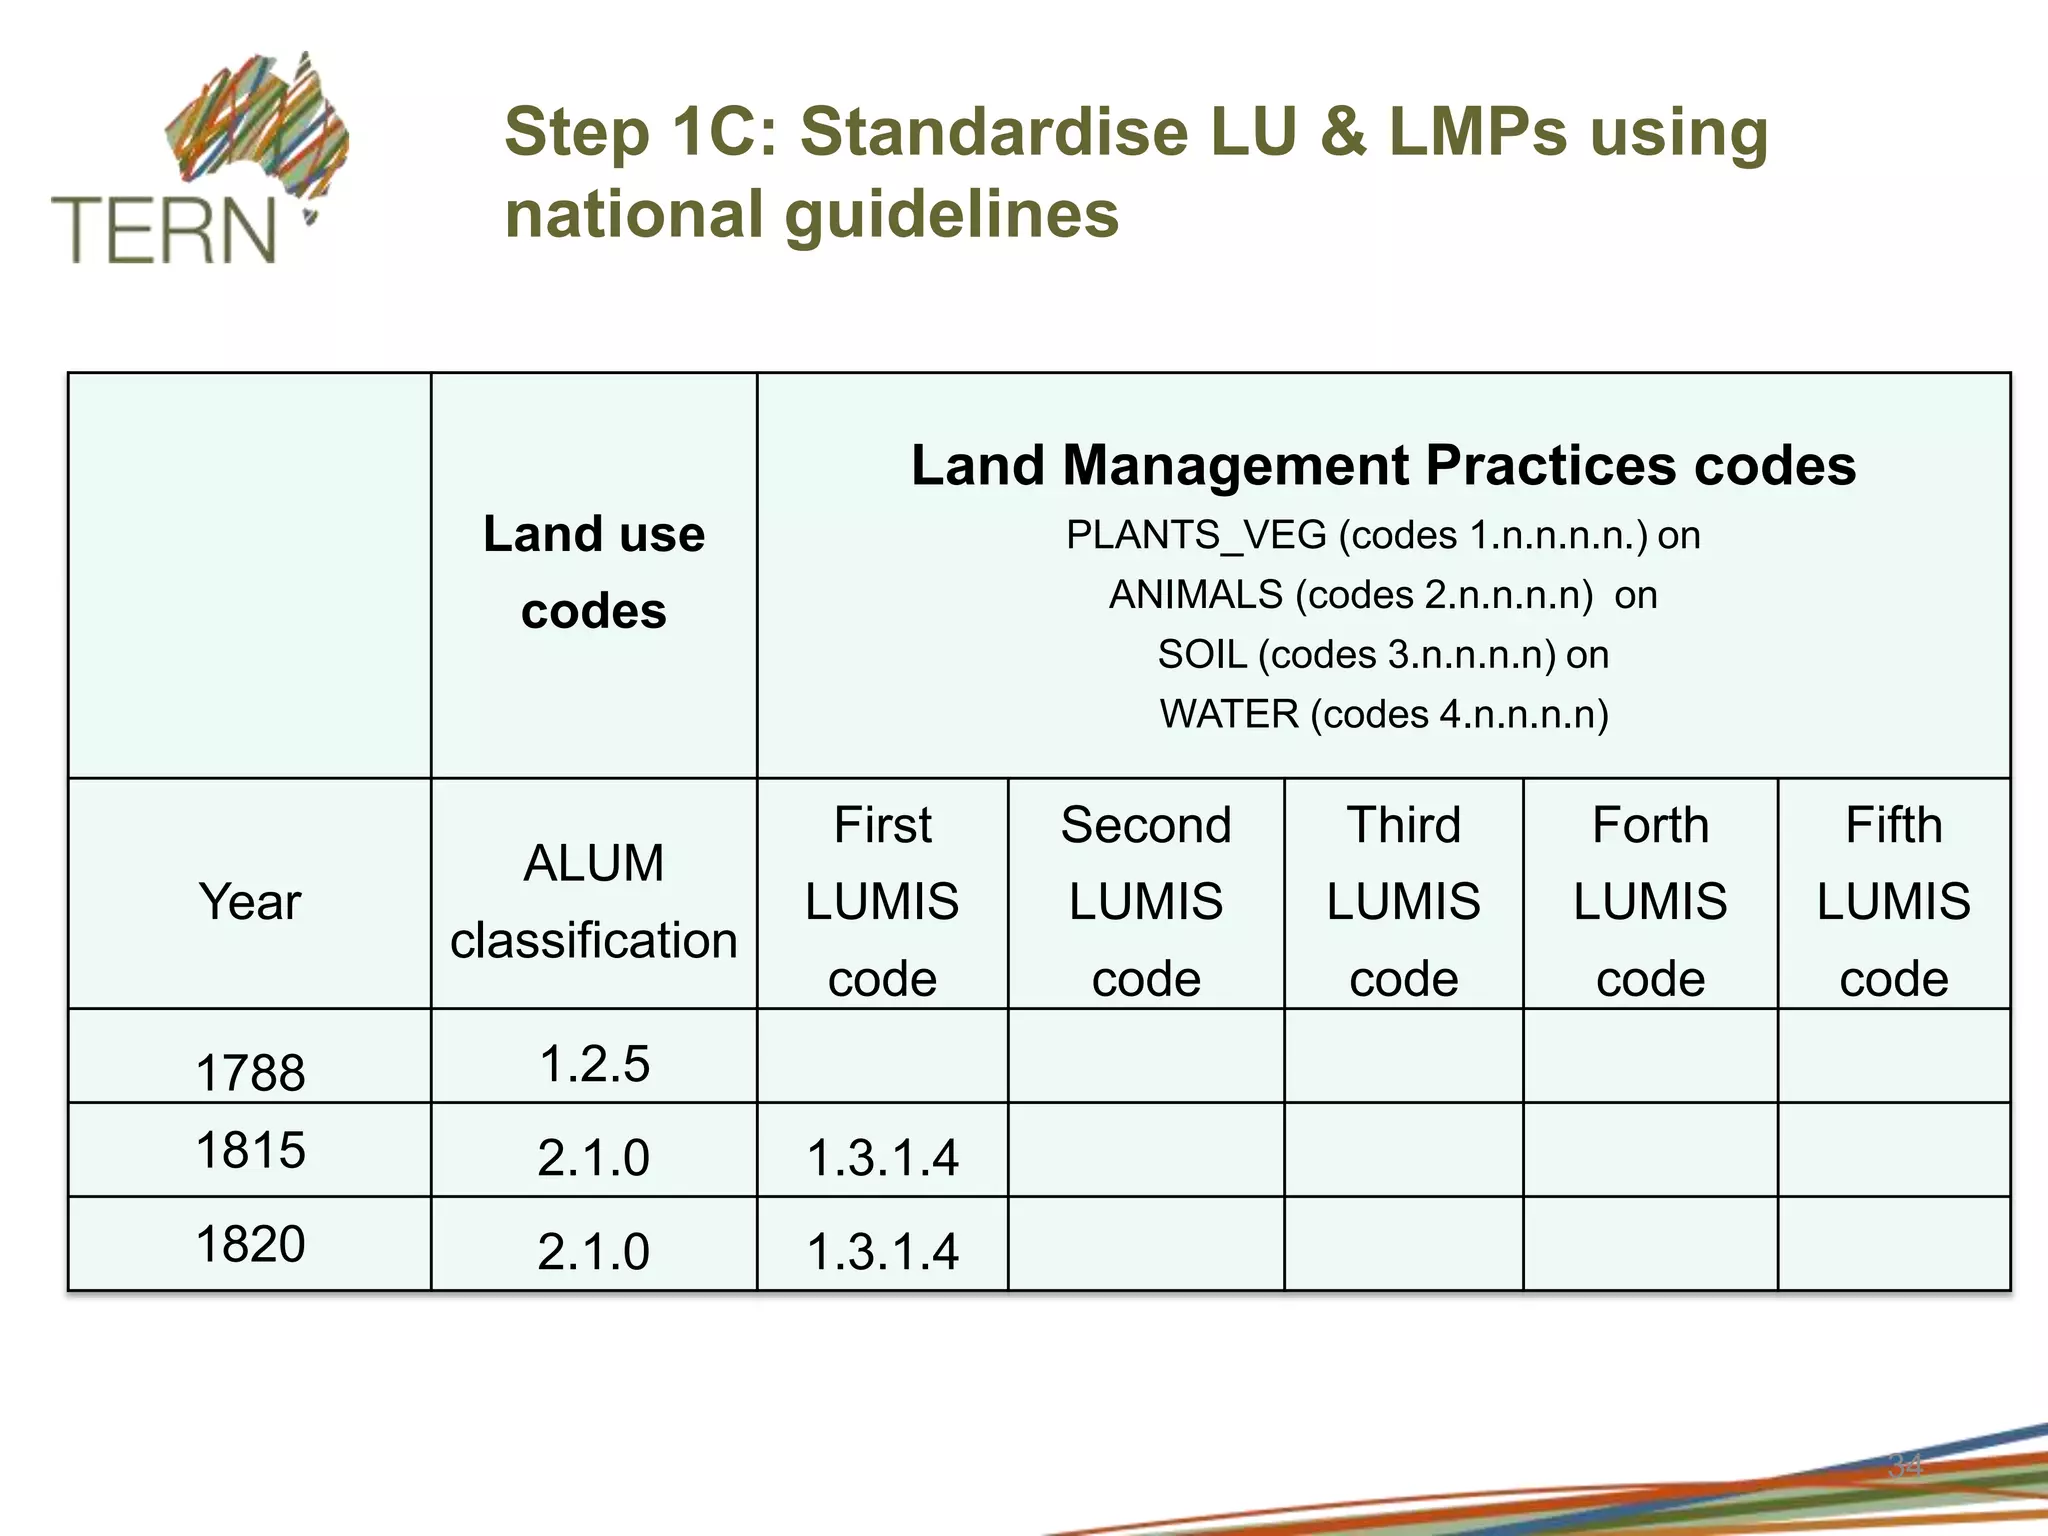
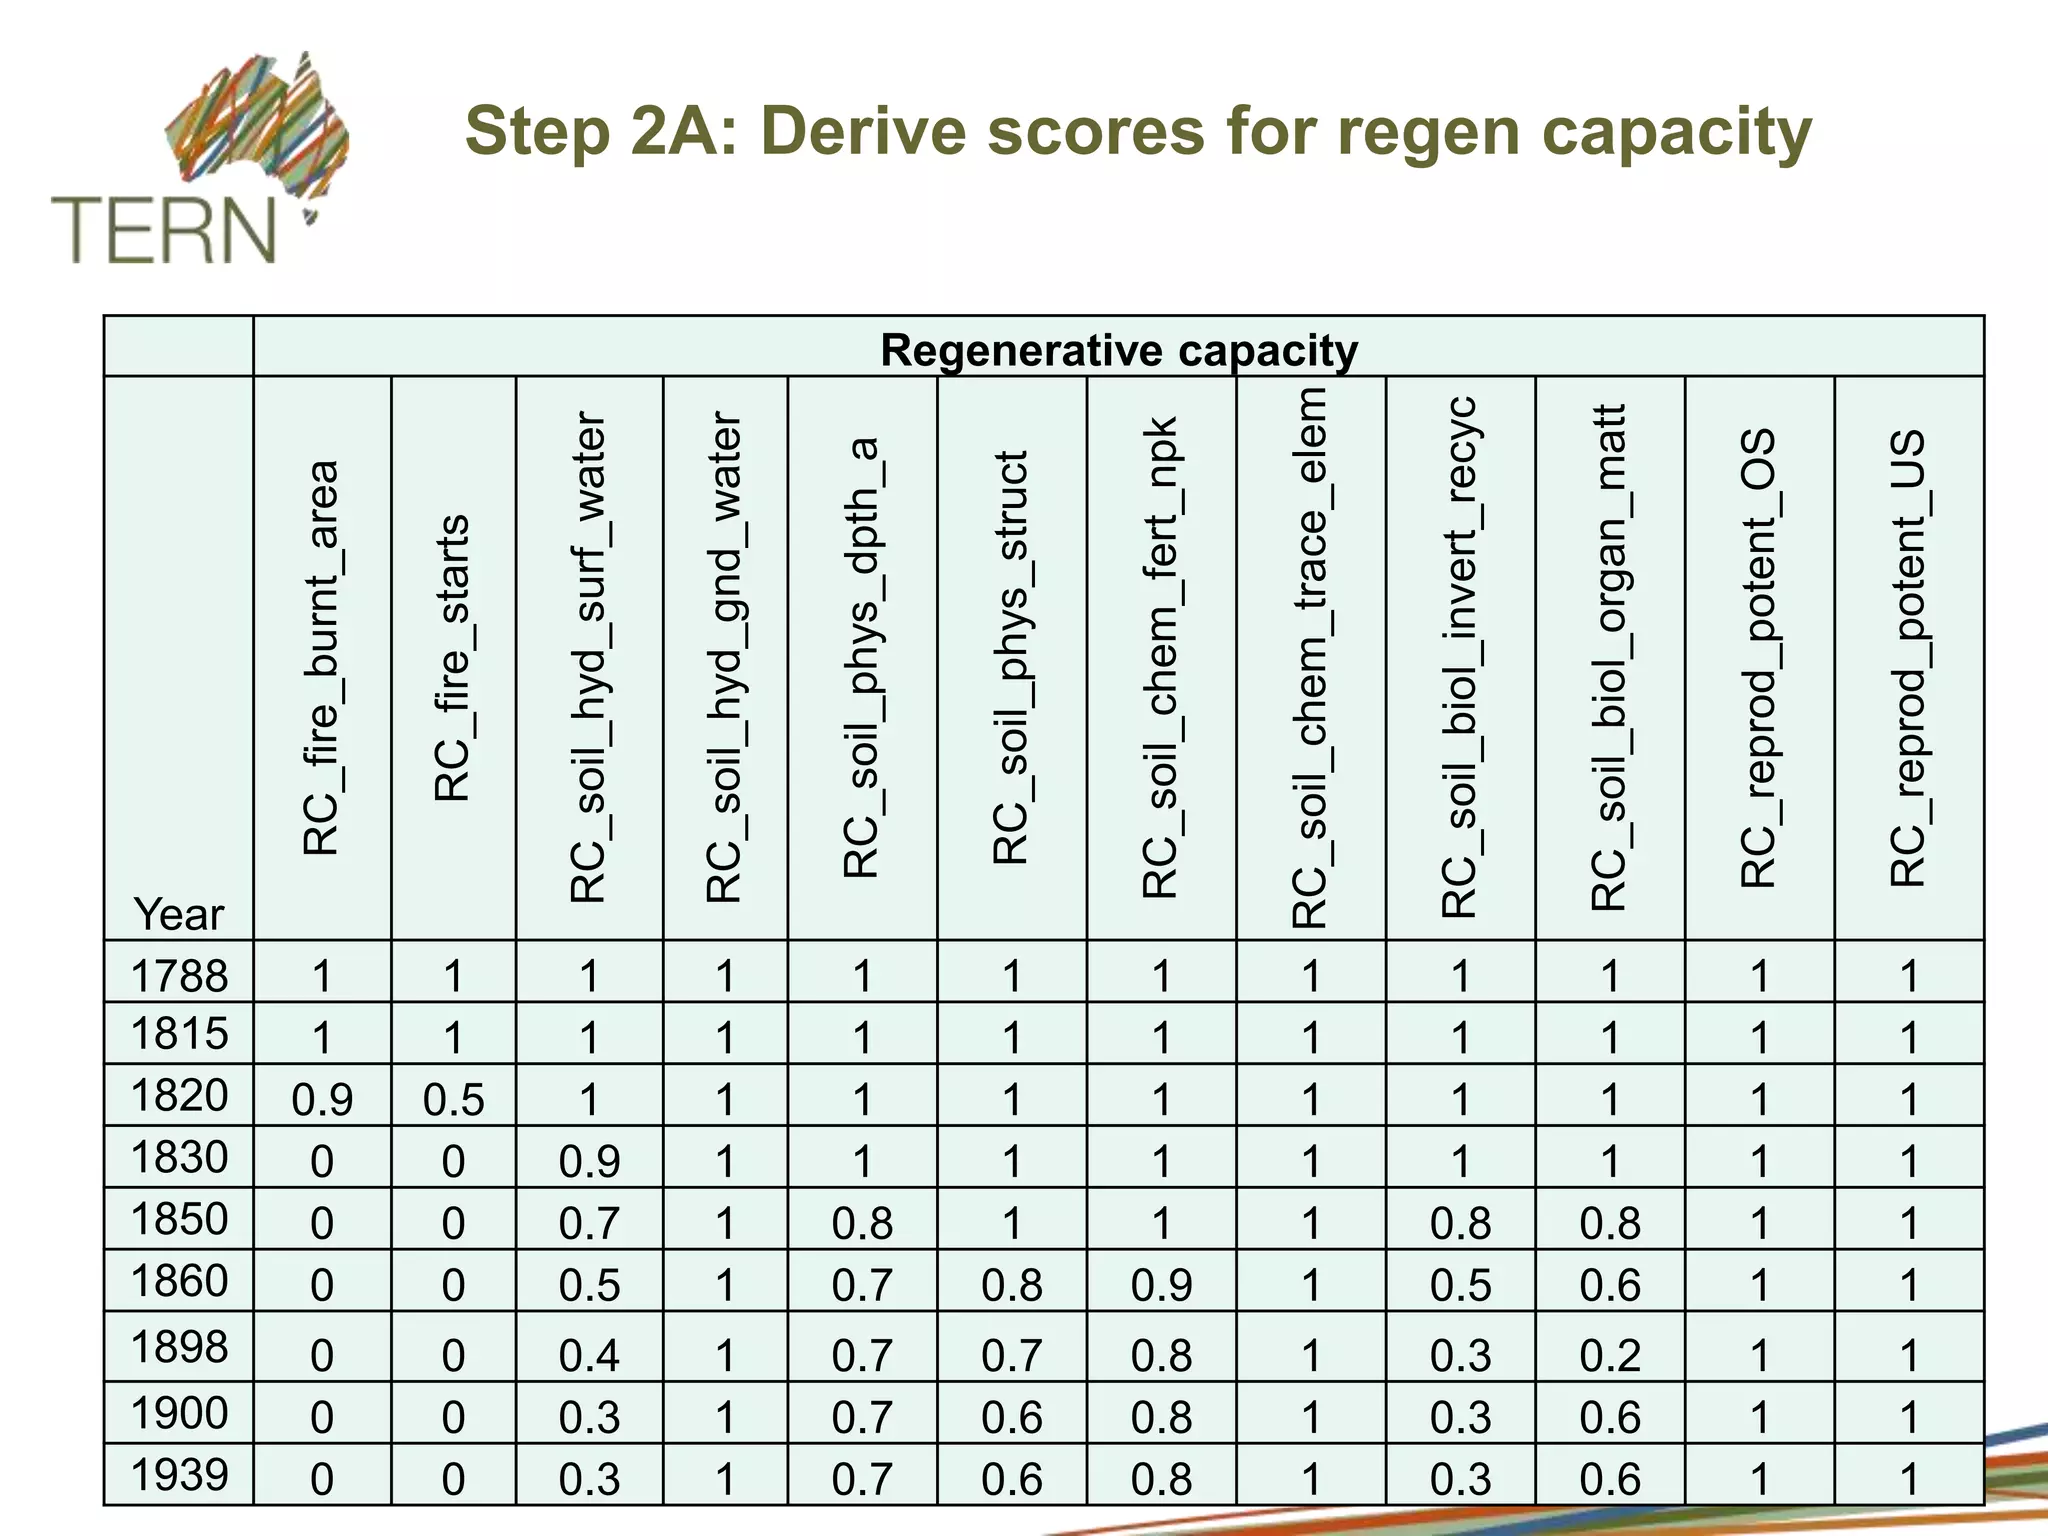
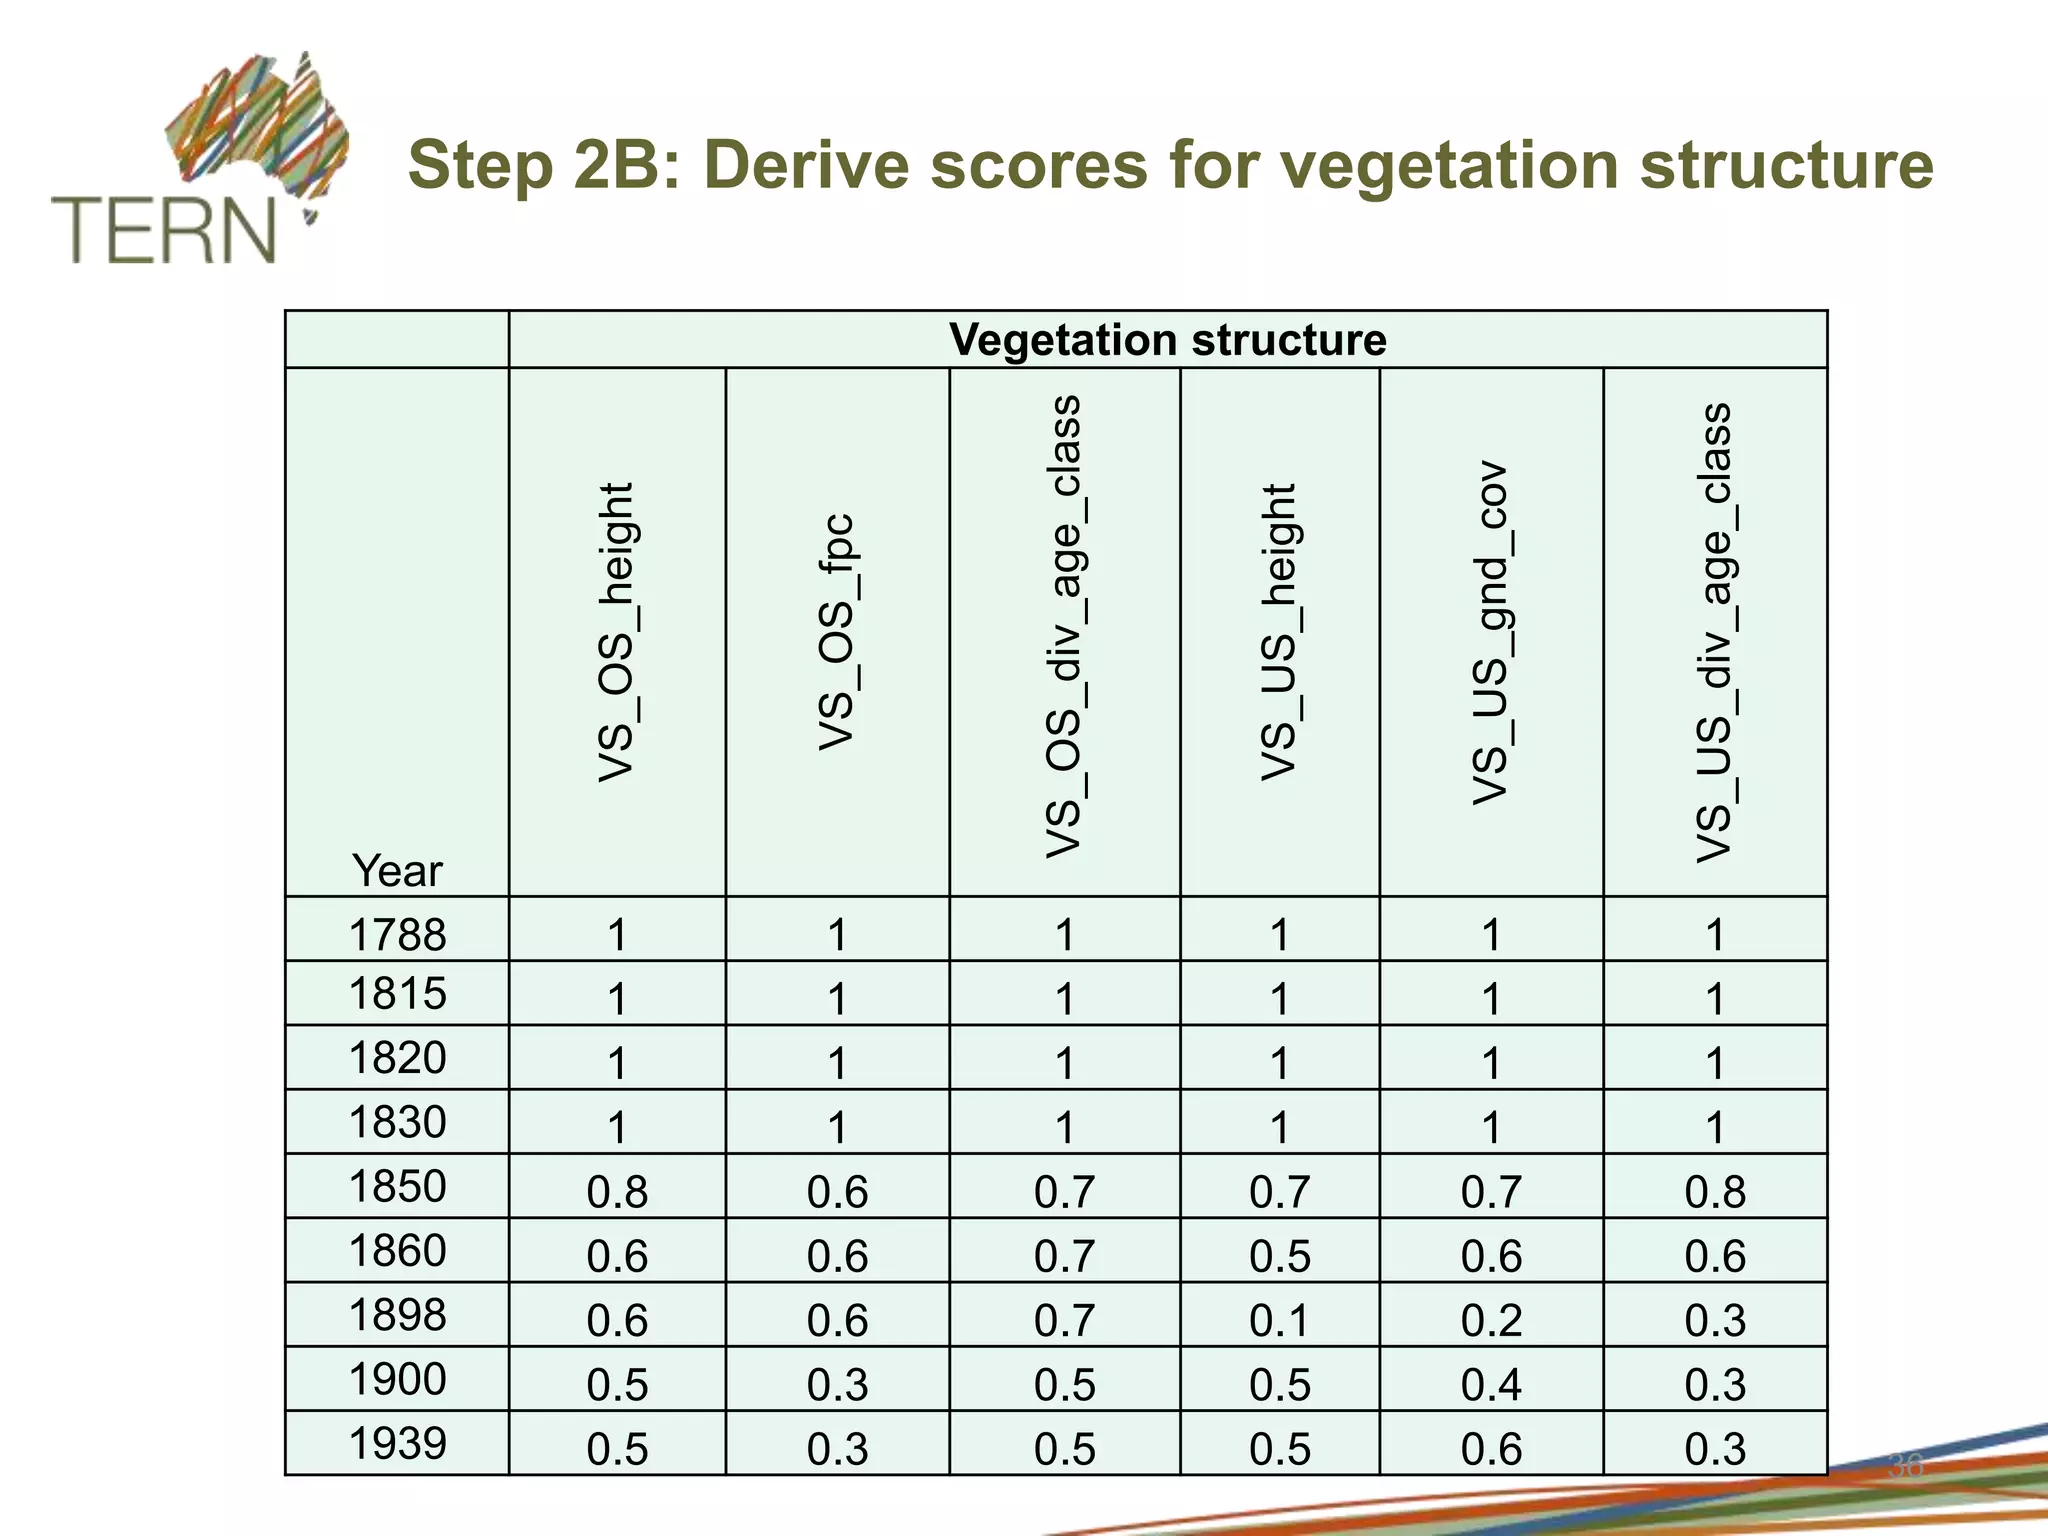
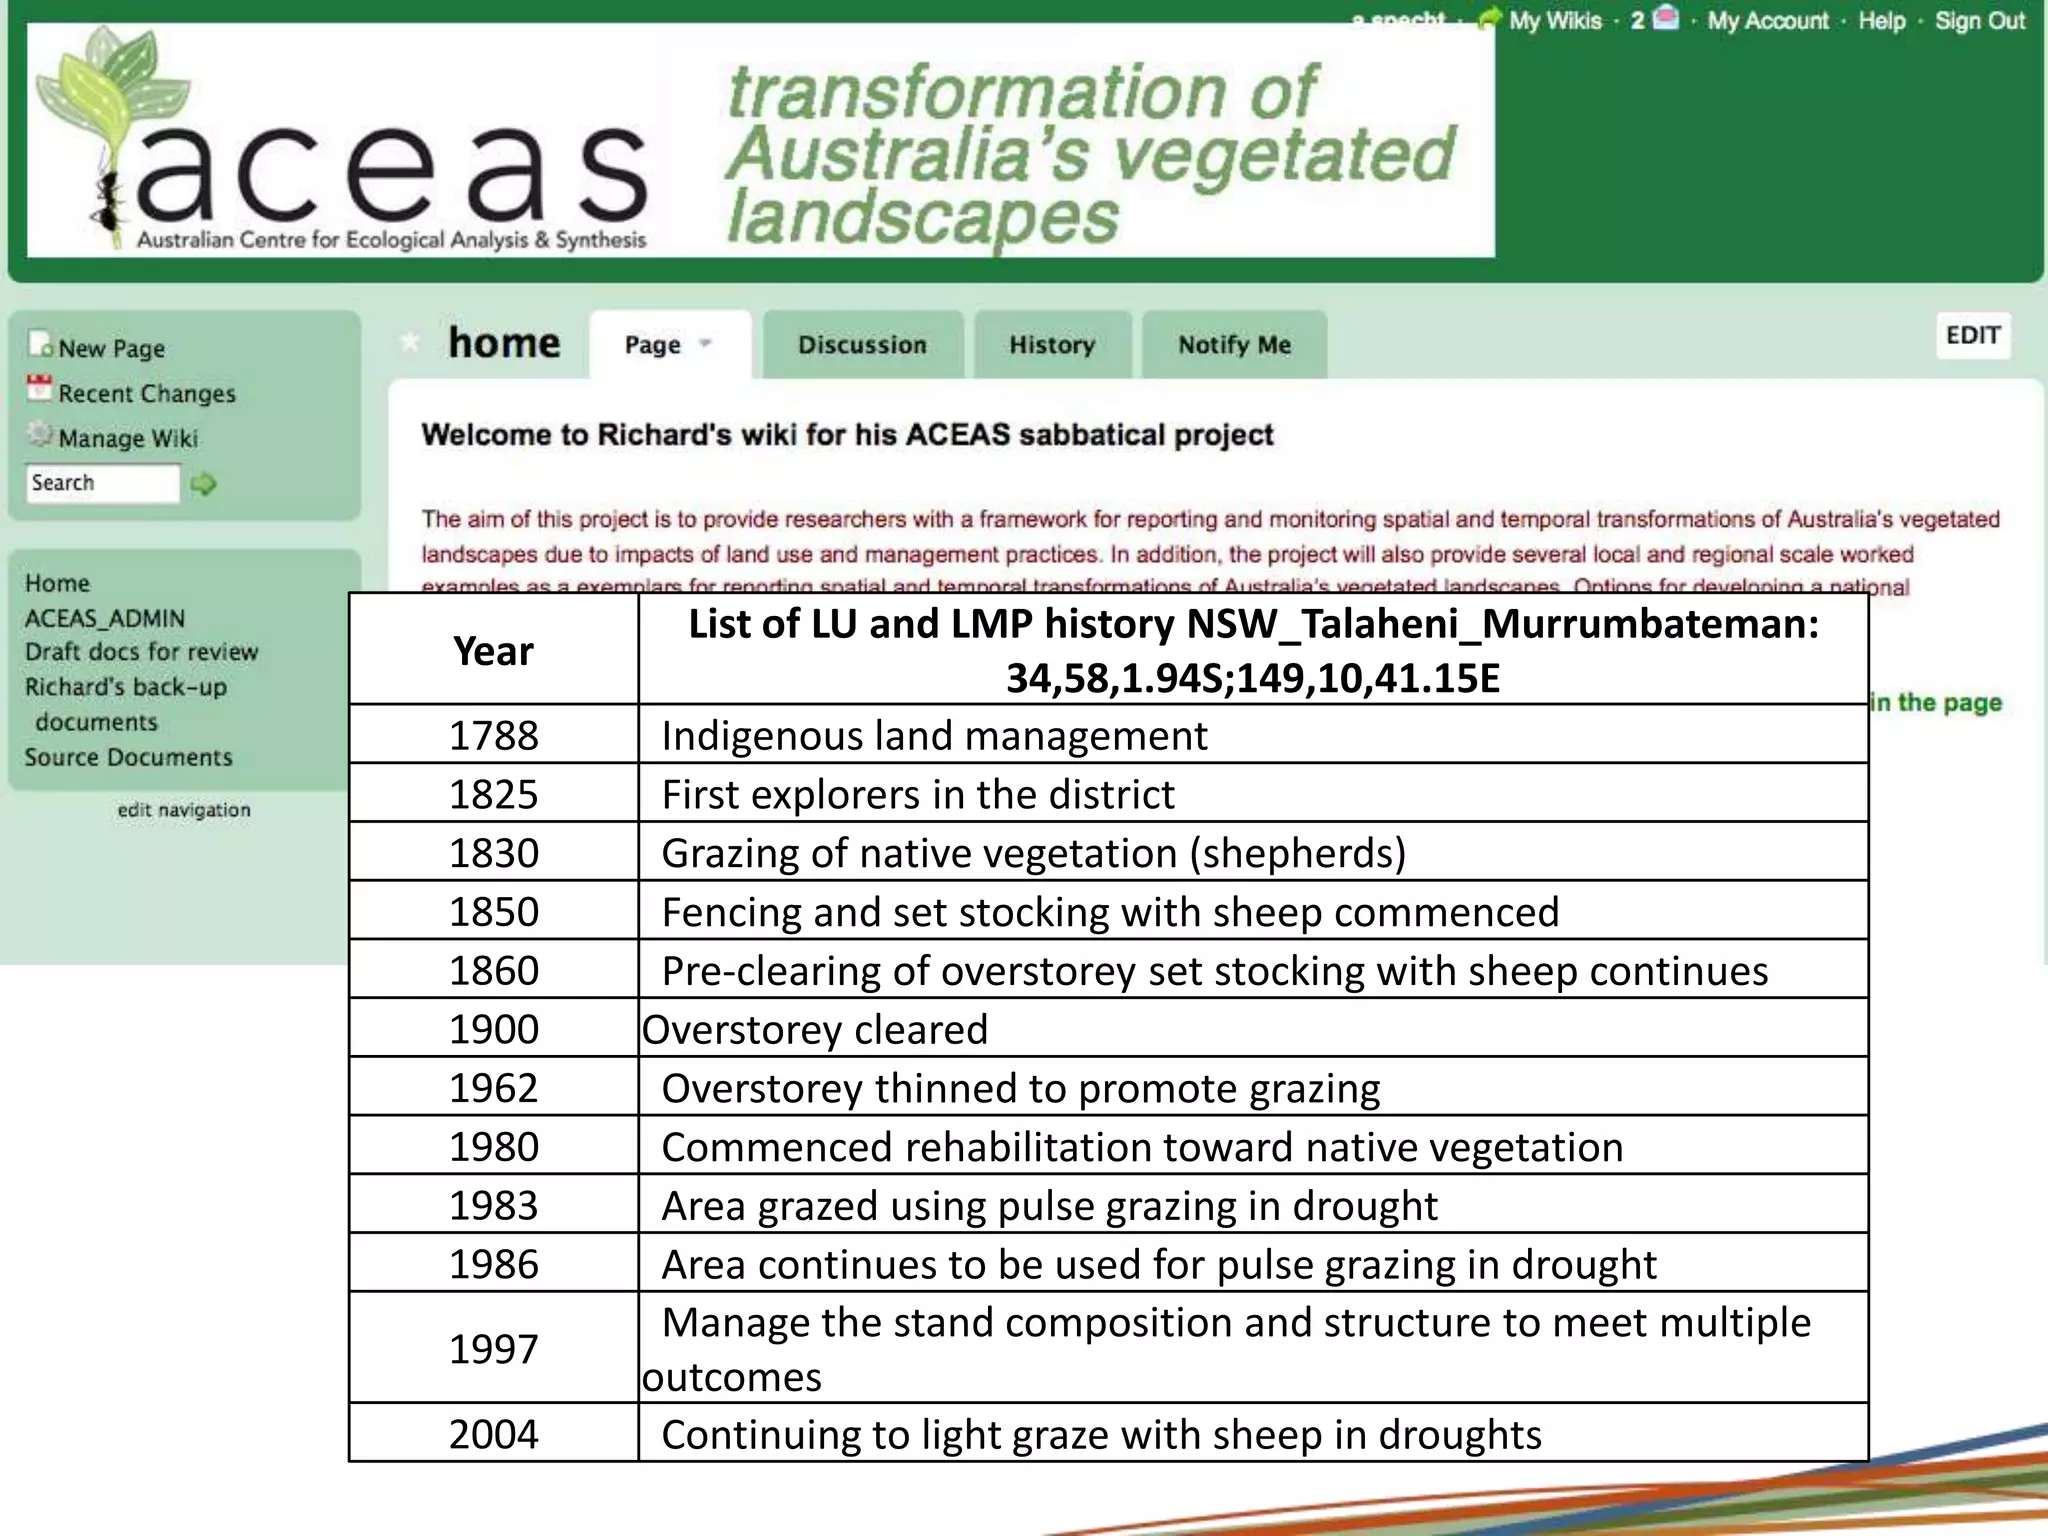
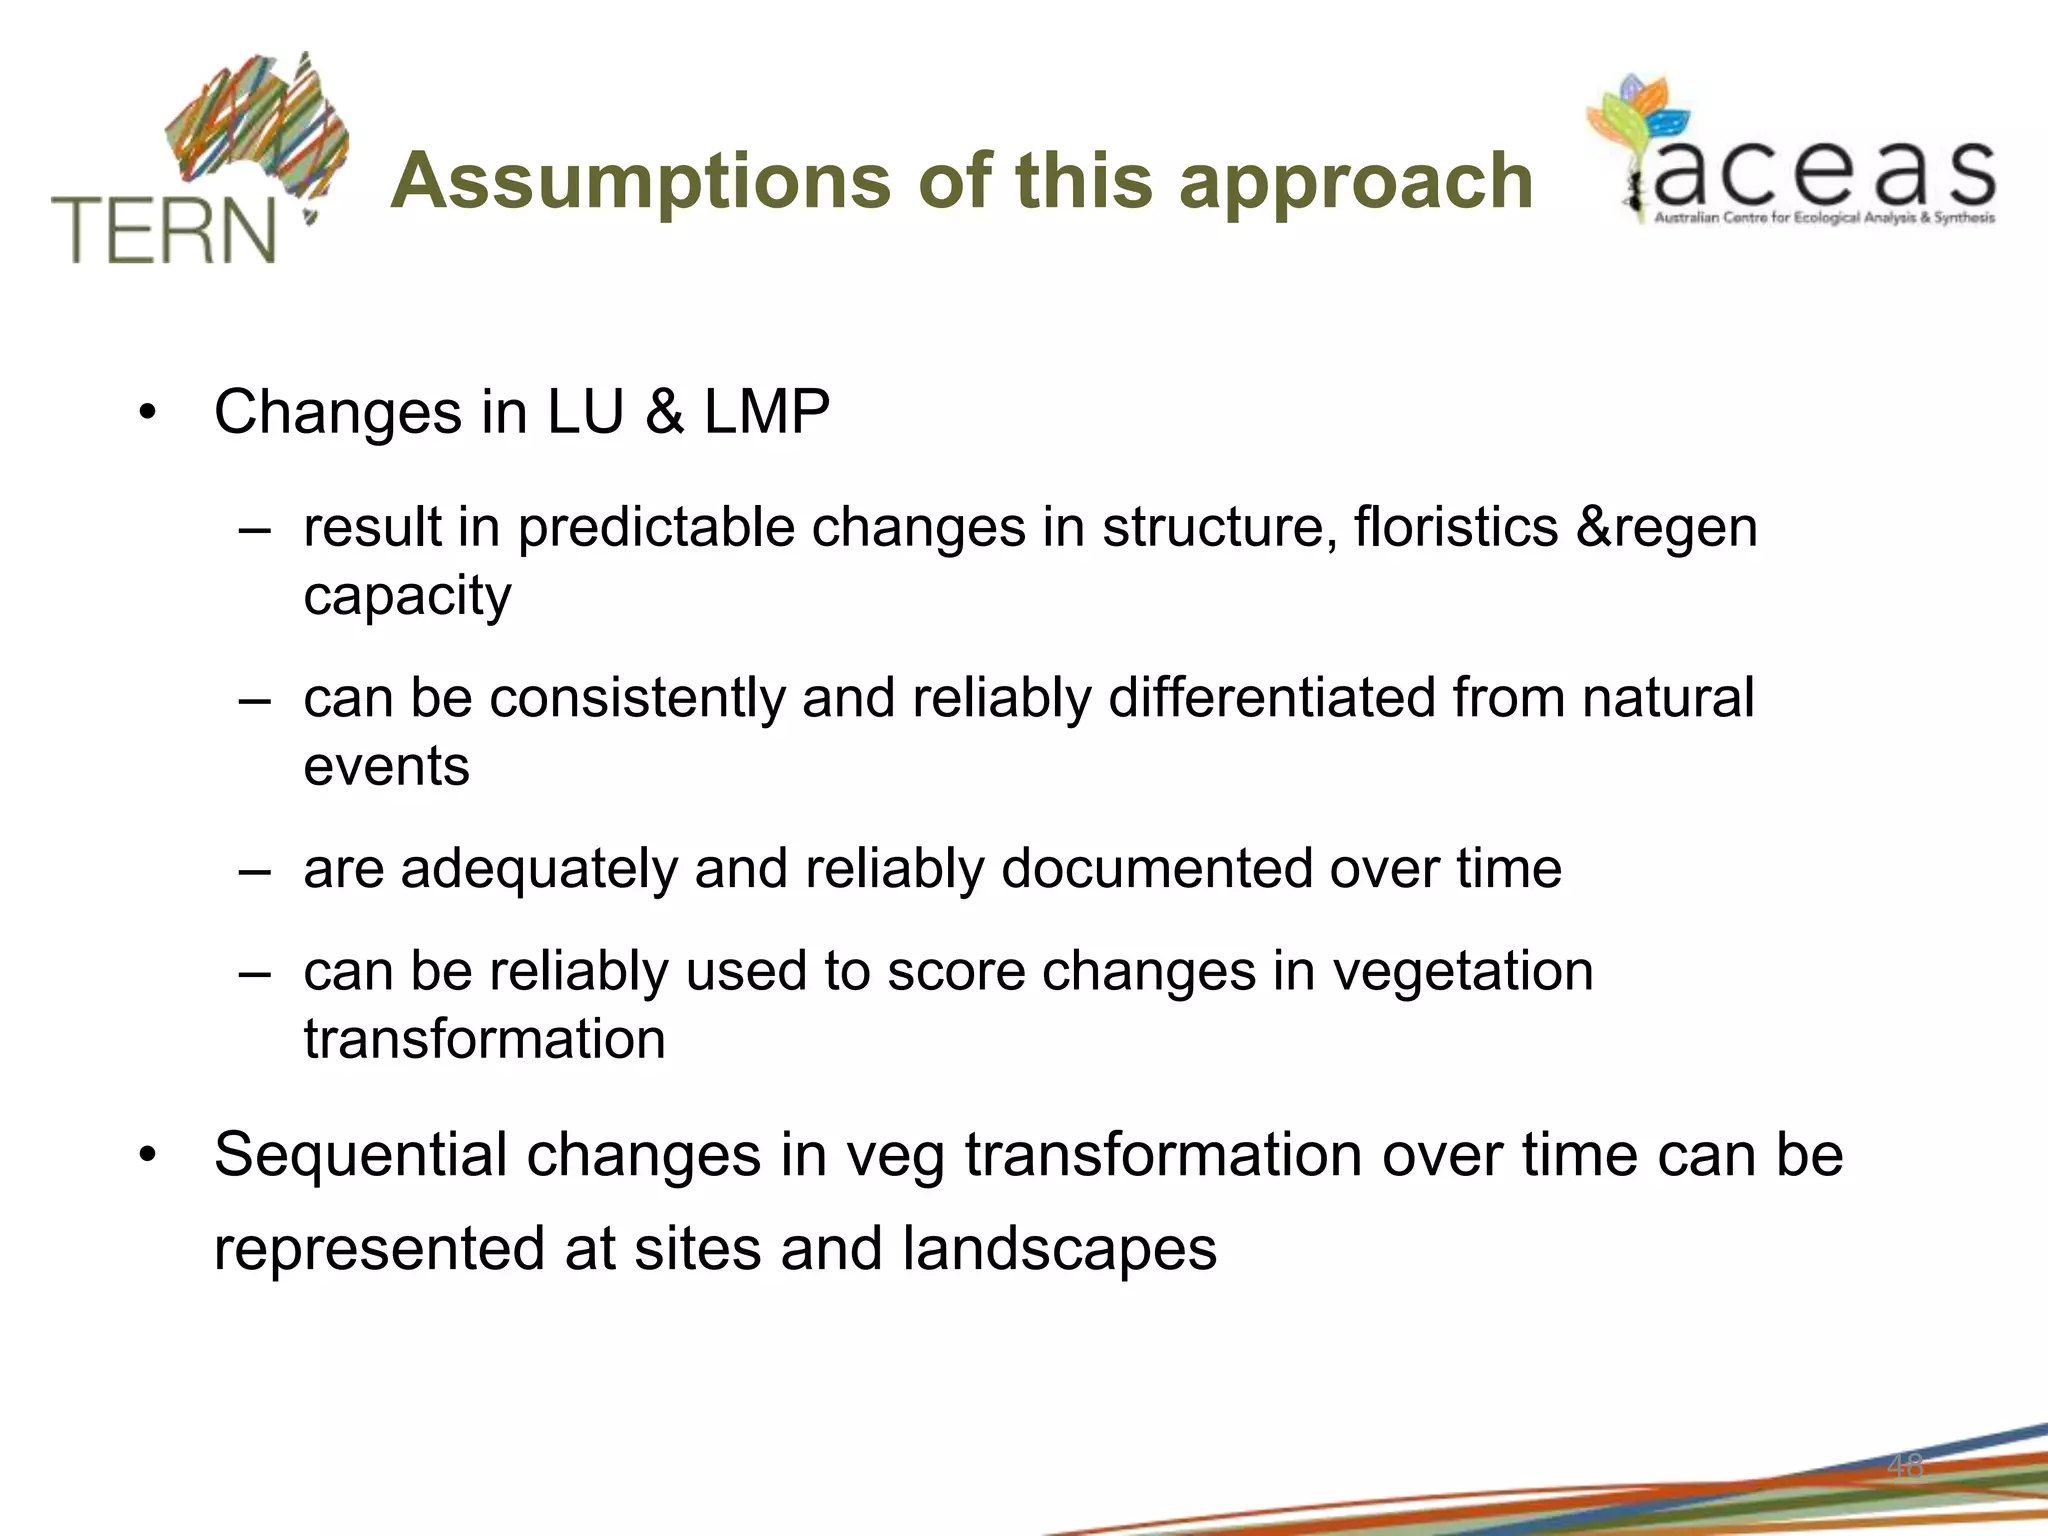
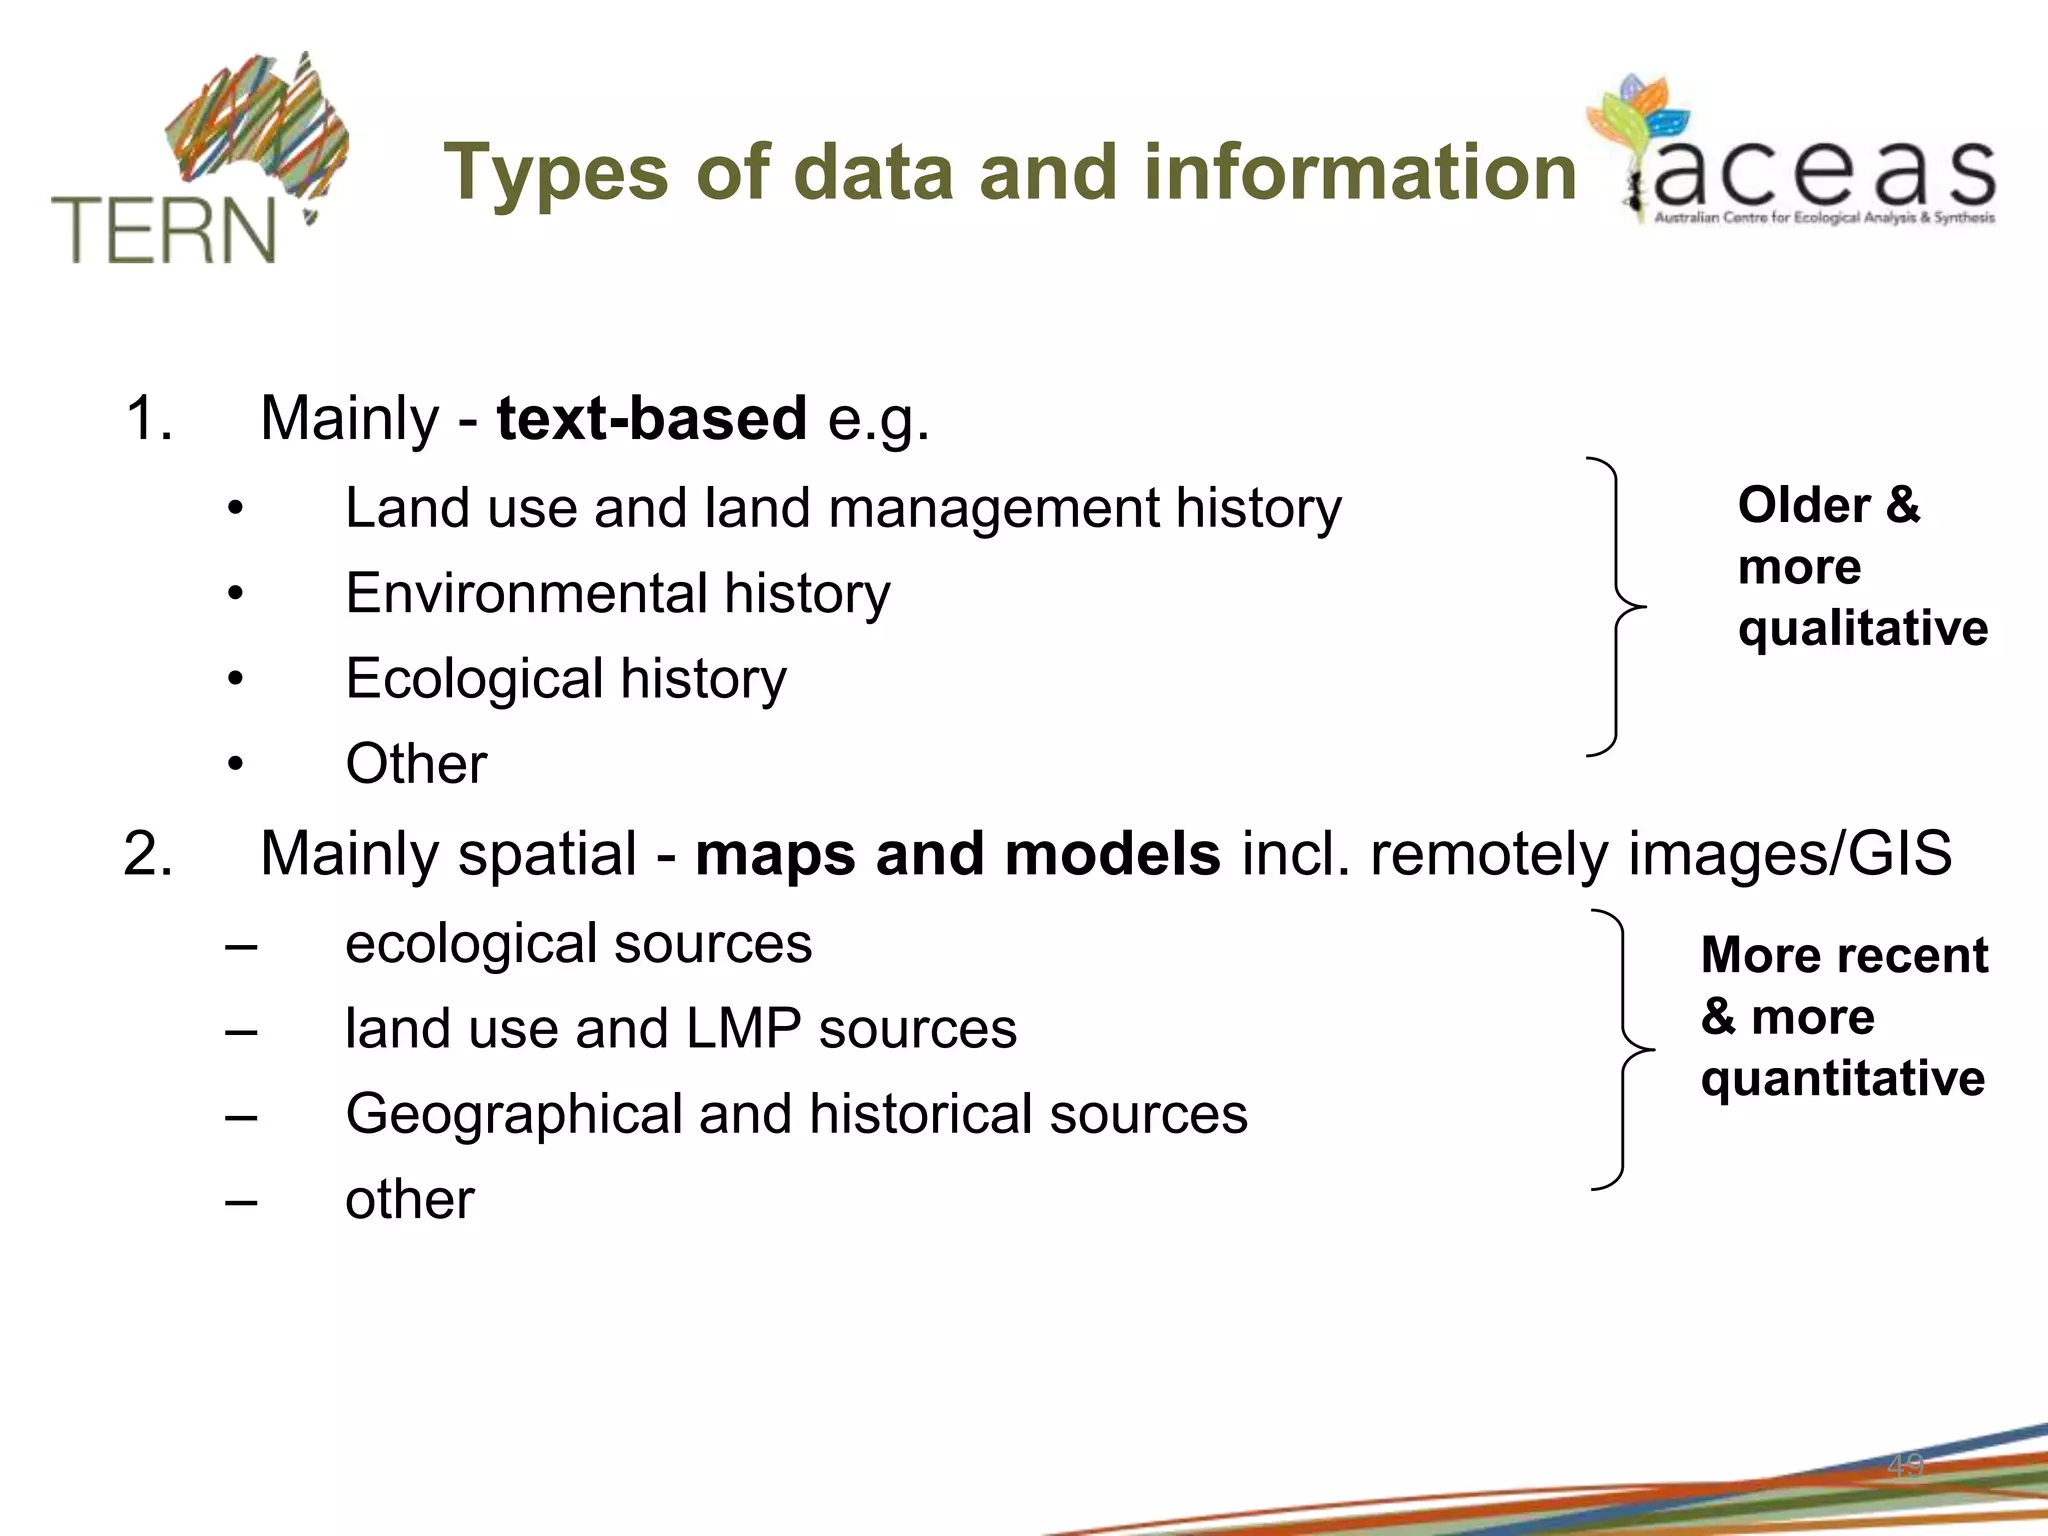
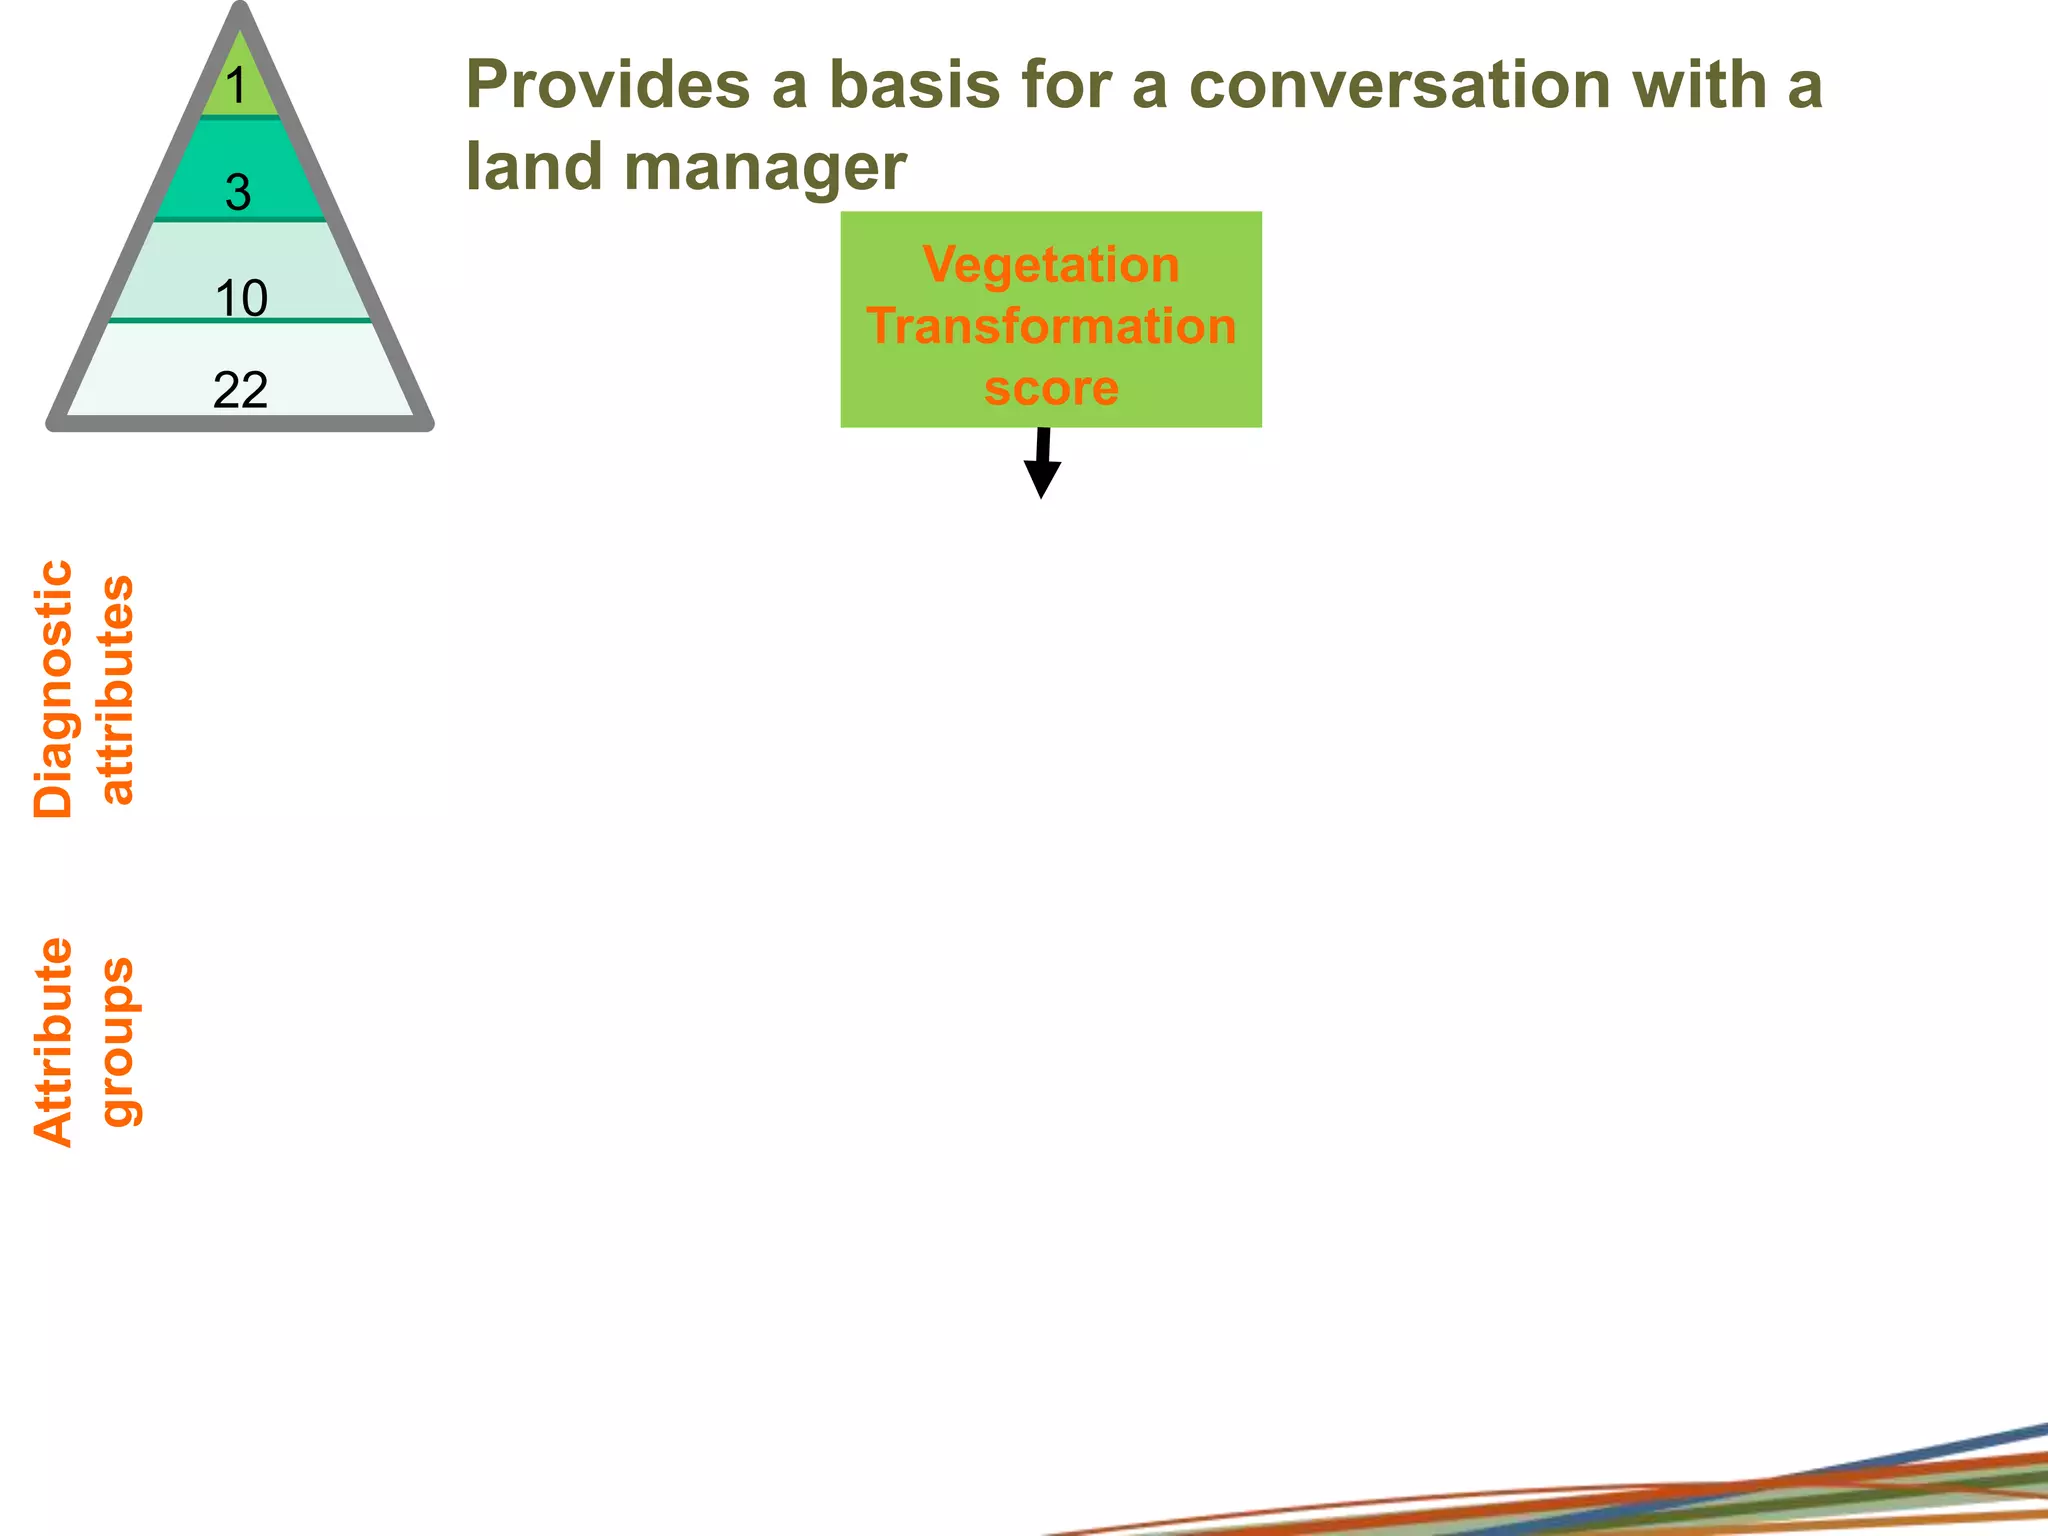
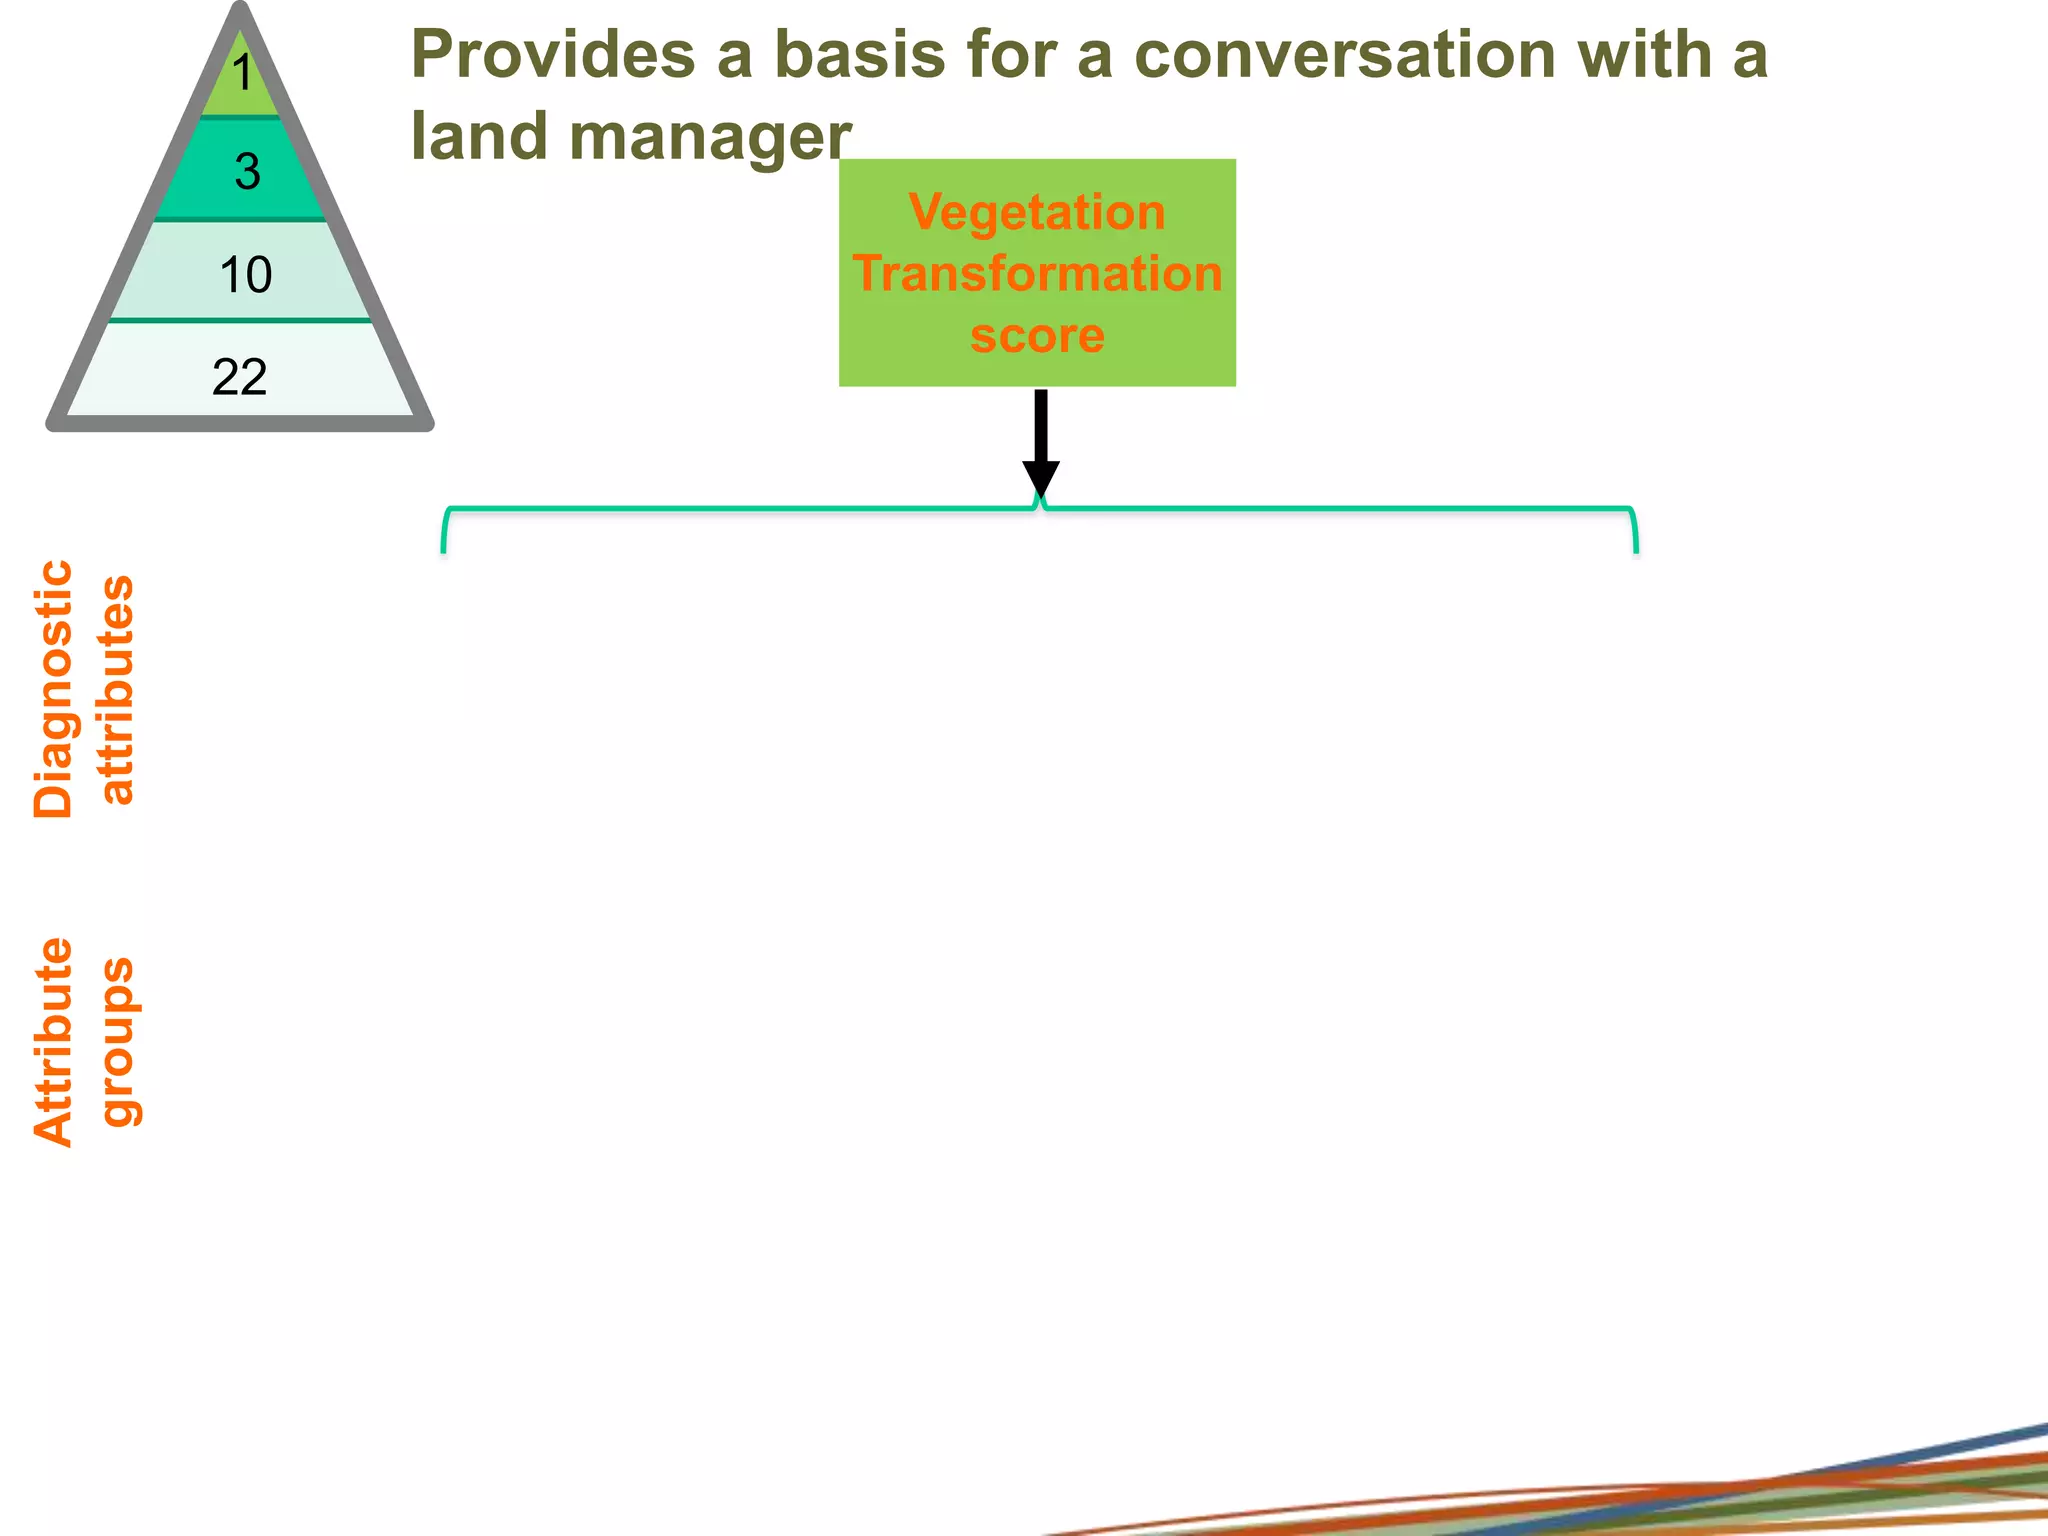
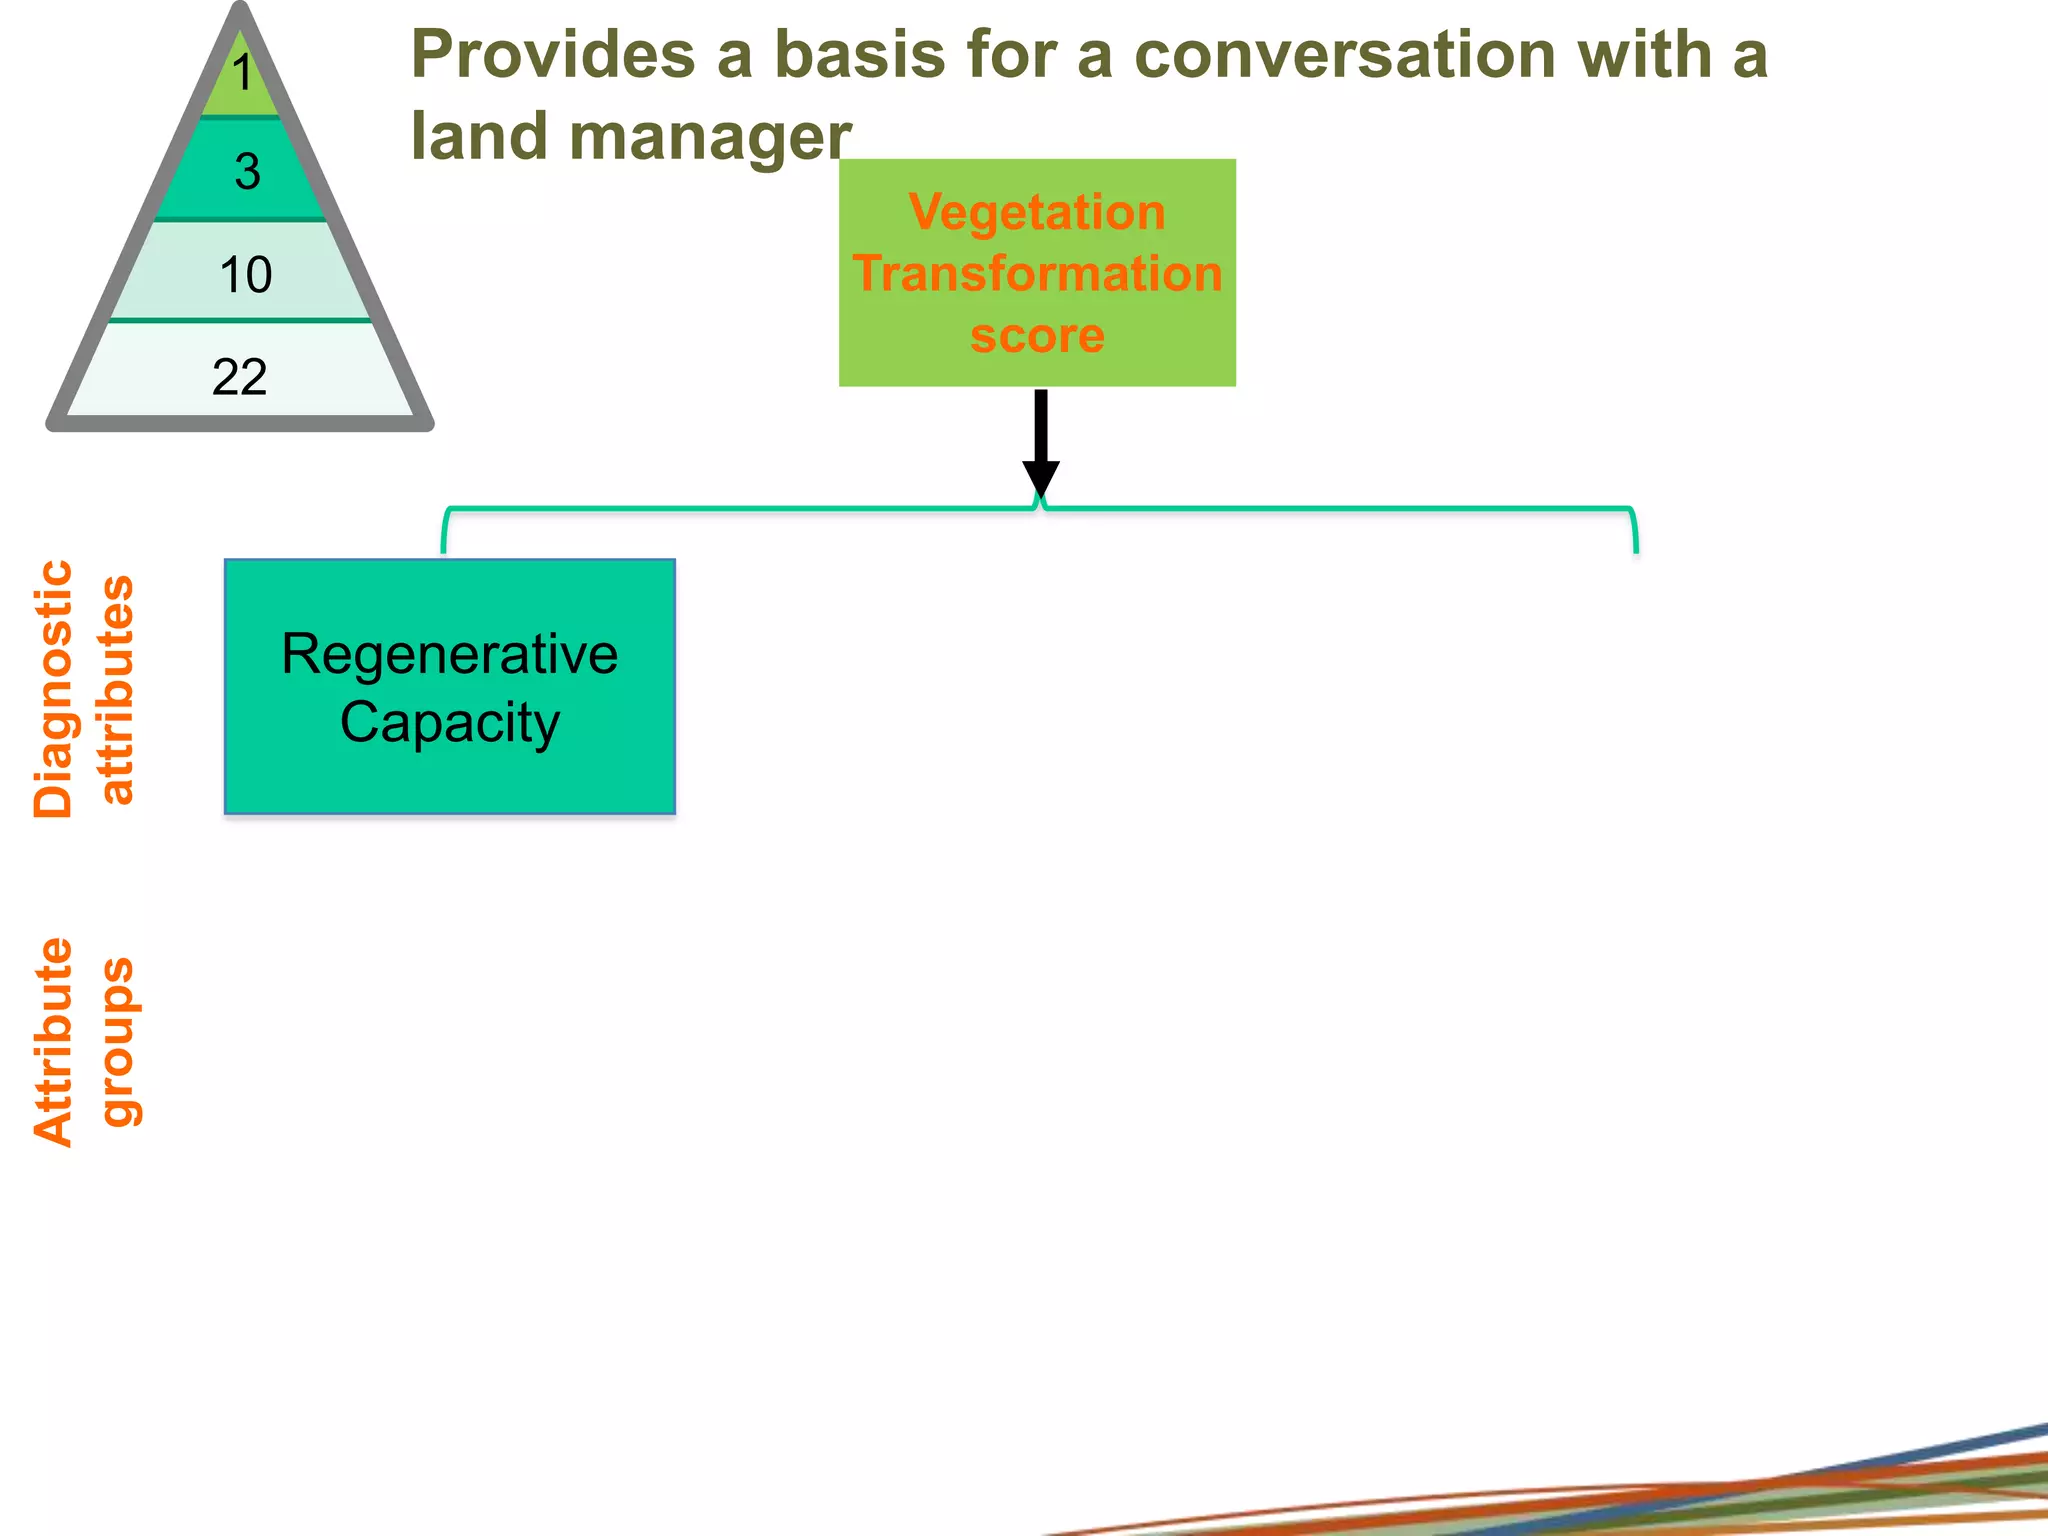
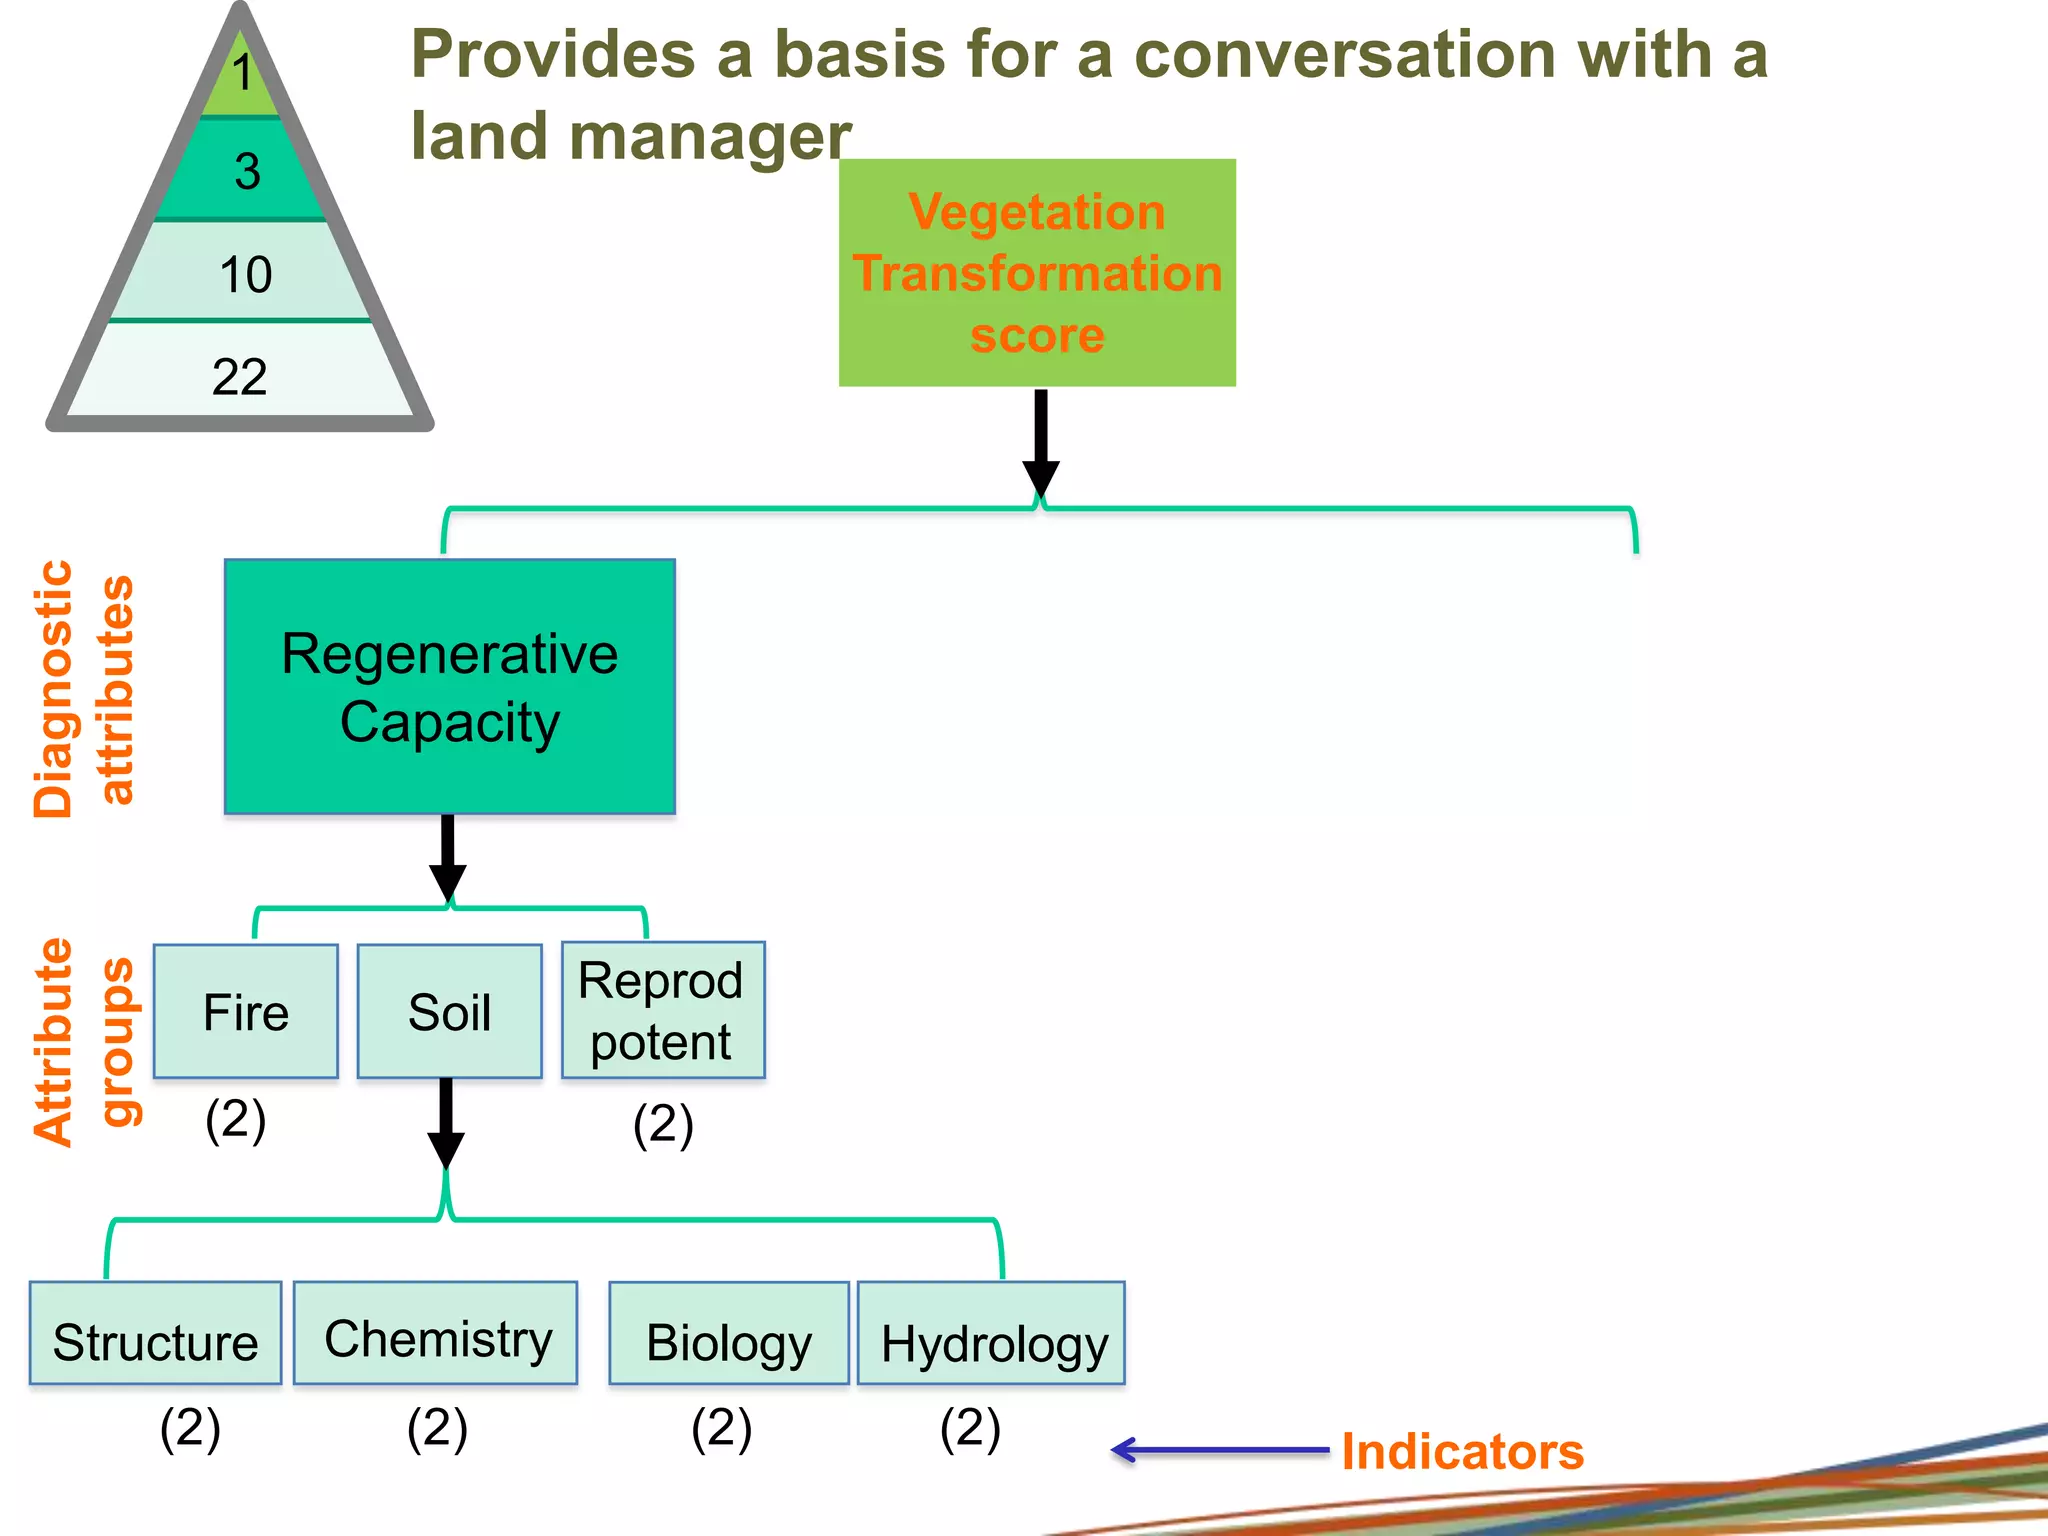
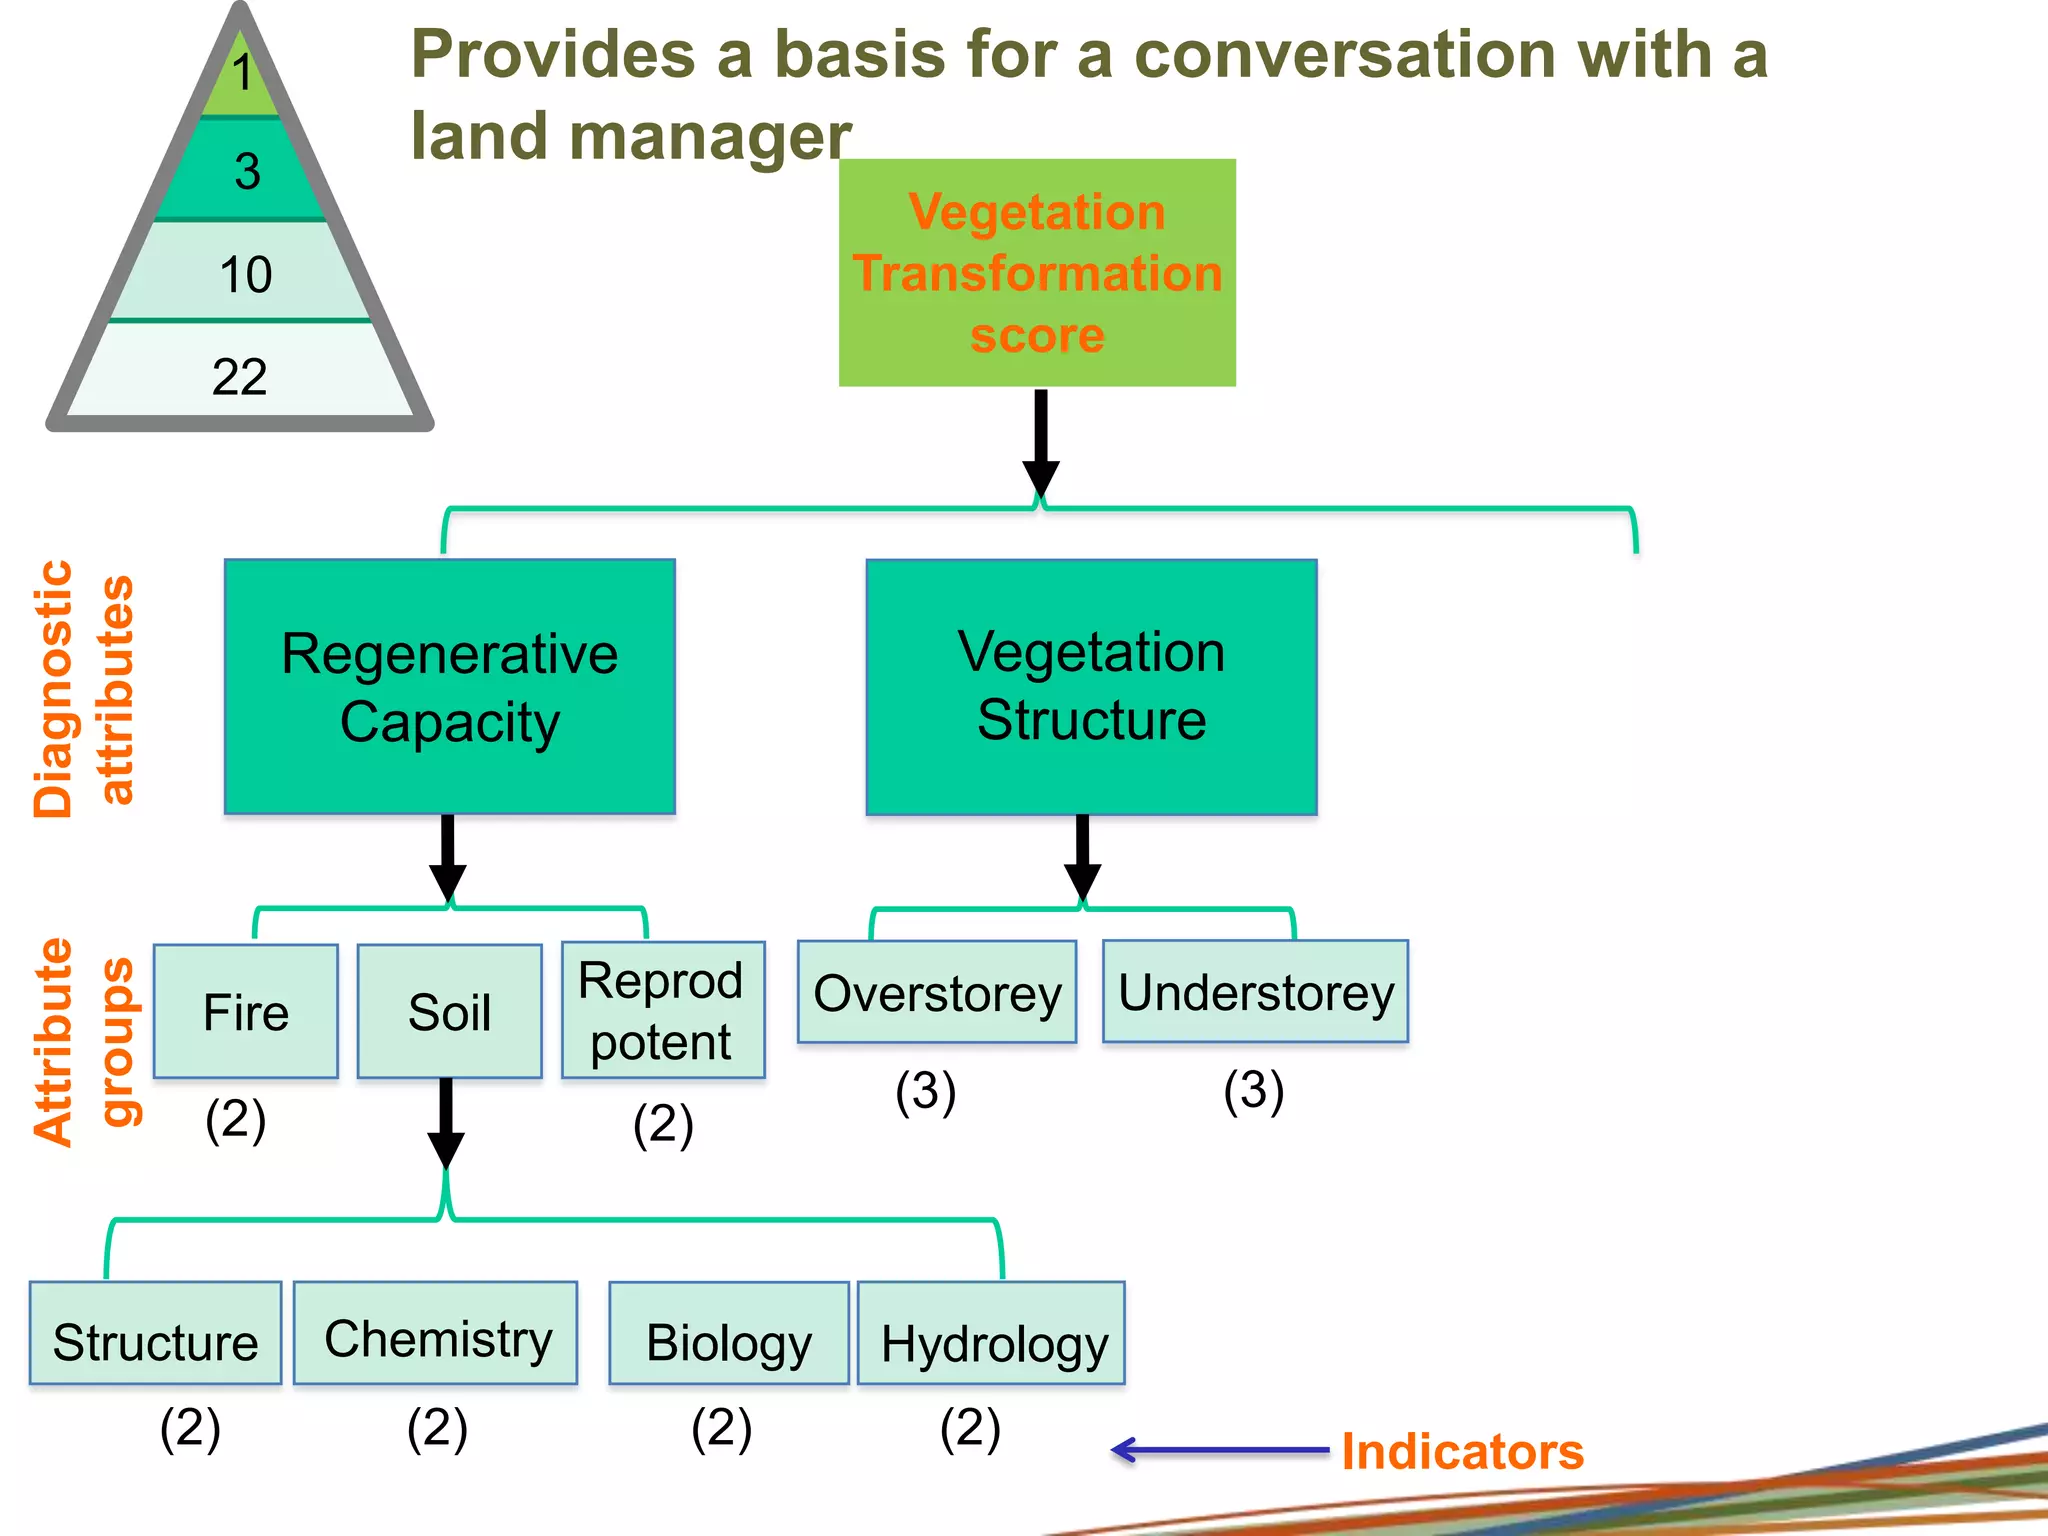
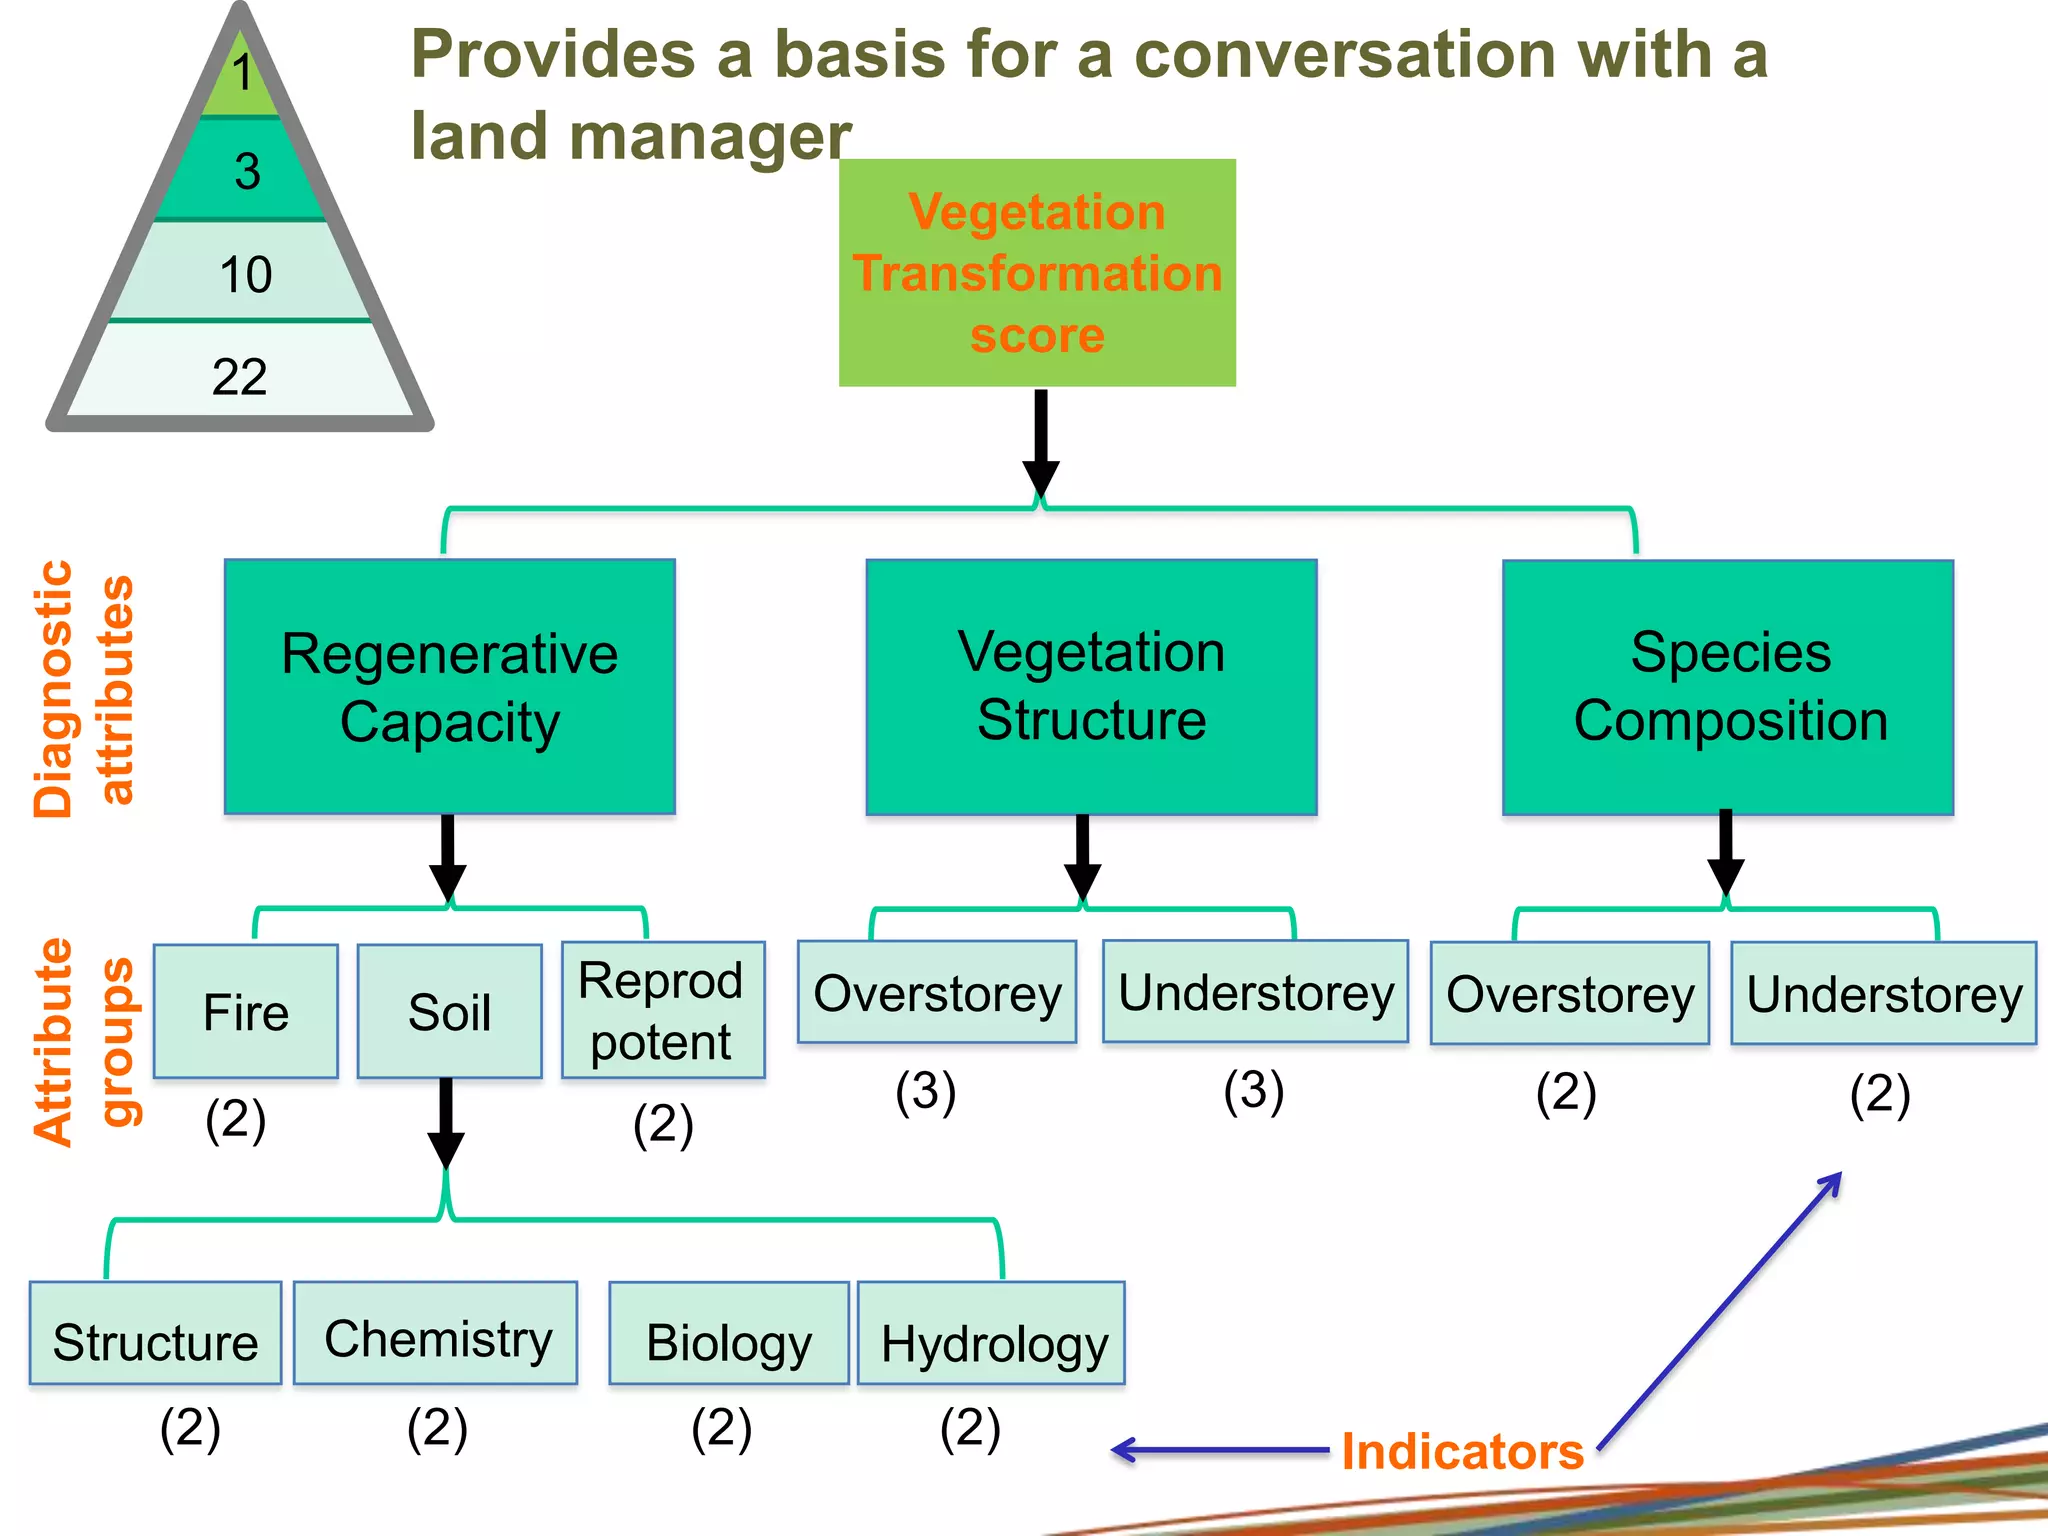
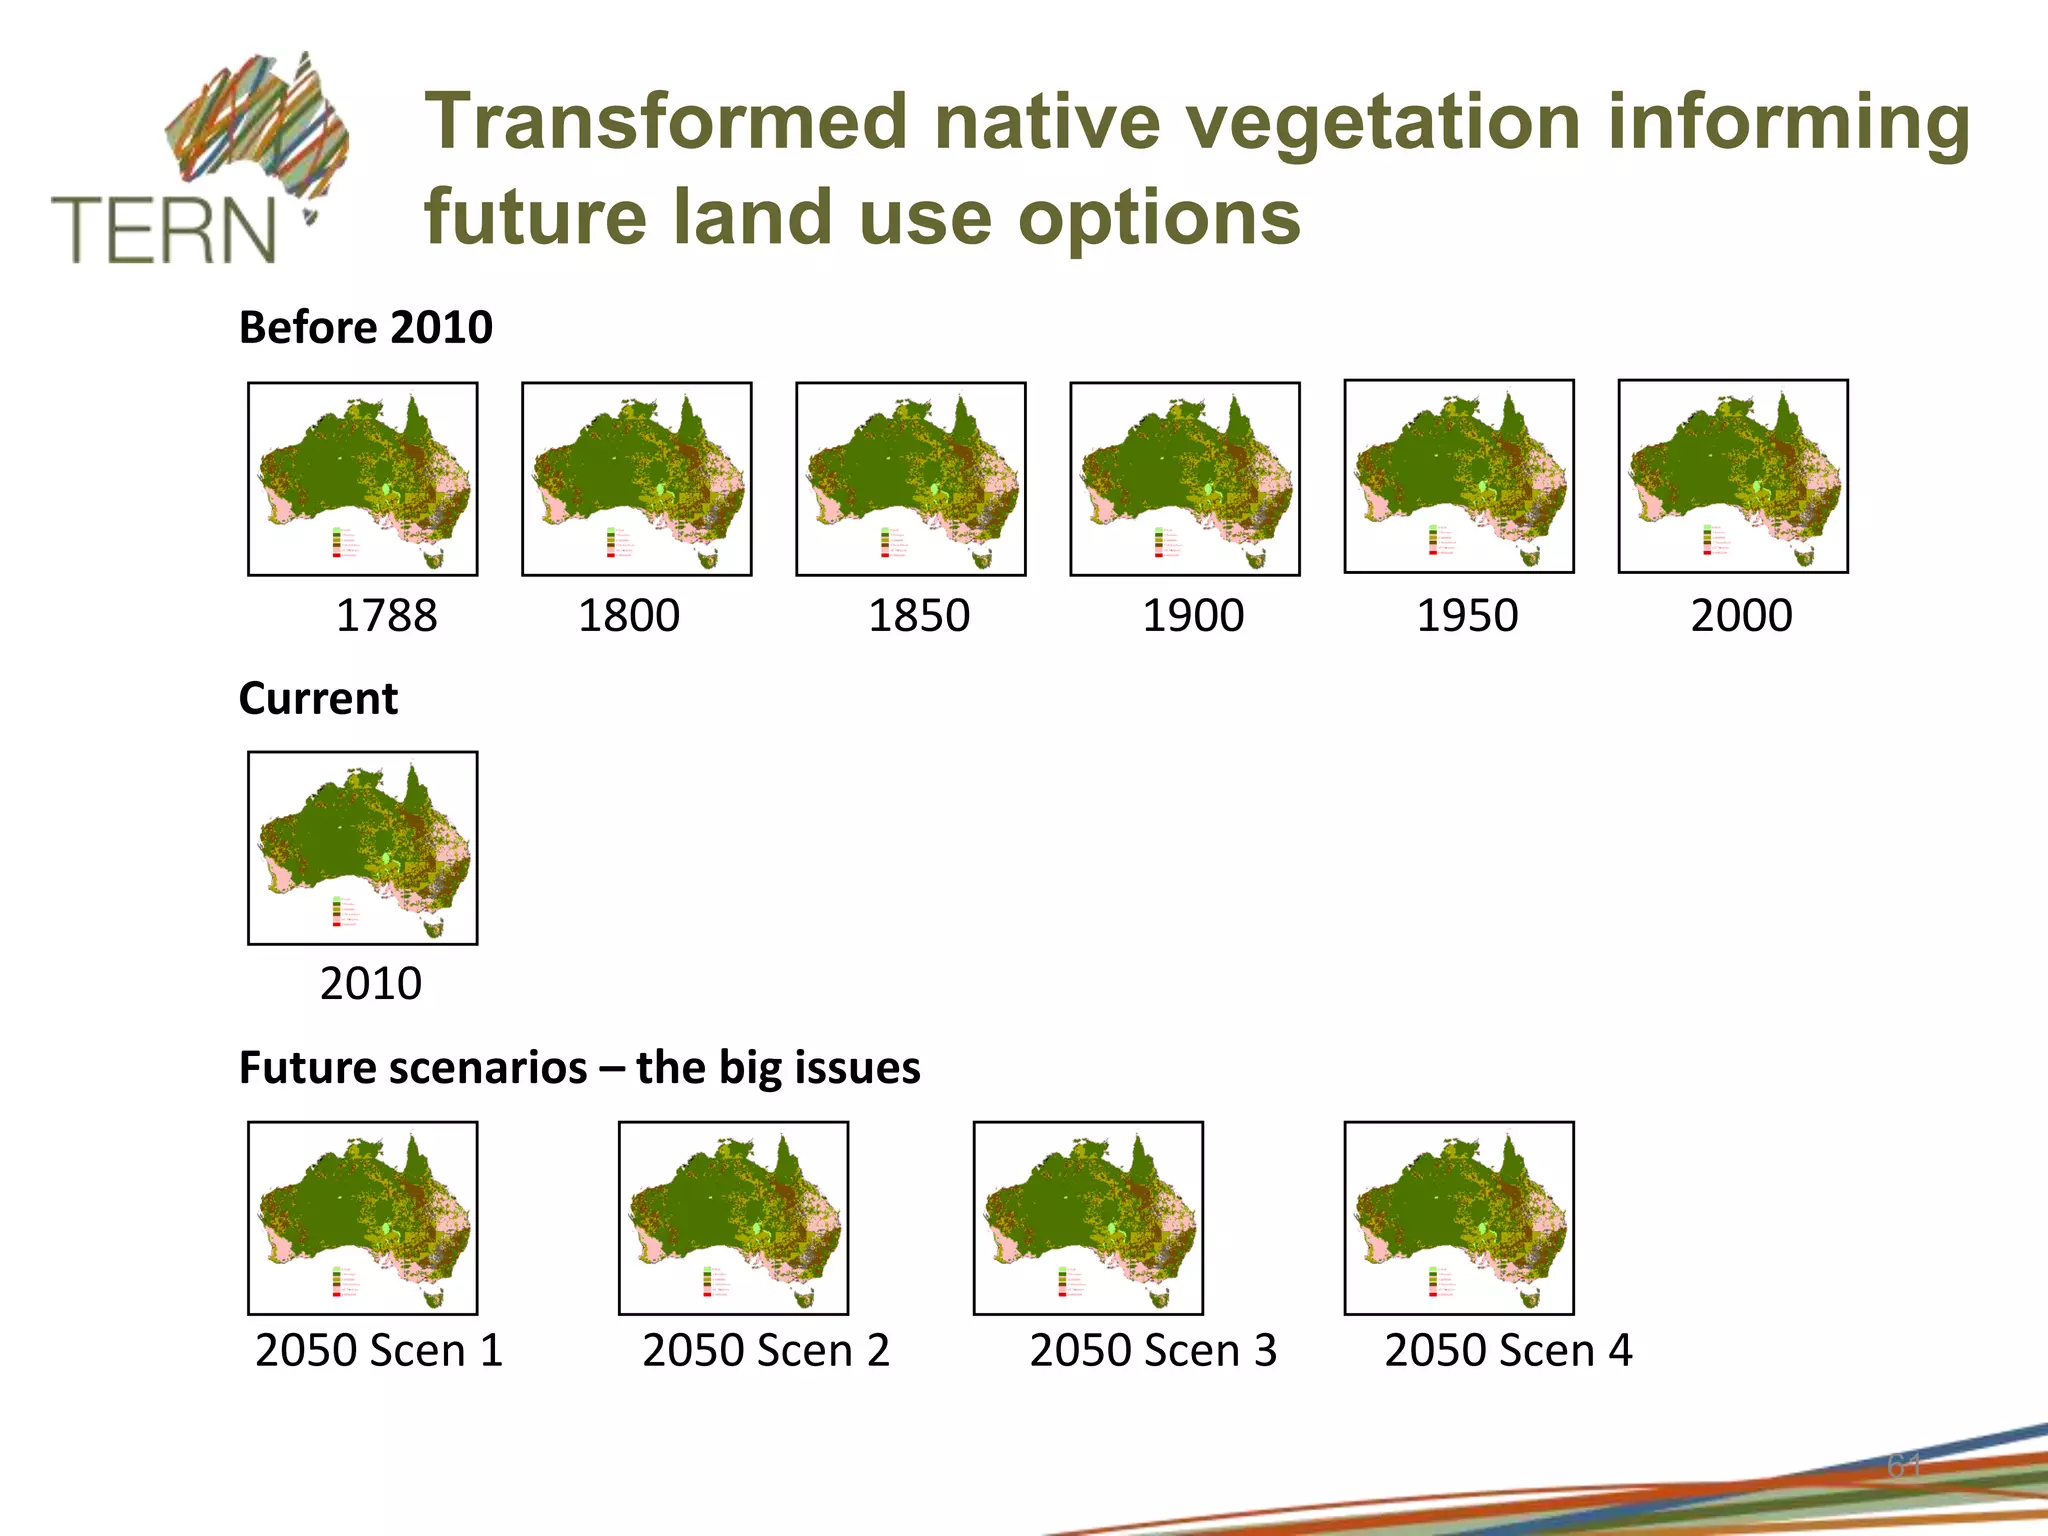

1) The document outlines a method for documenting longitudinal site histories of land use and land management practices and scoring the responses of native vegetation communities over time. 2) A case study applying this method examines the transformation of open grassy woodlands in New South Wales through compiling historical land use and disturbance records and scoring changes in vegetation structure, composition, and regenerative capacity. 3) The method aims to provide insights on landscape transformation over decades and centuries that can inform future land use and conservation decisions by making visible the impacts of past and present land management practices.


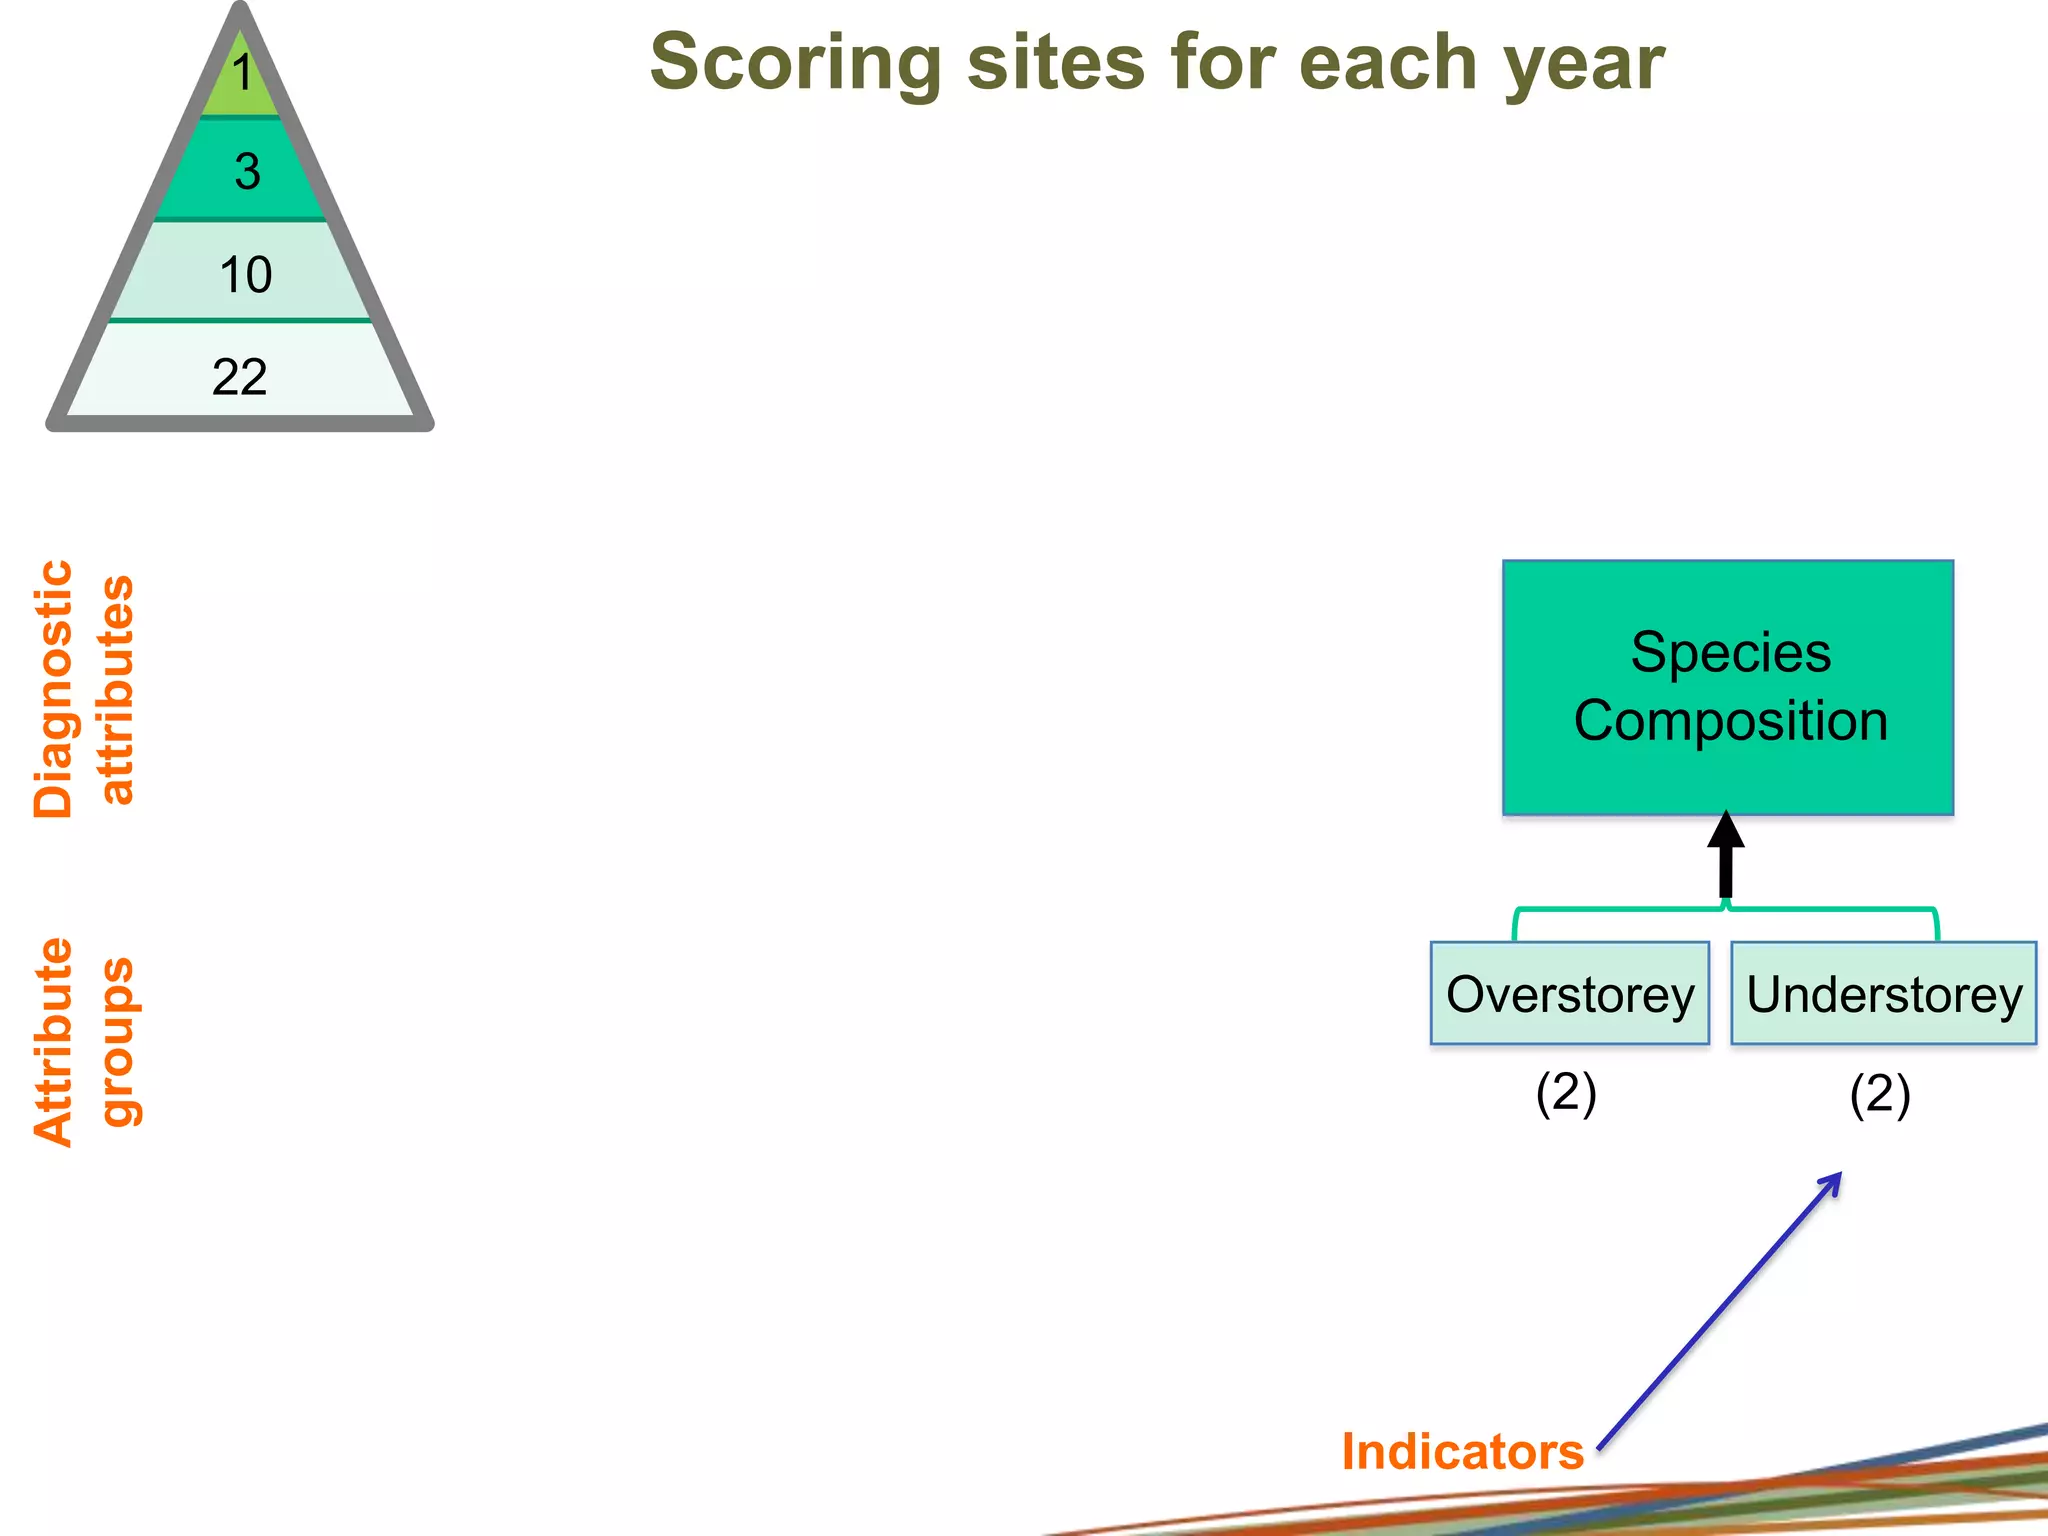
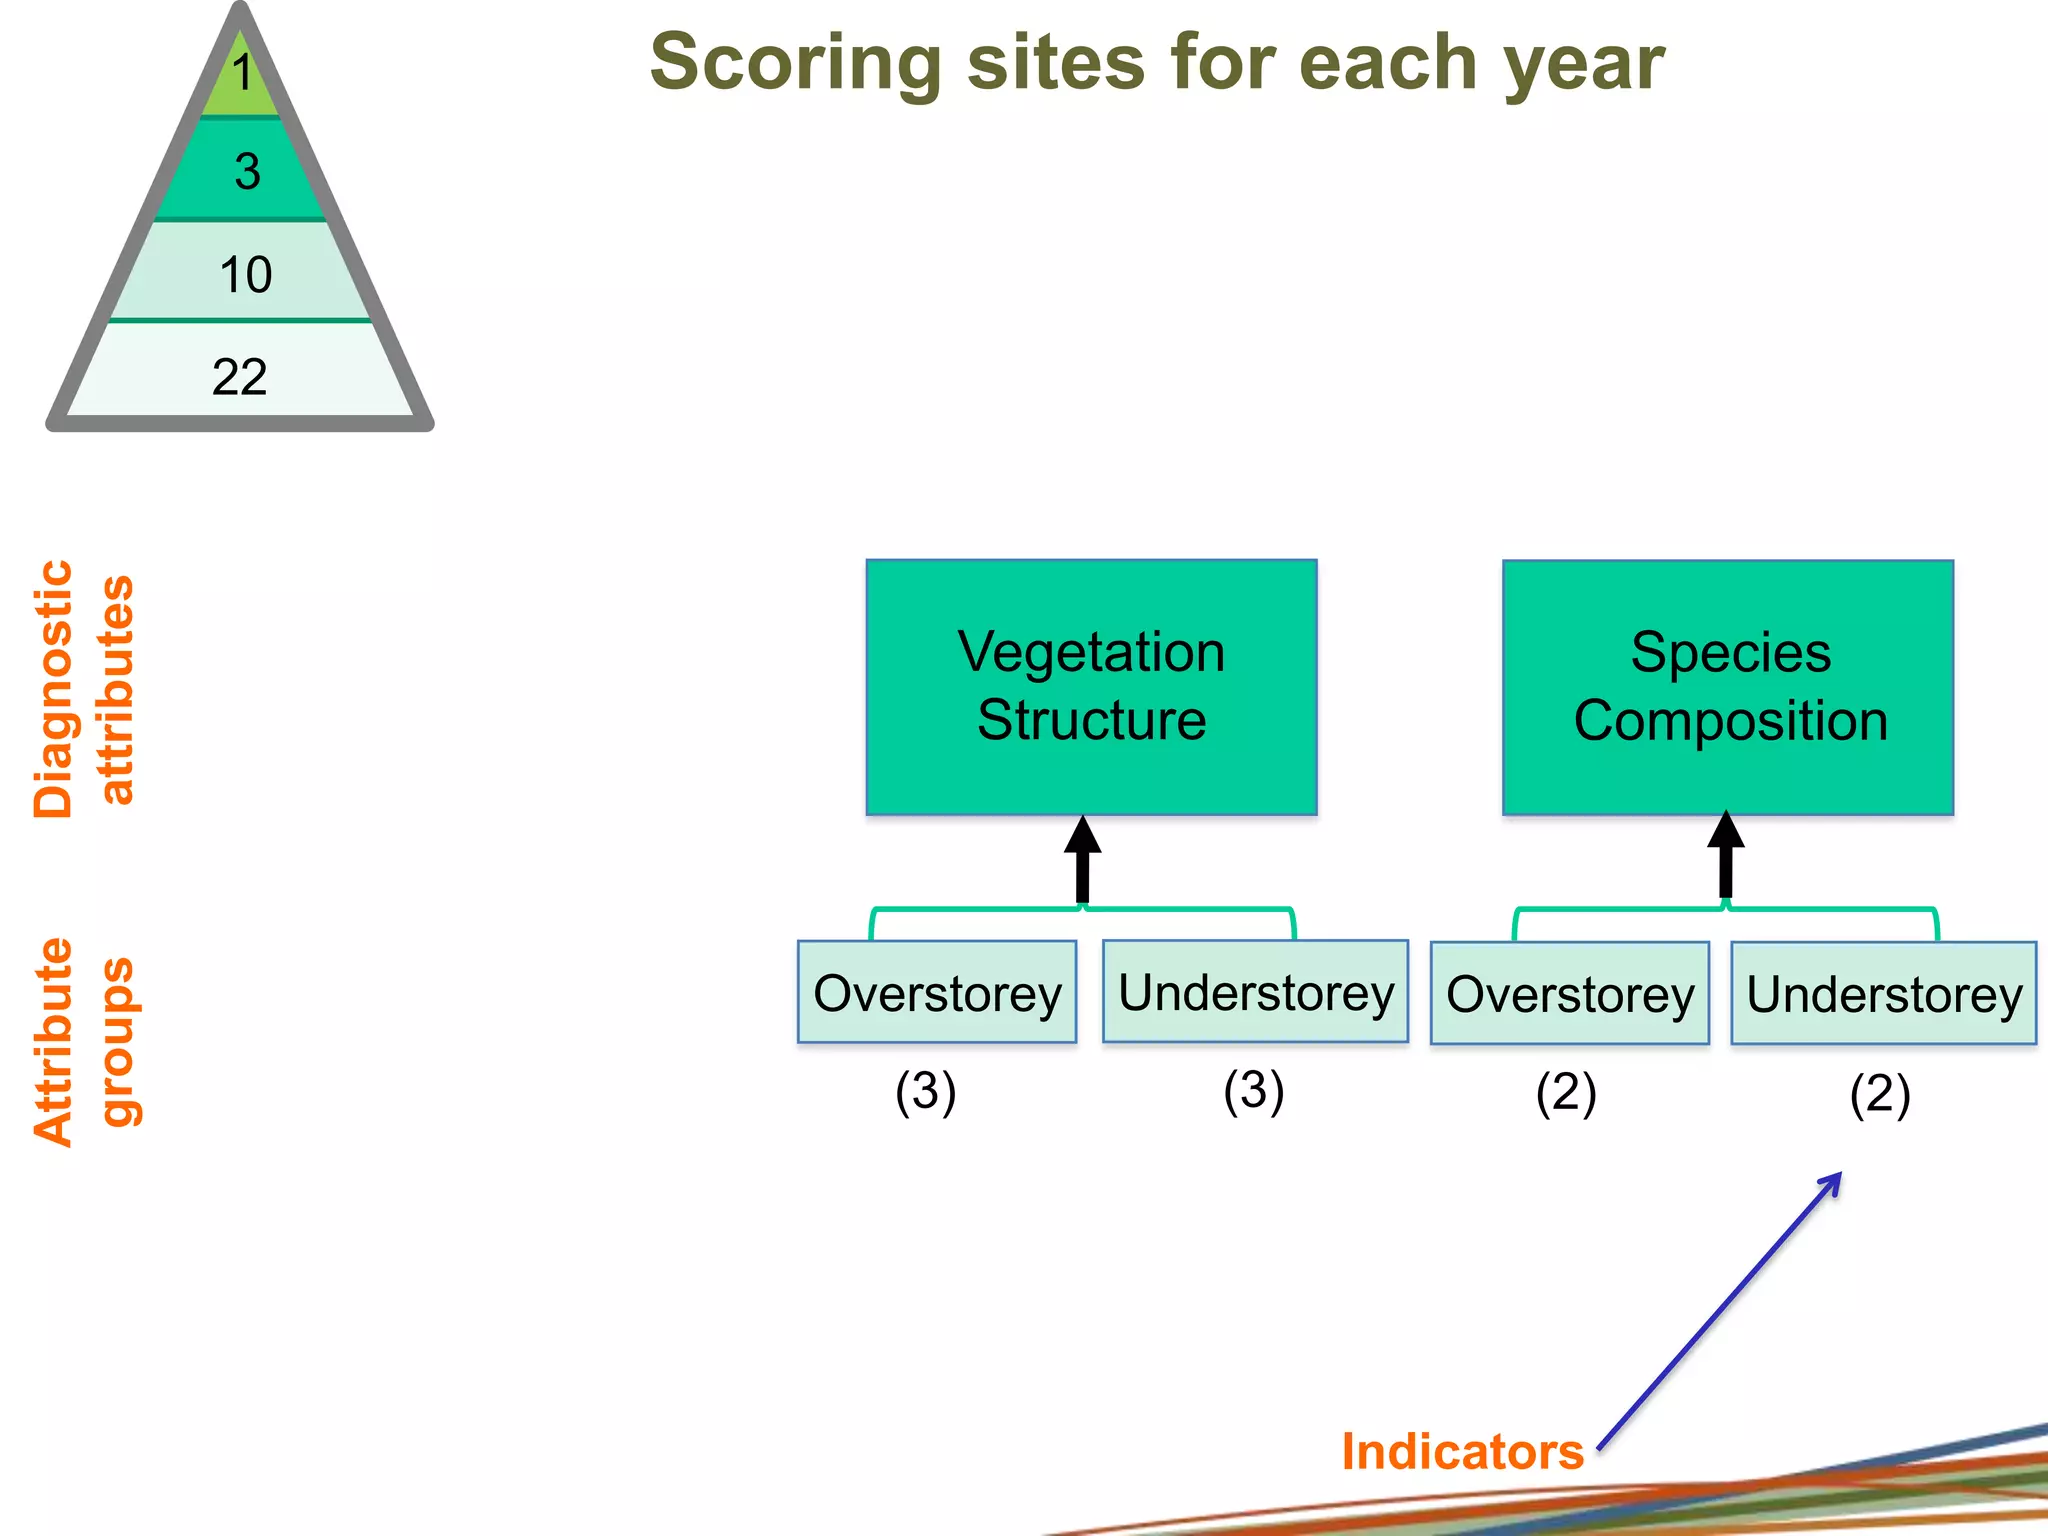
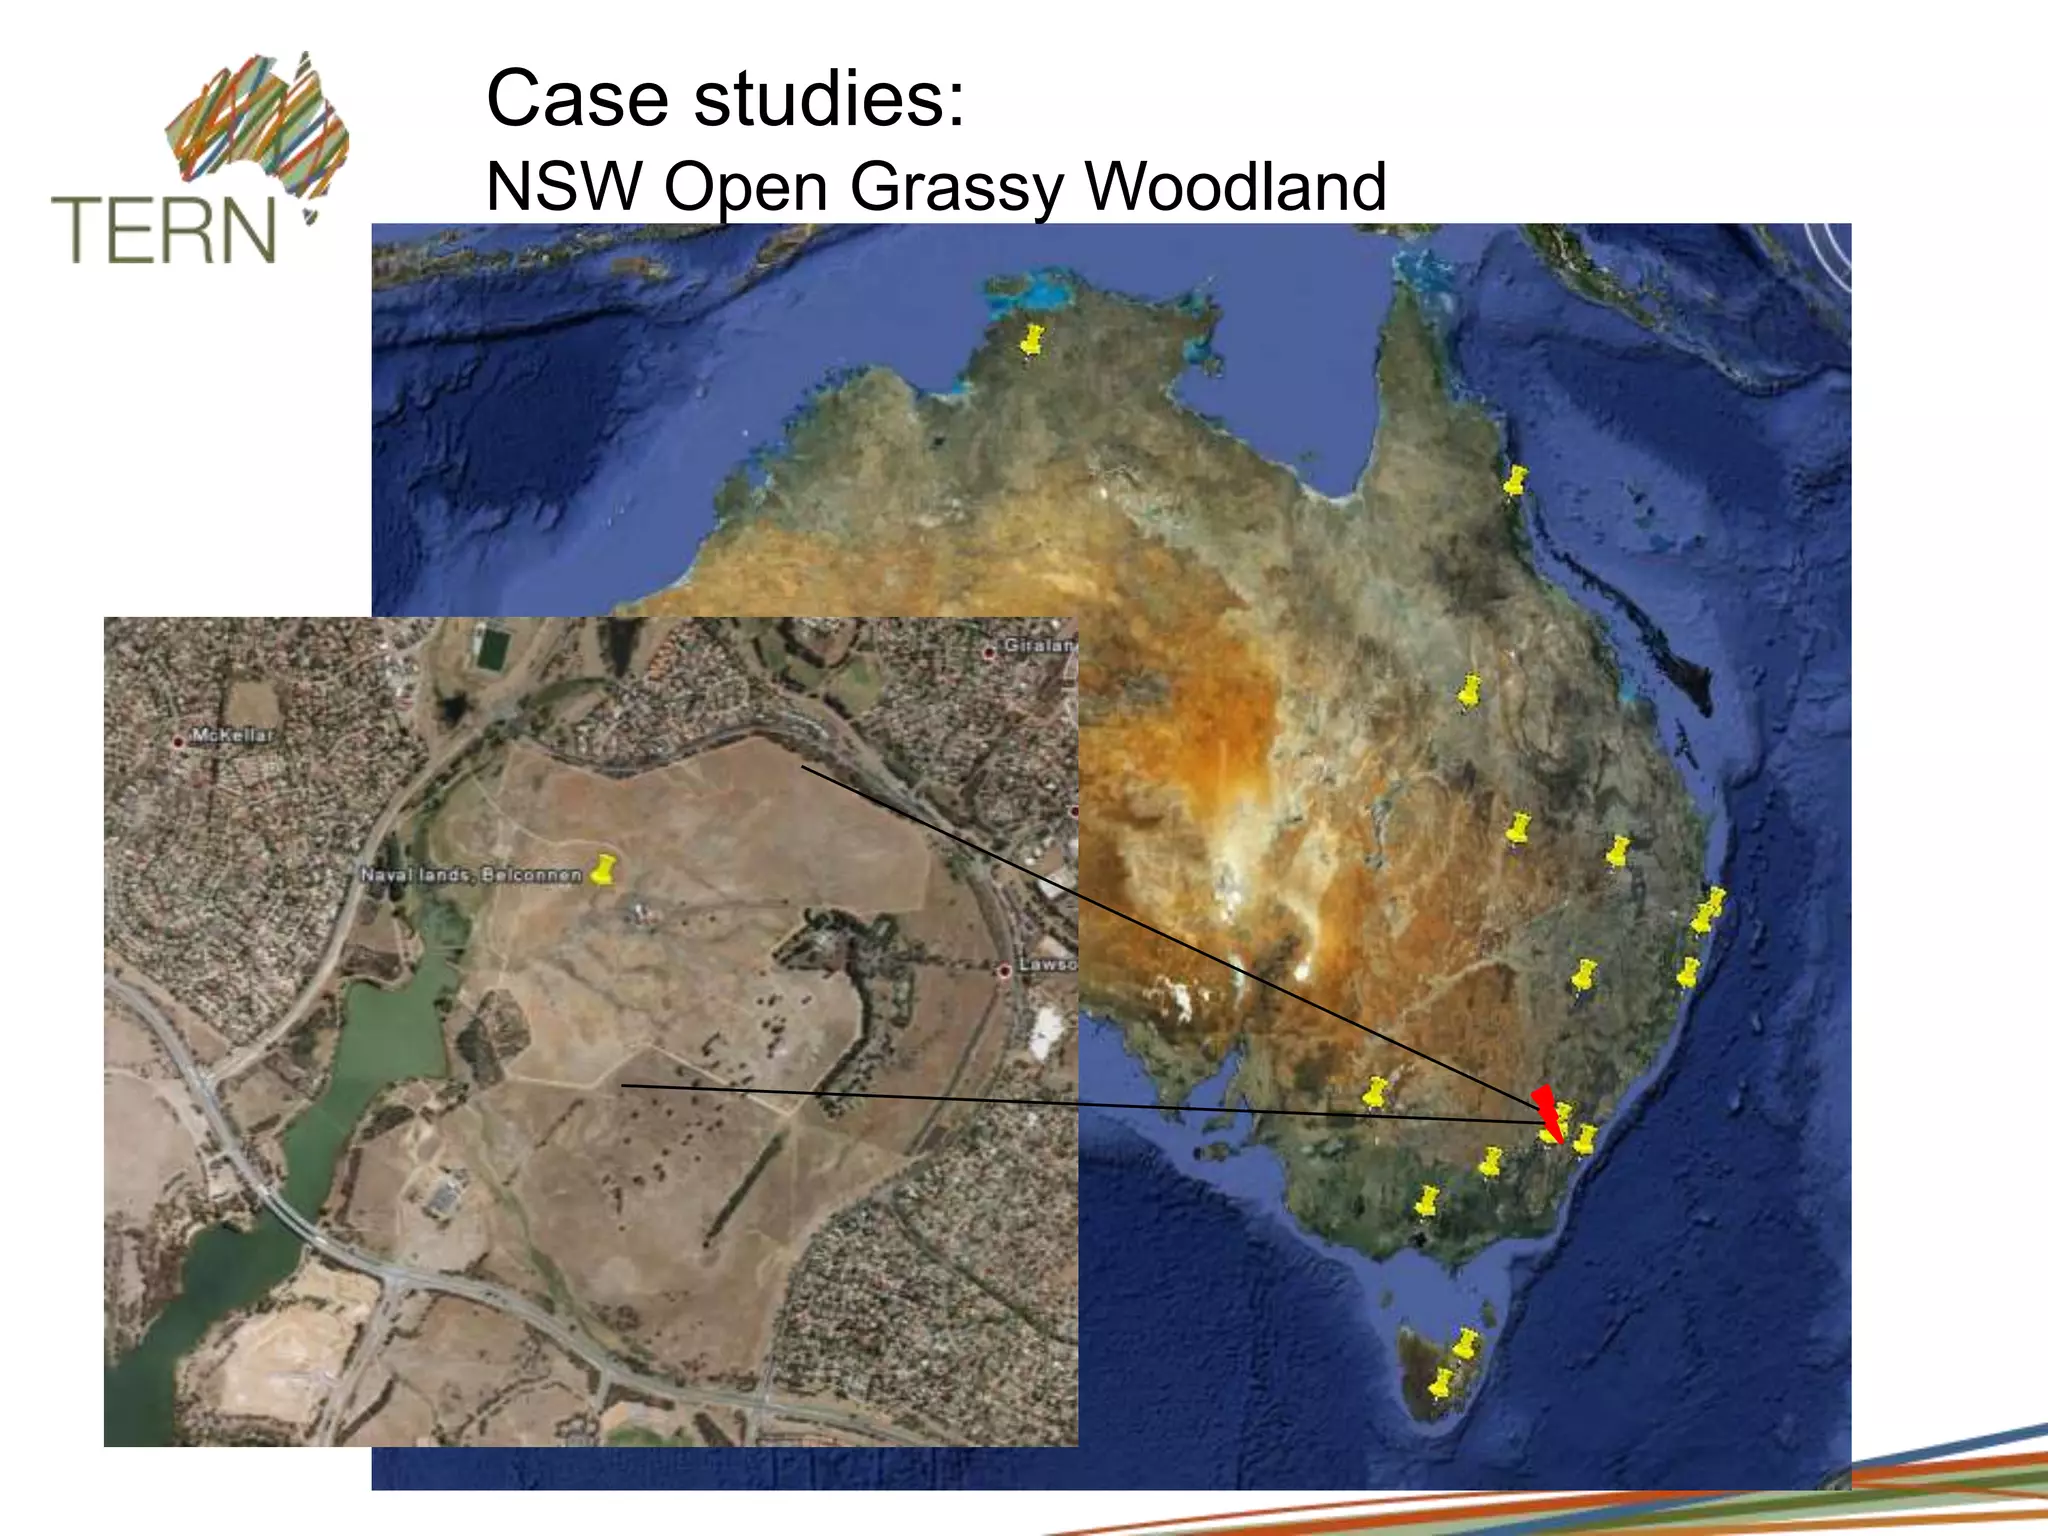
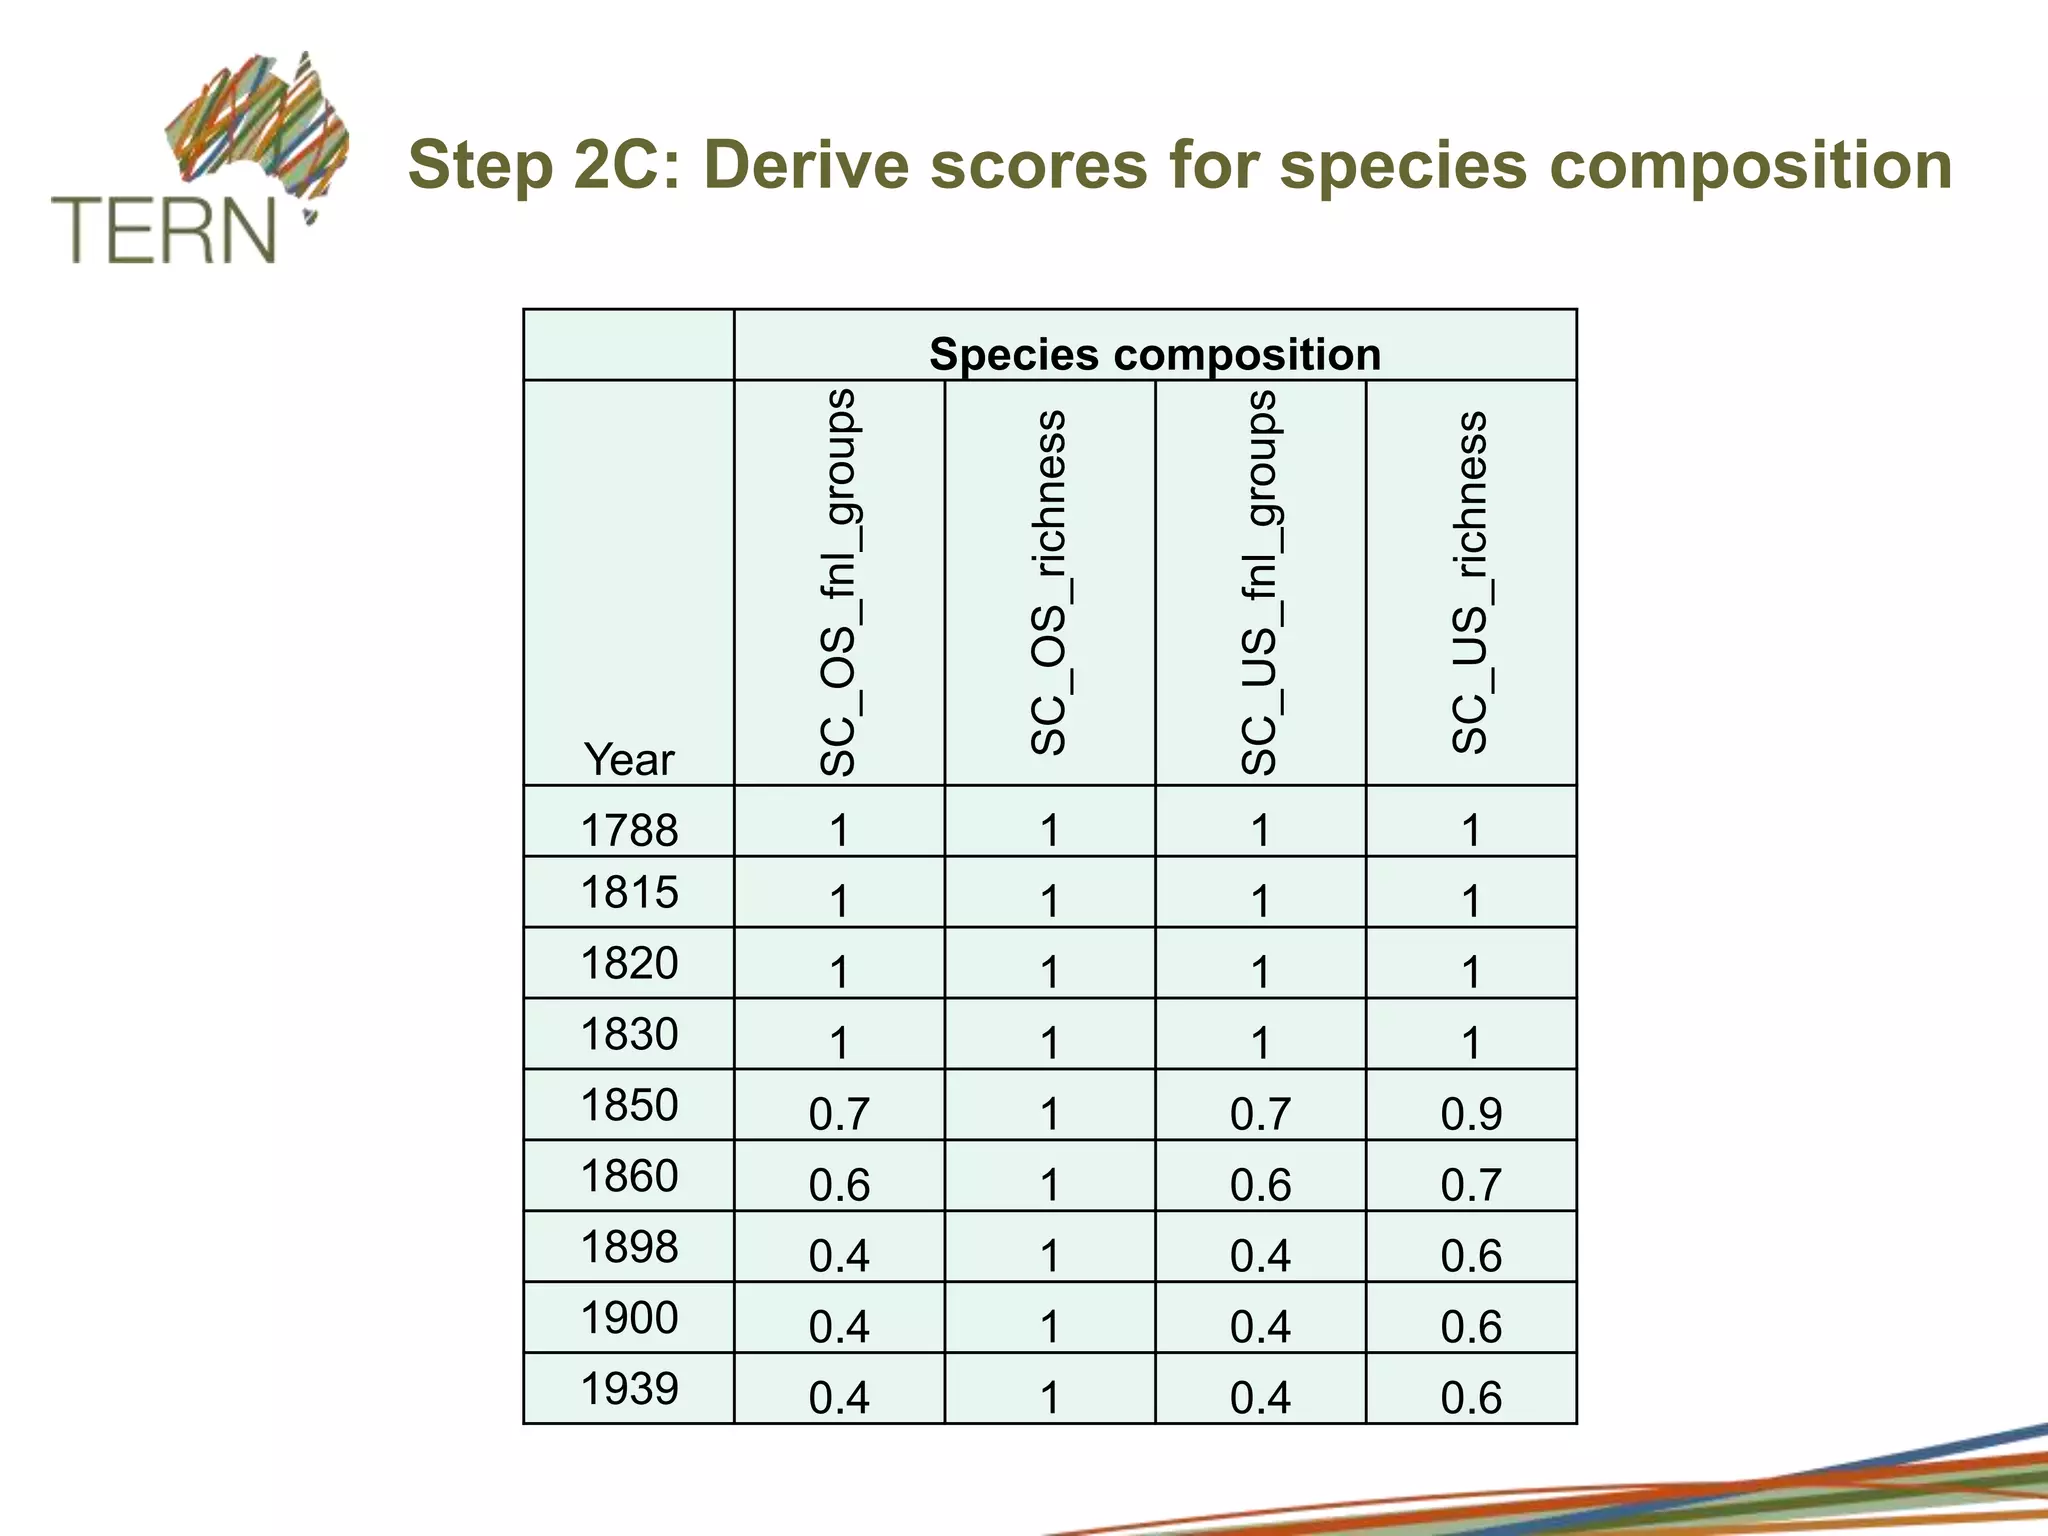
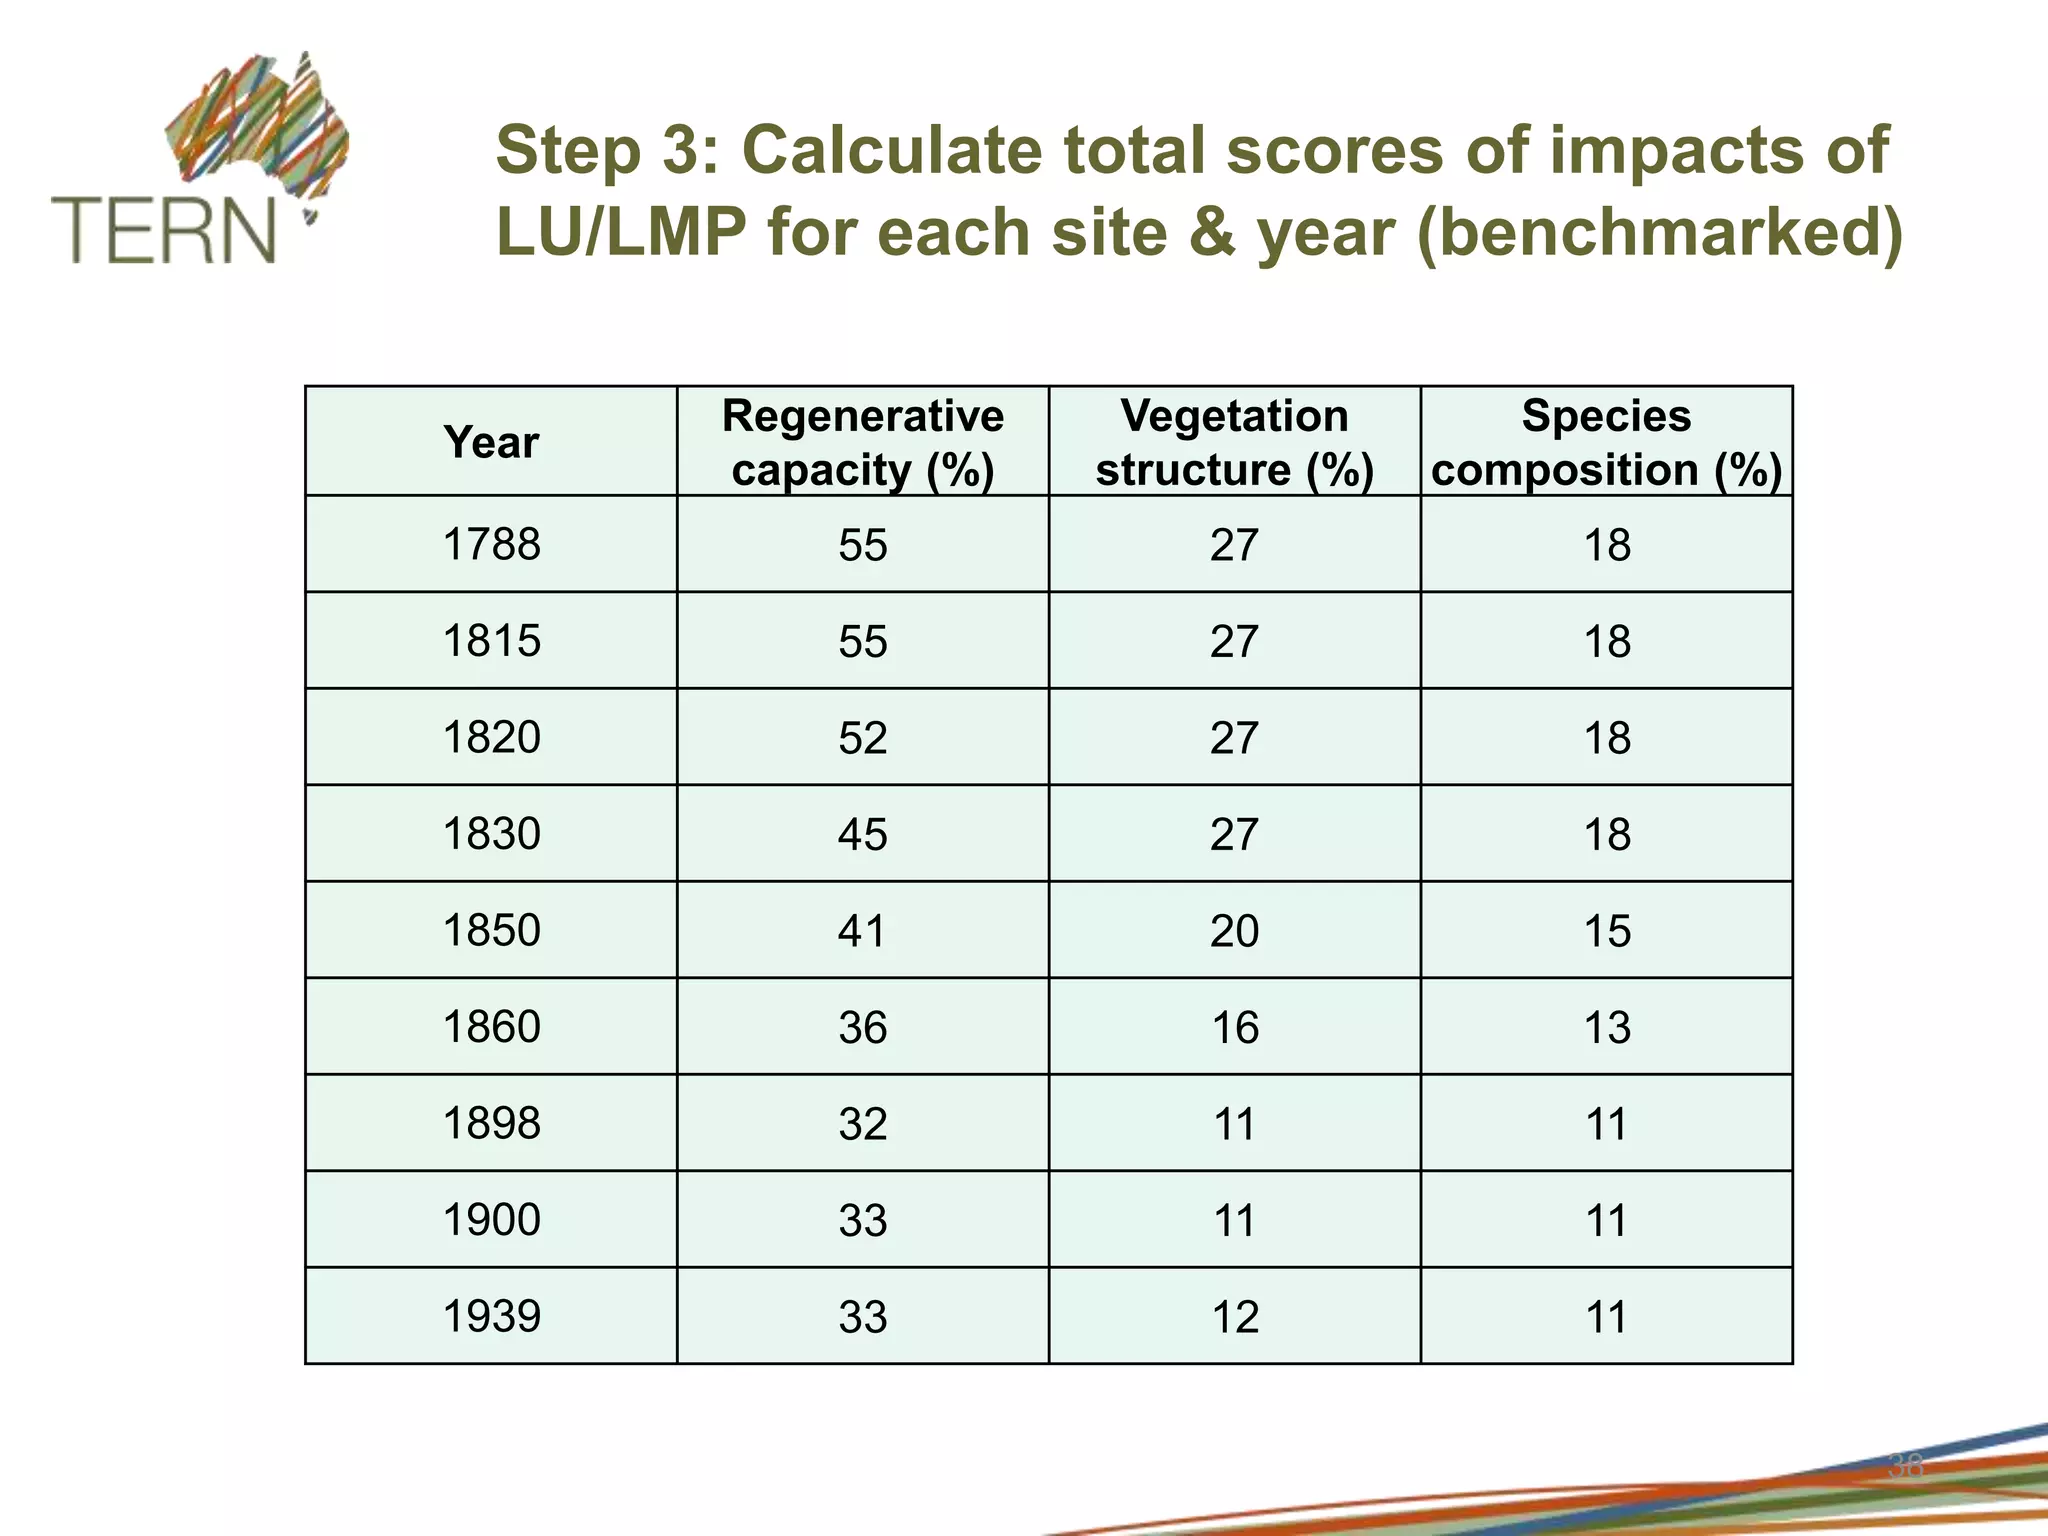
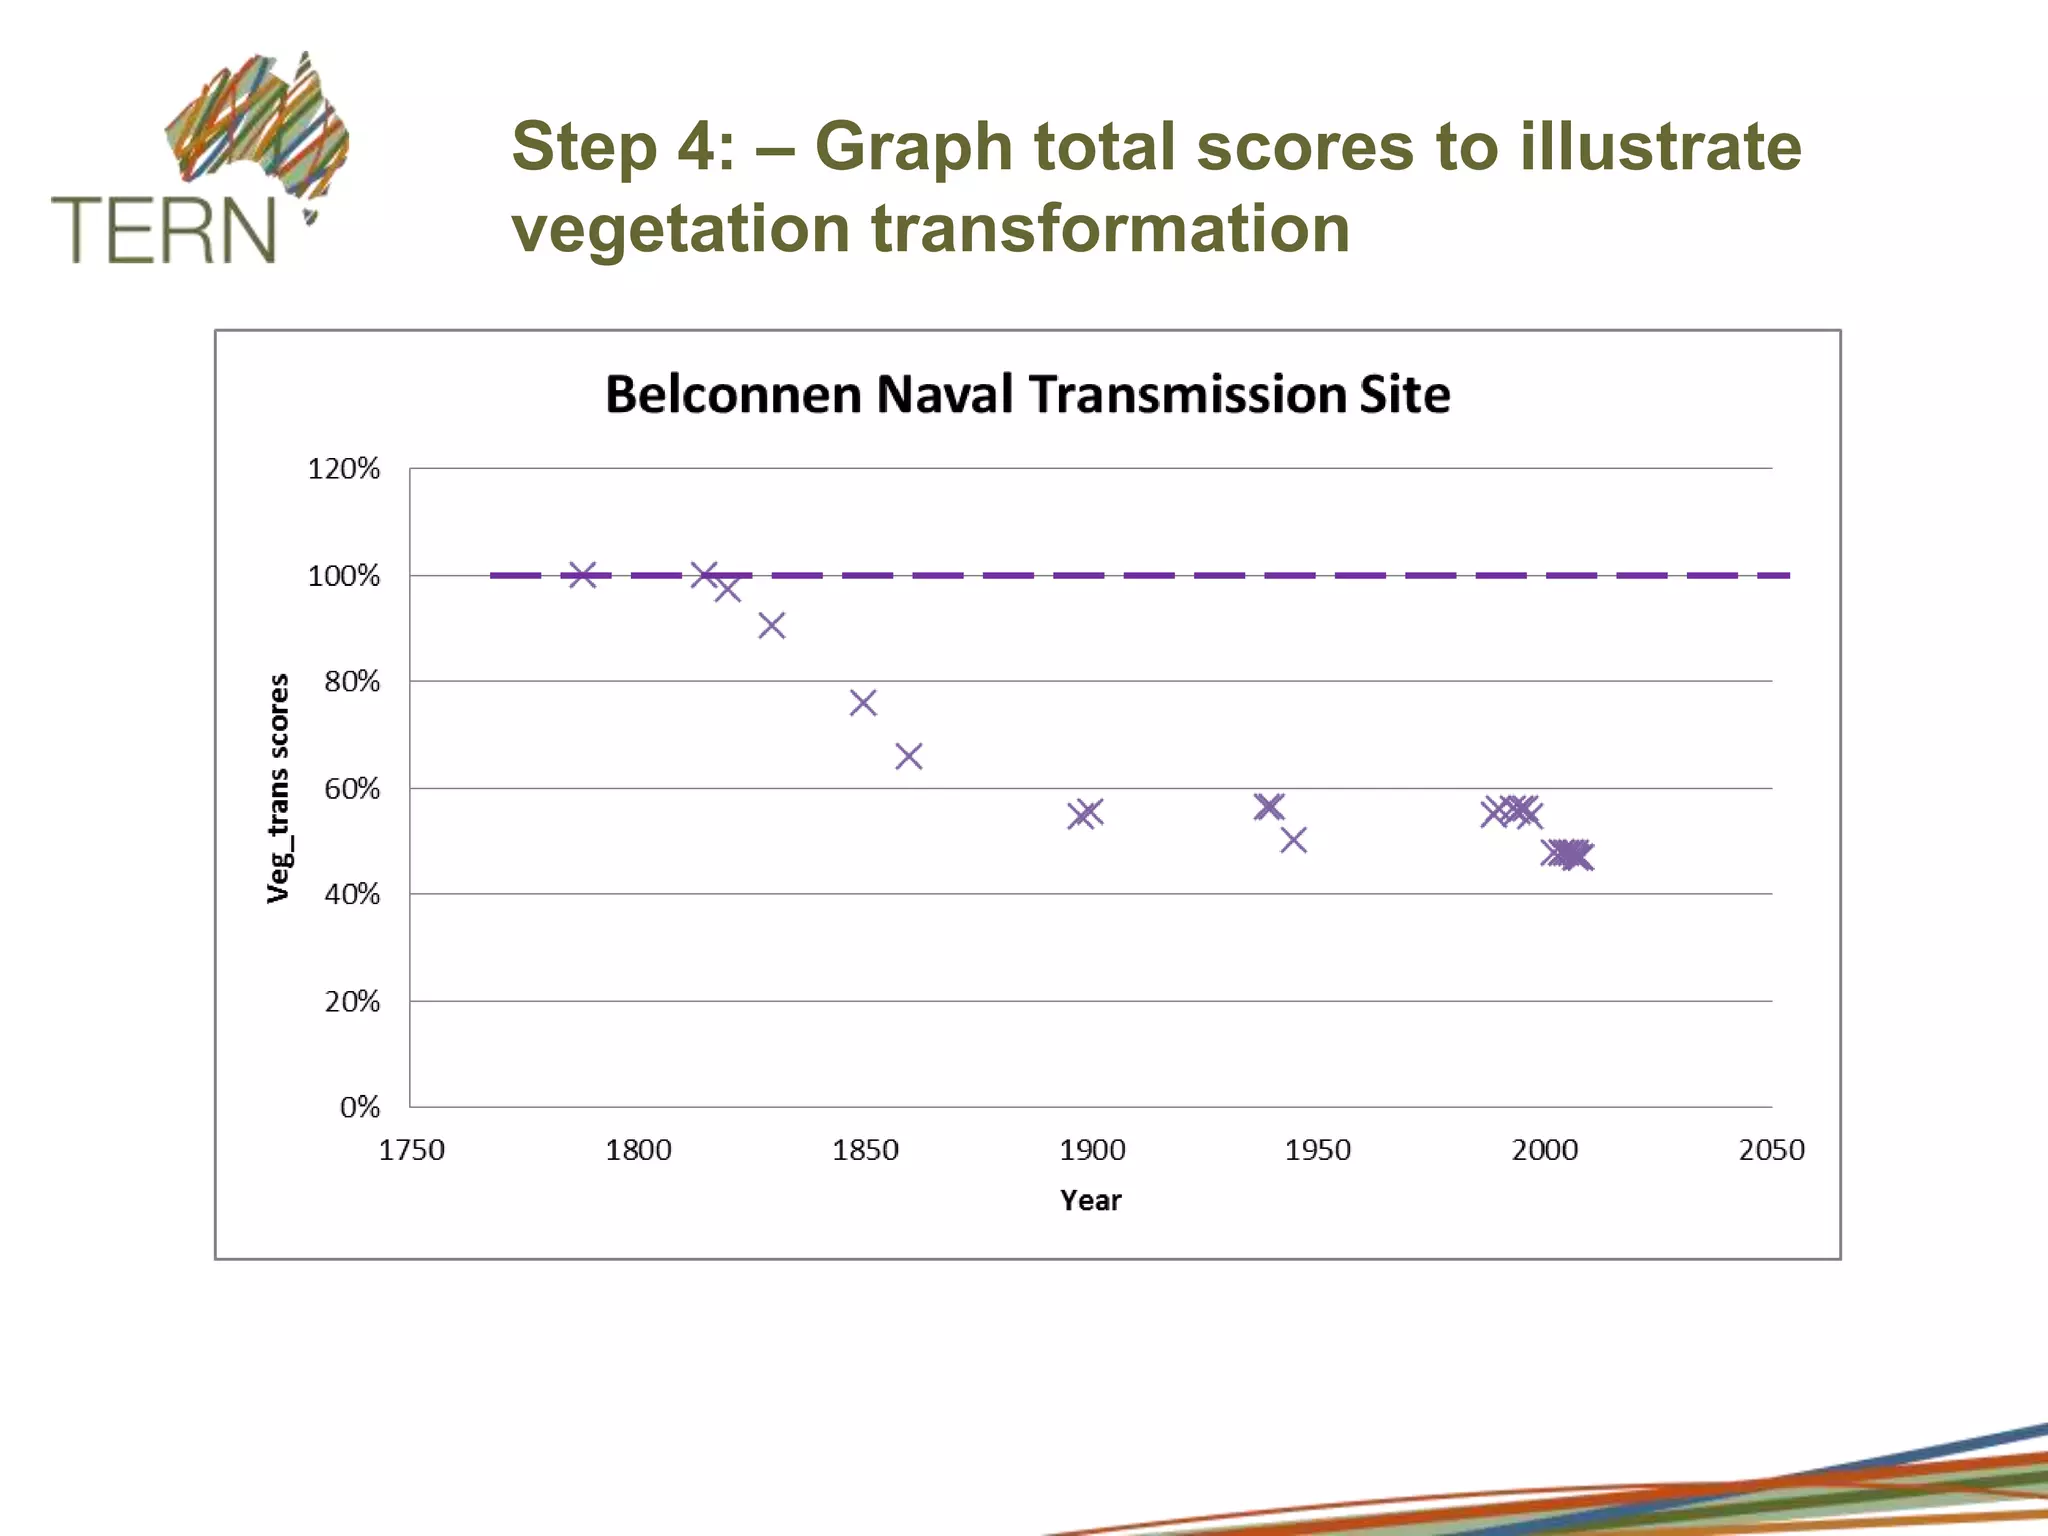
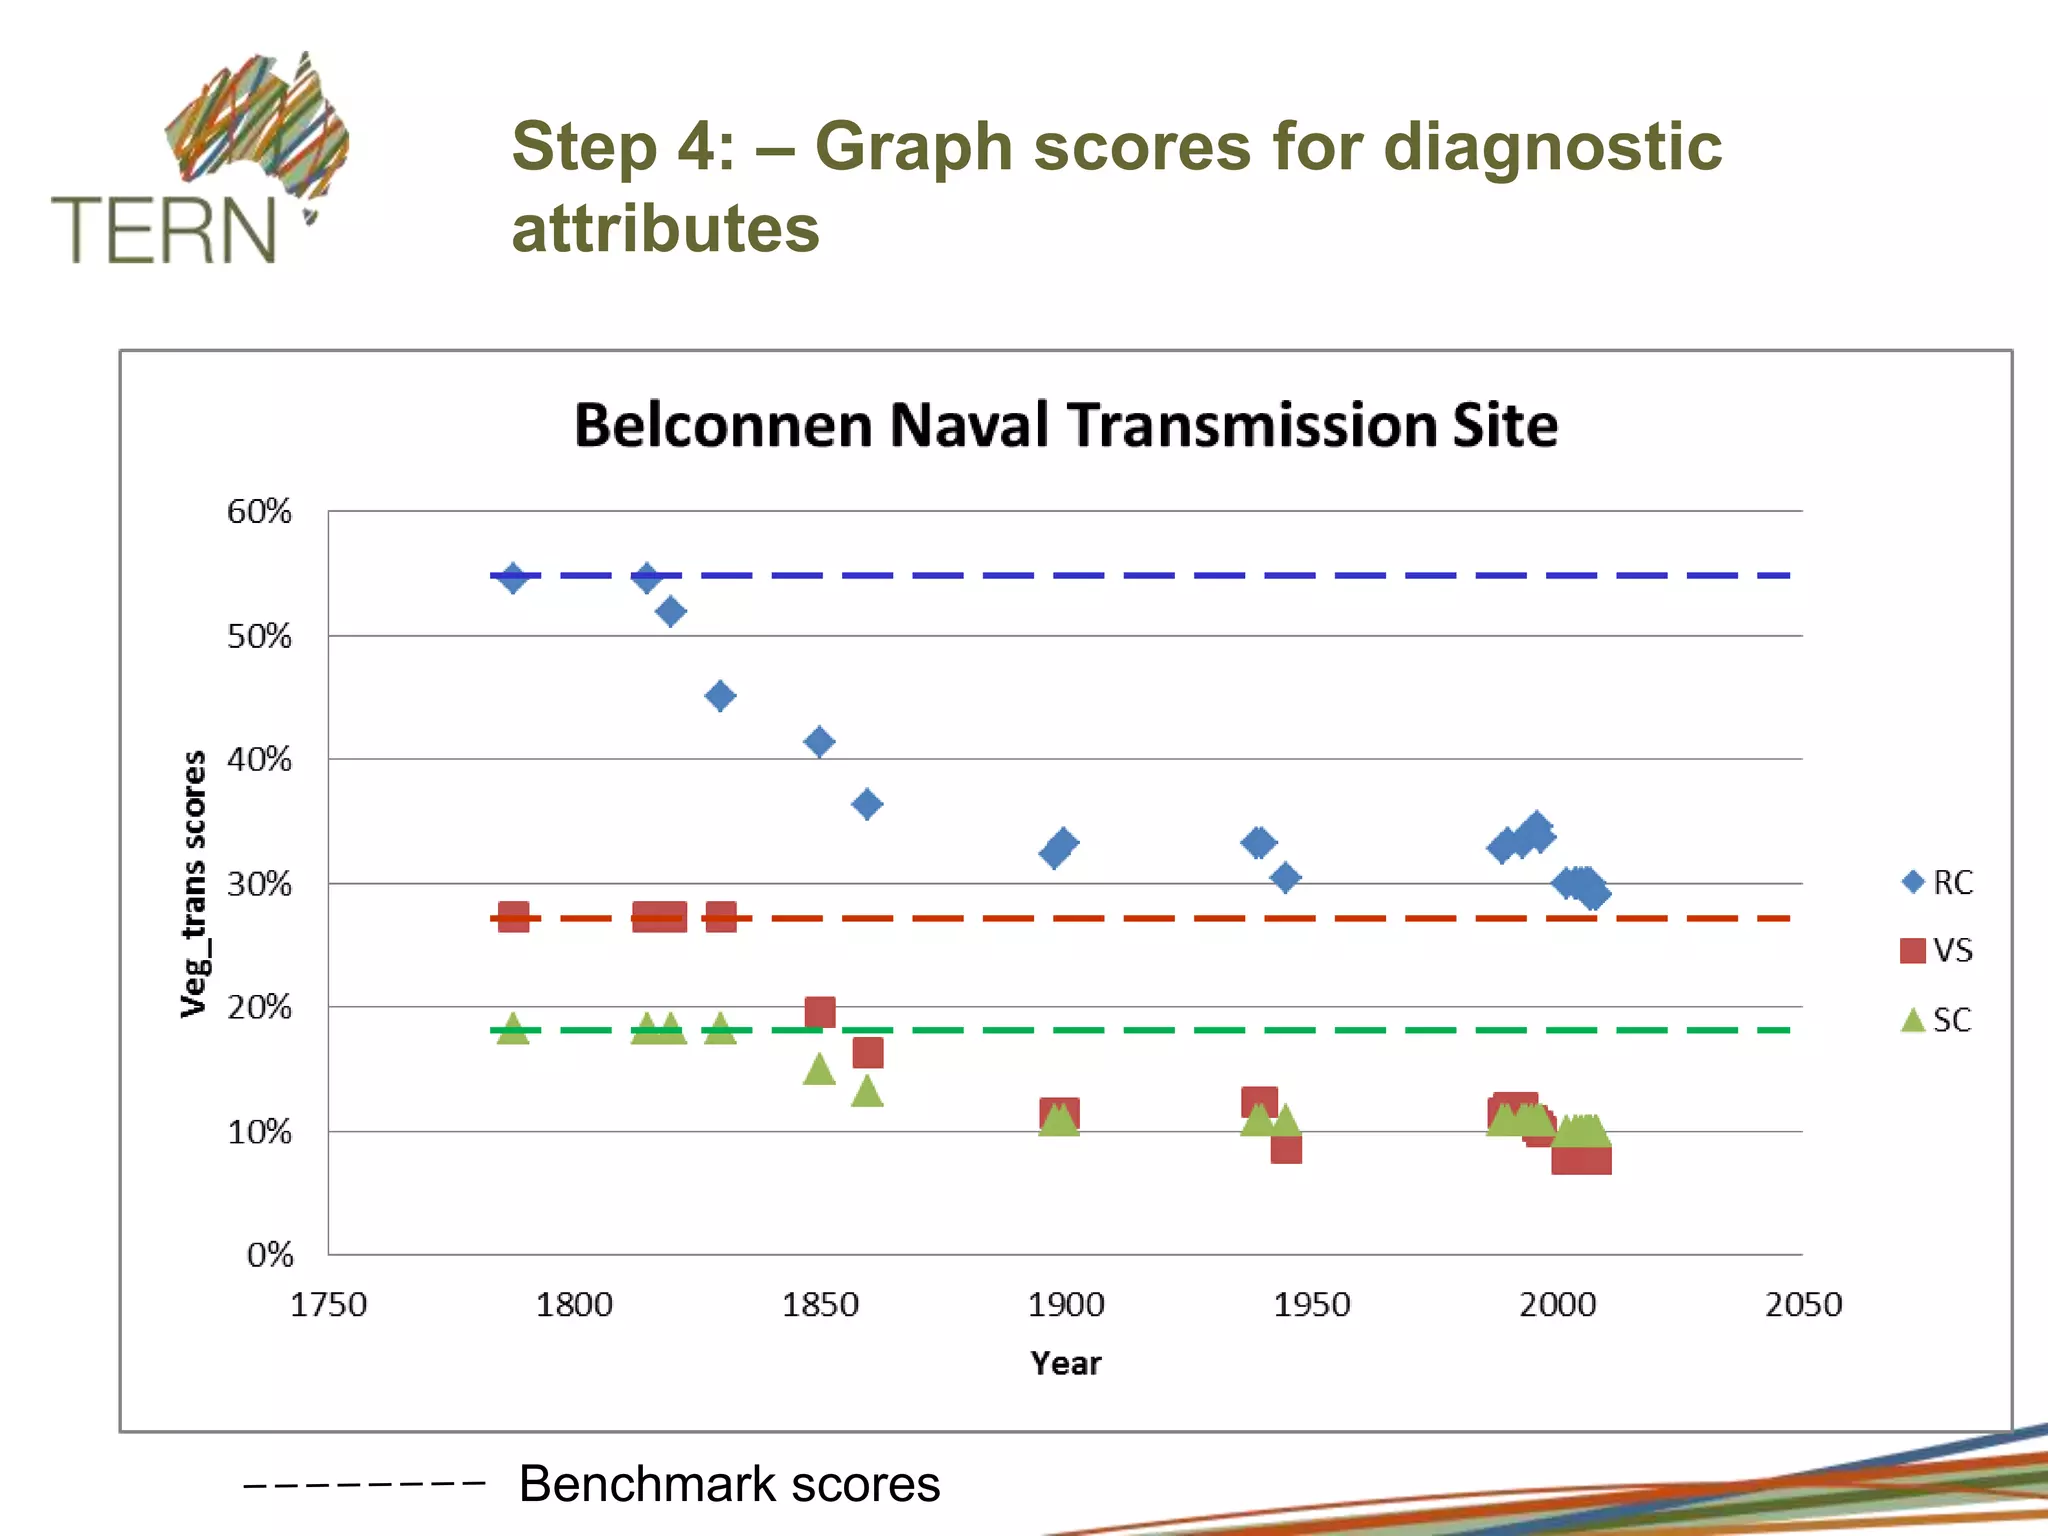
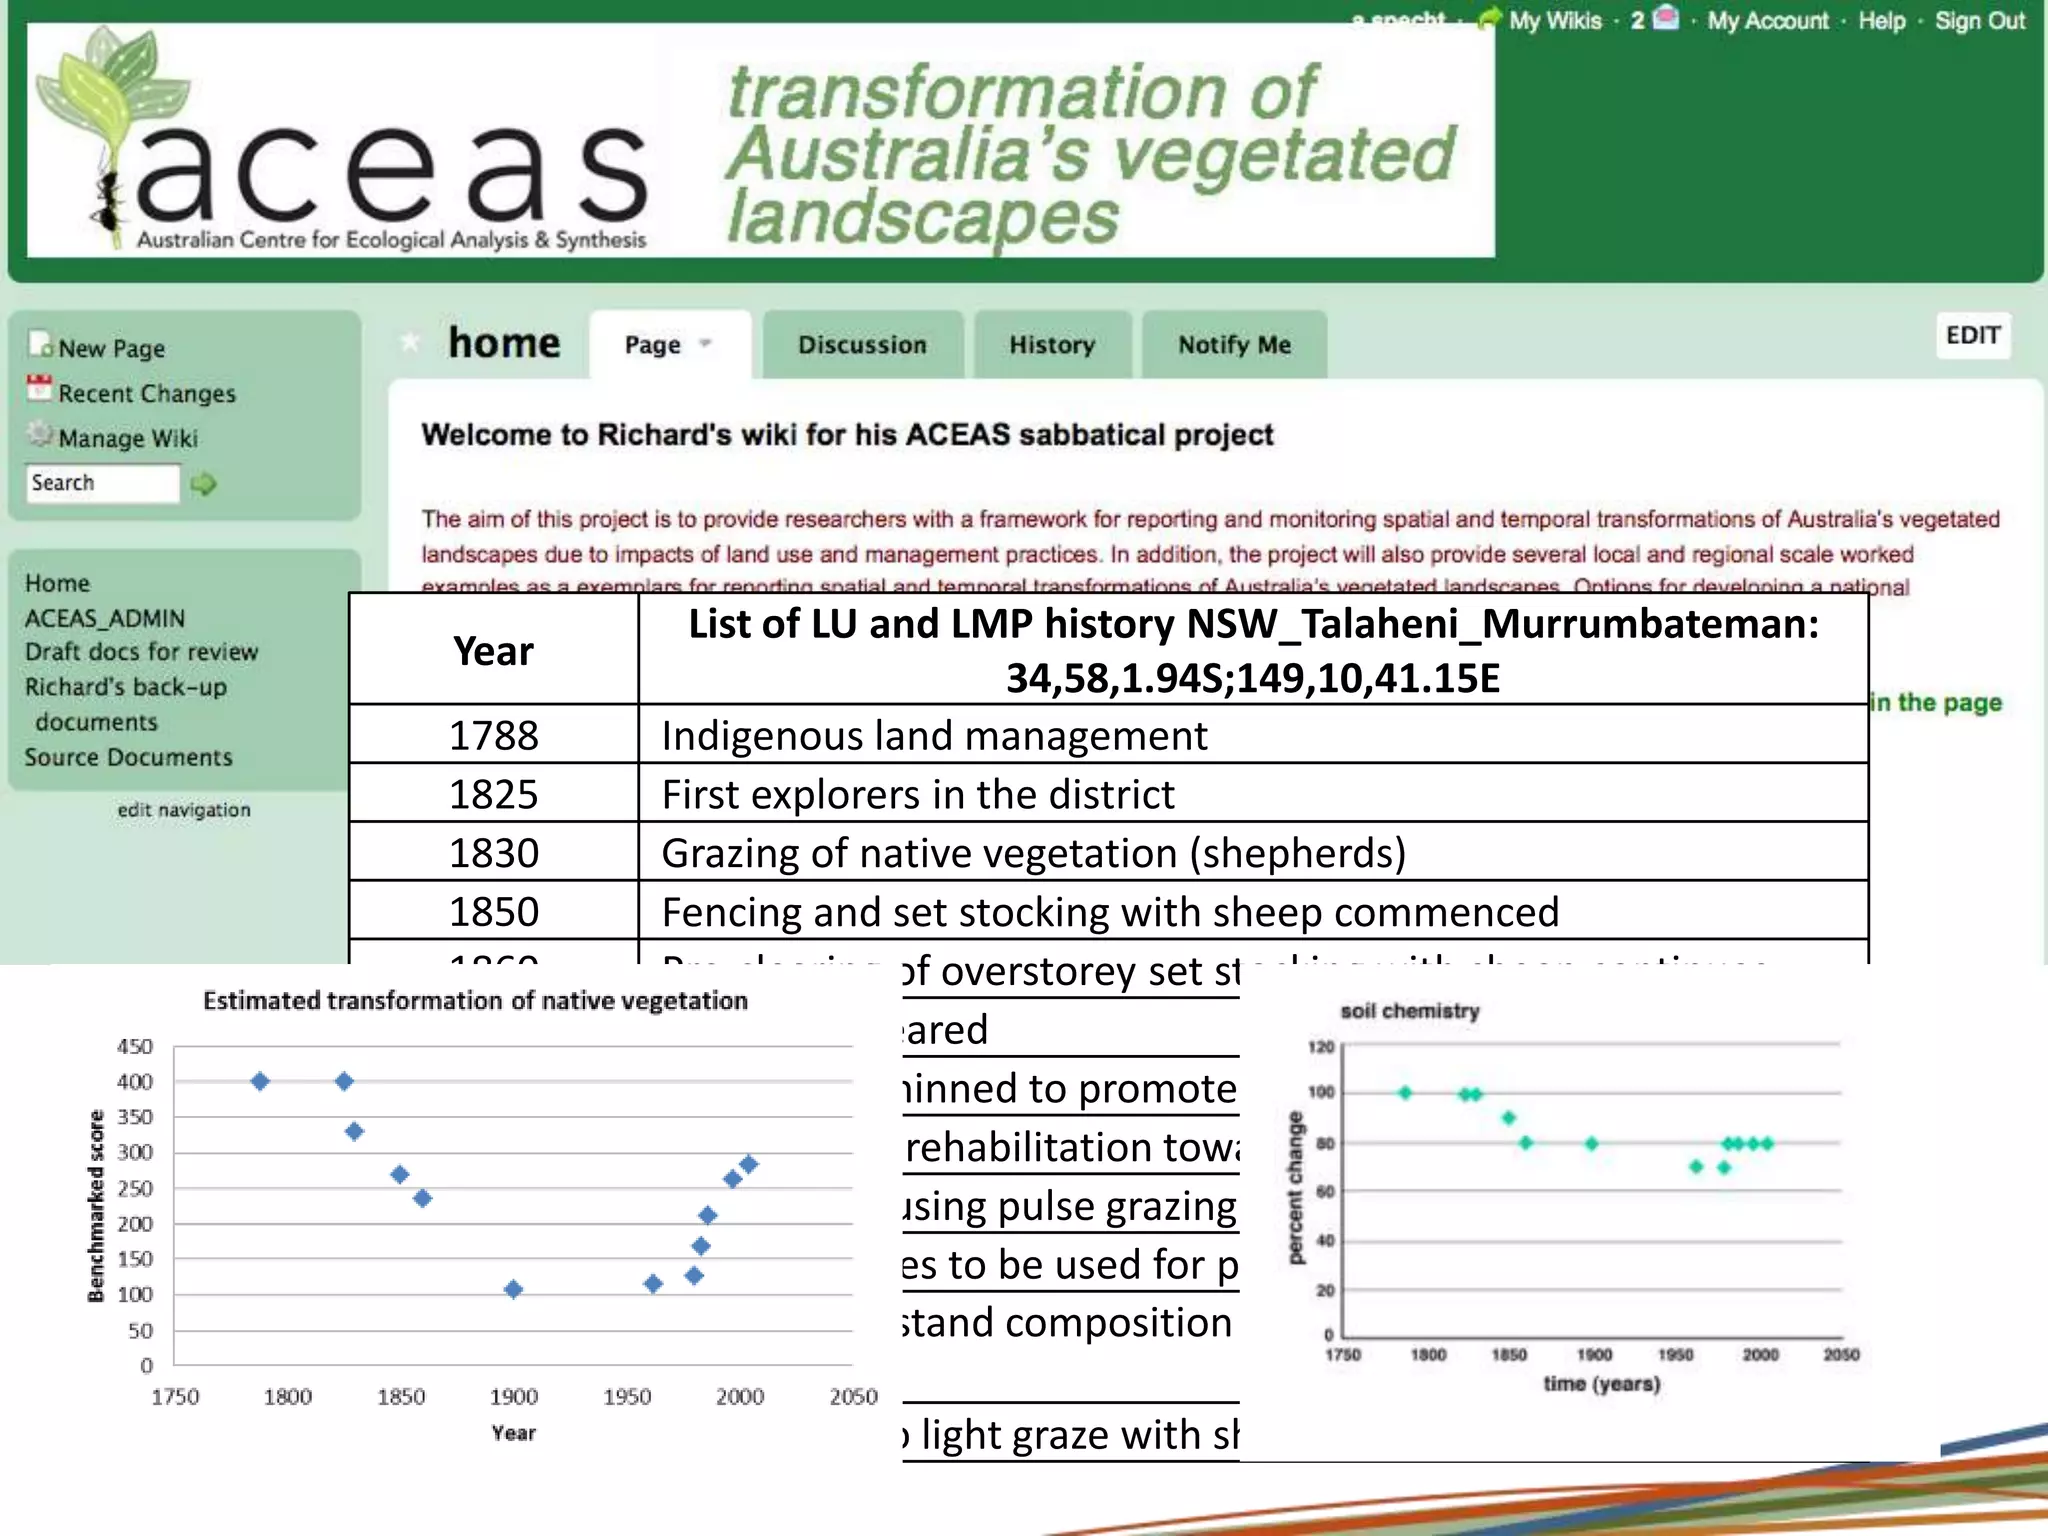
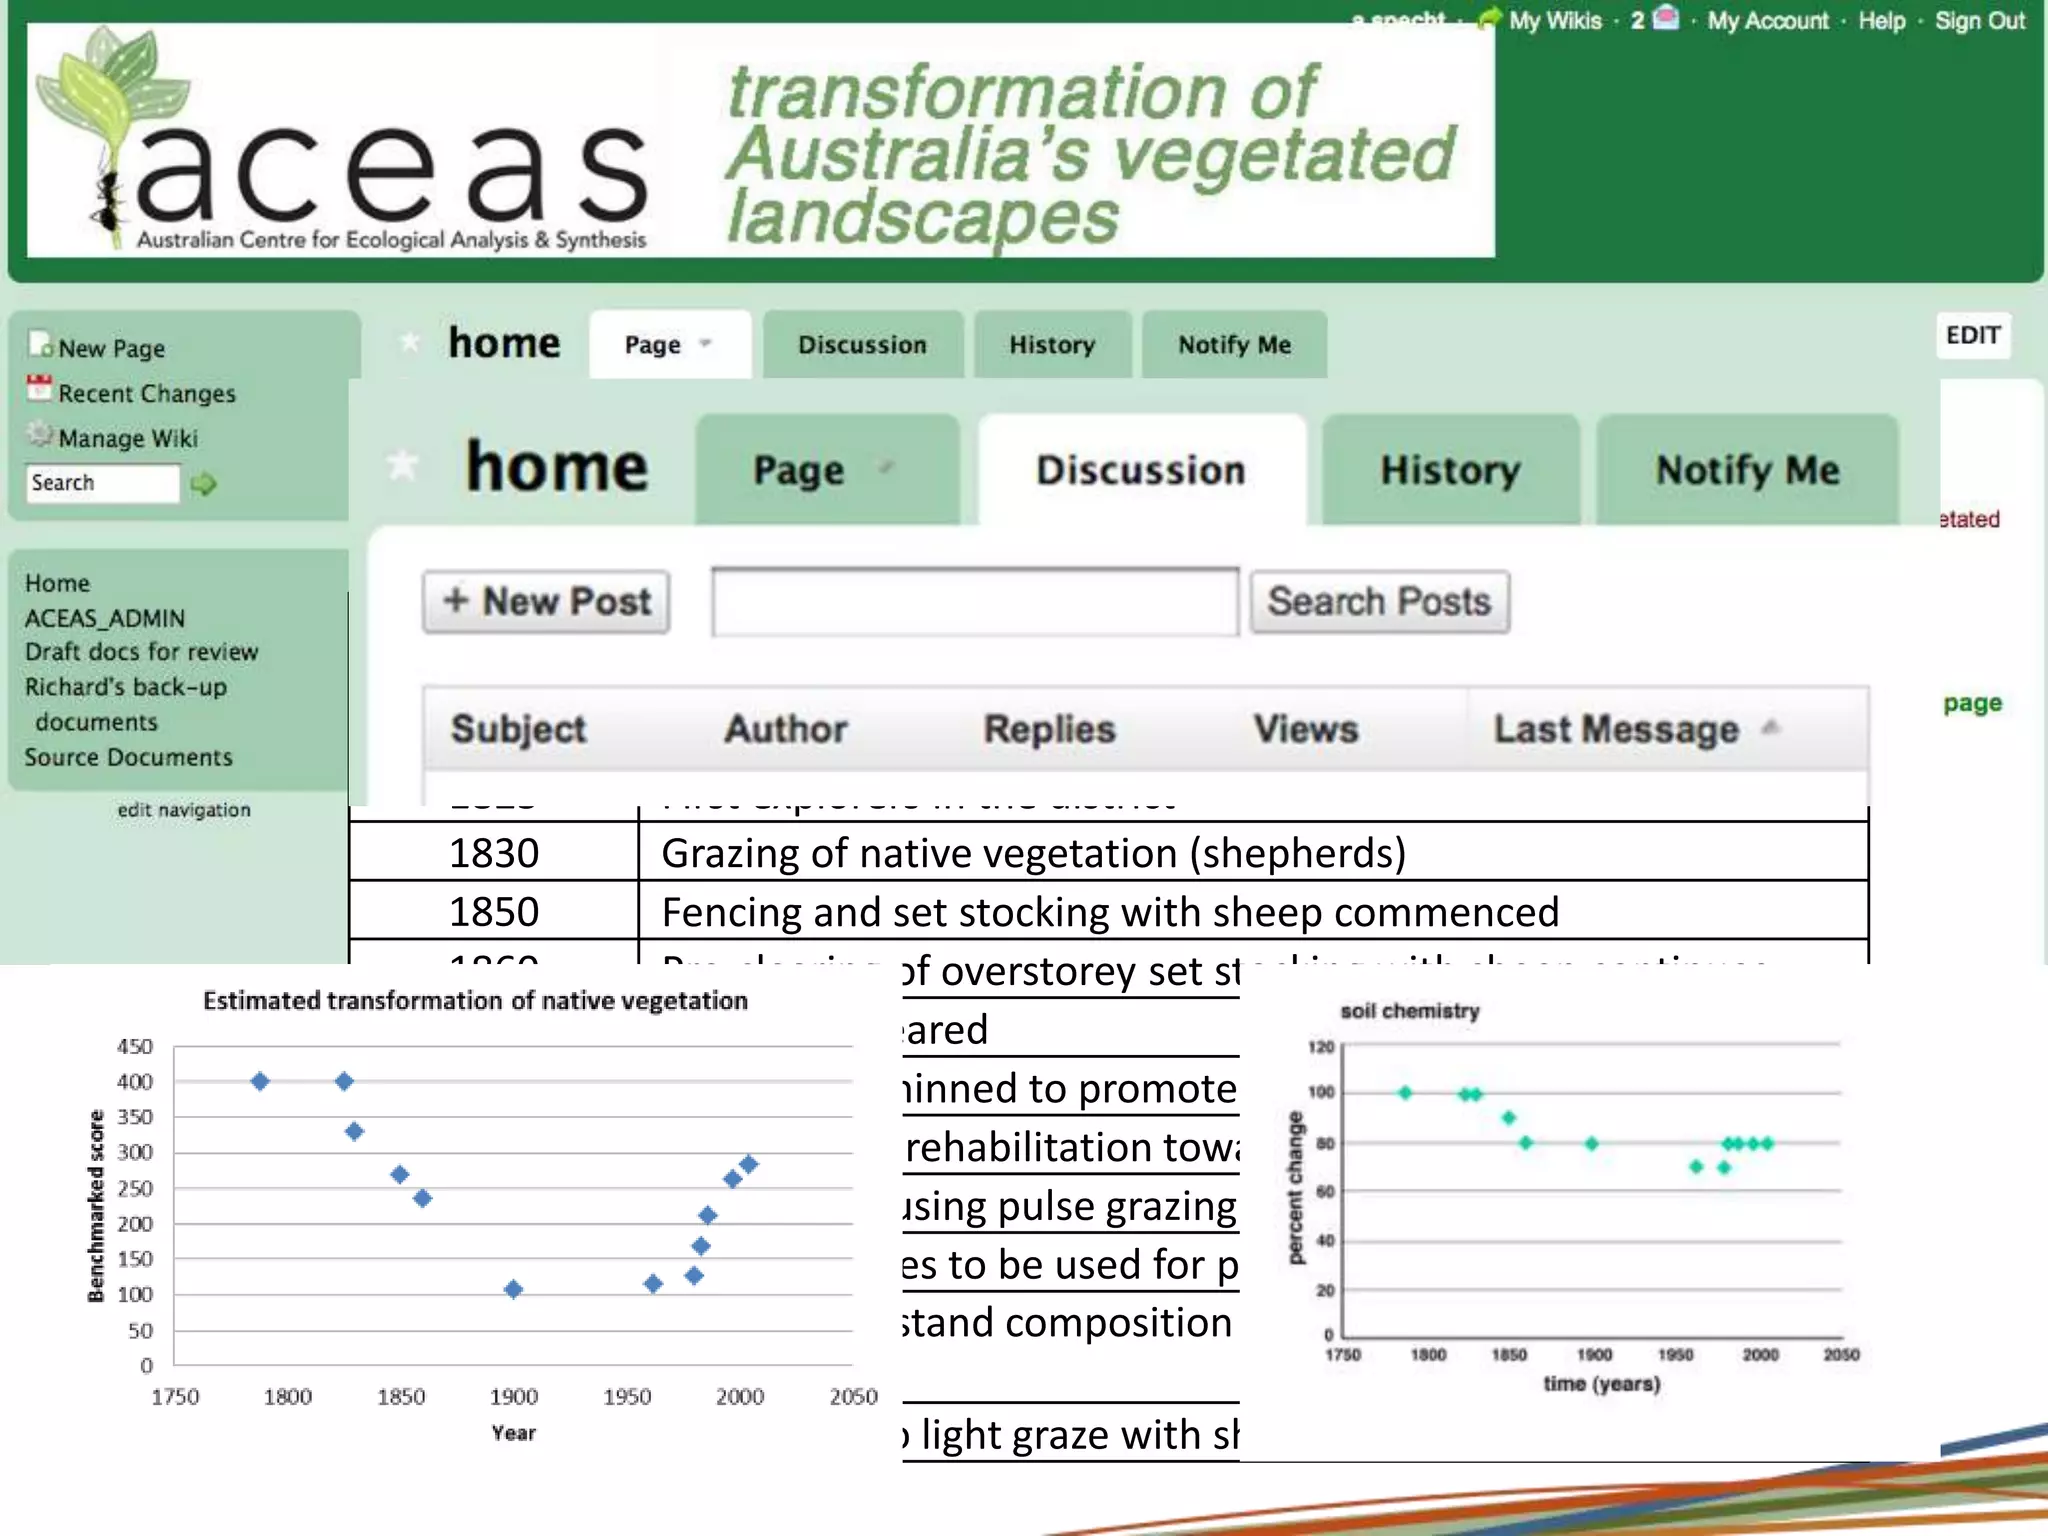
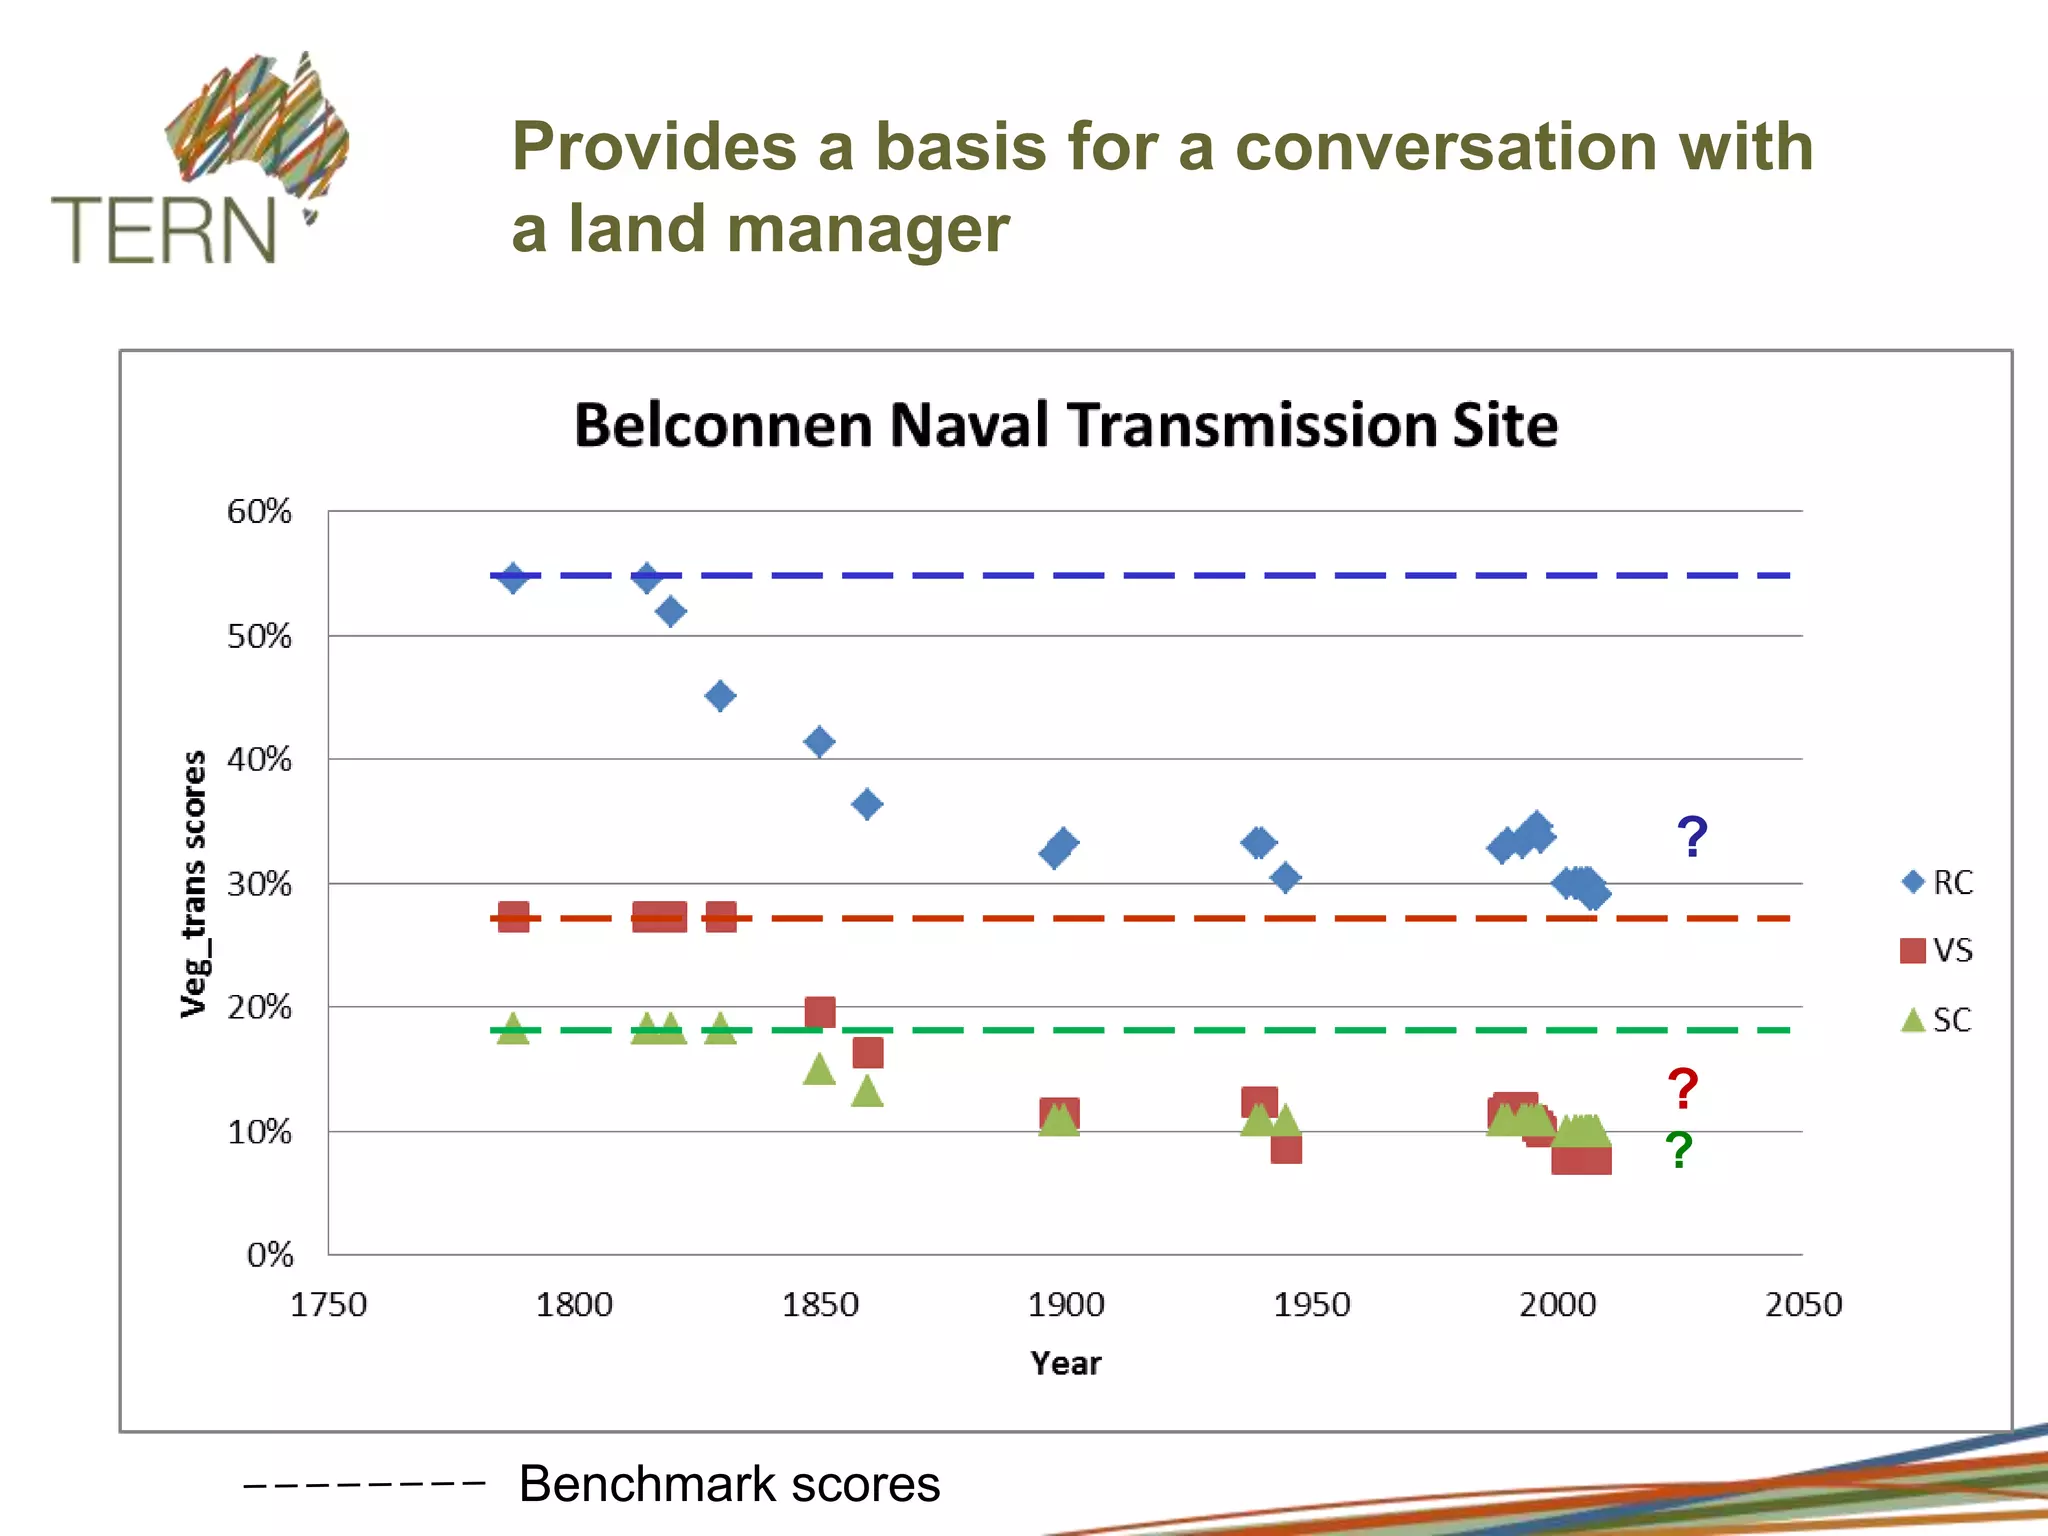
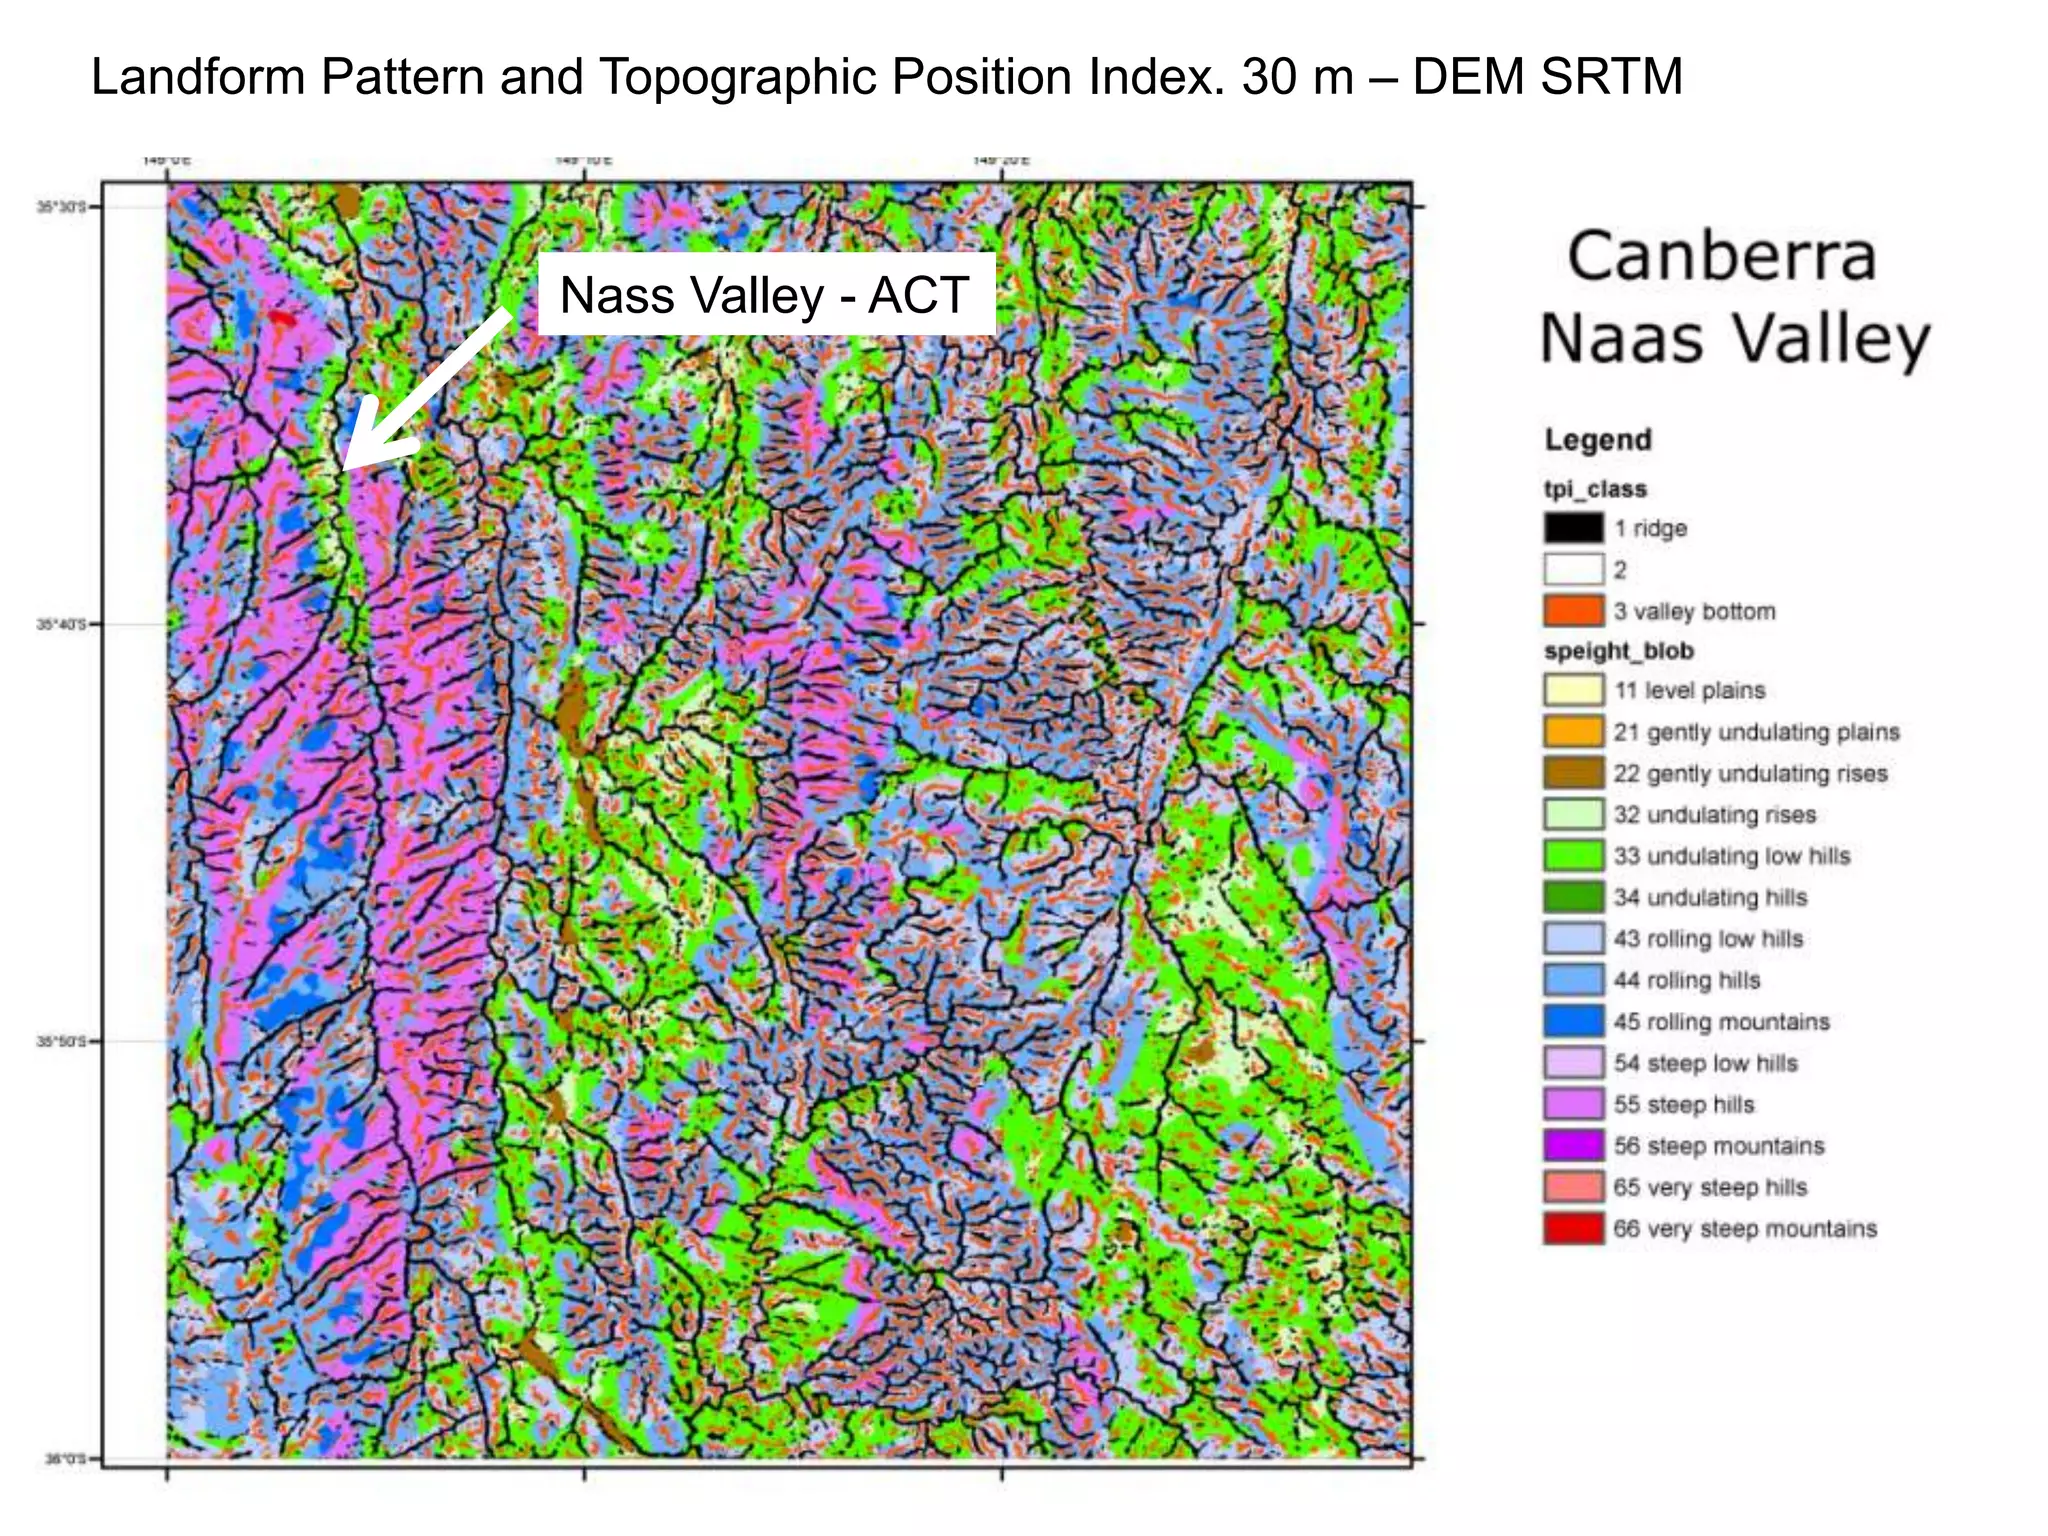
![Coded Agents – with UiPath SDK + LangGraph [Virtual Hands-on Workshop]](https://cdn.slidesharecdn.com/ss_thumbnails/codedagentsdeck-251215155422-5497c599-thumbnail.jpg?width=640&height=640&fit=bounds)


