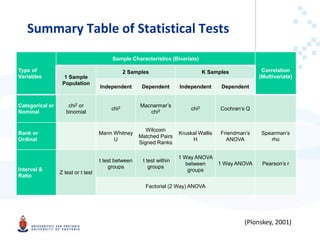
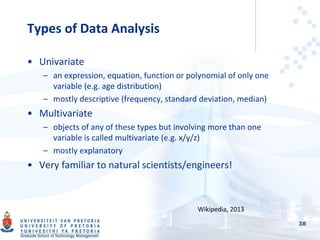
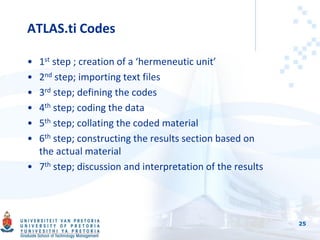
This document provides an overview of techniques for data gathering and analysis in research. It discusses both qualitative and quantitative methods. For data gathering, it describes techniques like perusal, measurement, observation, and questioning. It also discusses desirable attributes of techniques, the data gathering spectrum, and issues around measurement and variables. For data analysis, it discusses qualitative coding and analysis using tools like ATLAS.ti, as well as quantitative descriptive and inferential statistical analysis techniques like t-tests and chi square tests. It emphasizes that the appropriate analytical technique depends on the measurement scale of the variables.

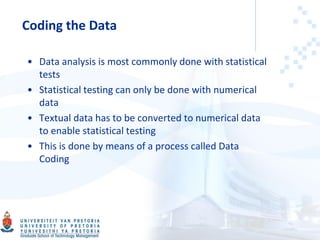
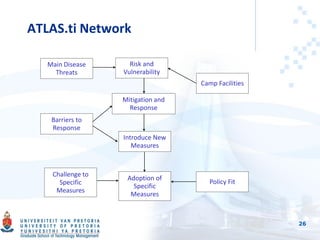
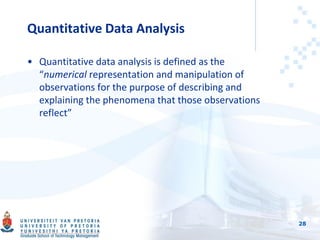
![Example of Coding
27
P 7: 2.1.docx - 7:10 [It’s very good, we’ve got pre-..] (107:107)
(Super)
Codes: [Camp Facilities]
It’s very good, we’ve got pre-fab accommodation. Concrete floors,
porcelain toilets and hand basins, running hot and cold water, glass-
enclosed showers, air-conditioning everywhere, windows with fly
netting on, lockable doors, just like a little bungalow at a university
hostel. Double bed, file cabinet, lamp.](https://image.slidesharecdn.com/lecture4datagatheringandanalysis-230107062334-1152828c/85/Lecture_4_Data_Gathering_and_Analysis-pdf-27-320.jpg)