What is Research?
•Research is the systematic process of
collecting and analyzing information to
increase our understanding of the
phenomenon under study. It is the
function of the researcher to contribute
to the understanding of the
phenomenon and to communicate that
understanding to others.
2
3.
What is QualitativeResearch?
• … qualitative researchers study things
in their natural settings, attempting to
make sense of or interpret phenomenon
in terms of the meanings people bring to
them.” (Denzin & Lincoln, 2000, p.3)
3
4.
Considerations in Sampling
•Purpose of qualitative research
– Produce information-rich data
– Depth rather than breadth
– Insight rather than generalisation
• Conceptual rather than numerical
considerations
– Choose information-rich sites and
respondents
4
5.
Common Sampling Approaches
•Purposive sampling
– Not haphazard
– Select information-rich cases
– Not the same as convenience sampling
• Heterogenous sampling
– Sample people with diverse characteristics
to see whether there are common patterns
5
6.
Interviewing
• Purpose ofinterviews
– Elicit feelings
– Thoughts
– Opinions
– Previous experiences
– The meaning people give to certain events
6
7.
Types of Interviews
•Informal (conversational) interviewing
• General interview guide (semi-
structured) approach
• Standardized and structured open-
ended interviewing
• Closed fixed-response interviewing
• Combination of approaches
7
8.
Types of InterviewQuestions
• Experience and behavior questions
• Opinion and value questions
• Feeling questions
• Knowledge questions
• Background/demographic questions
8
9.
Key Issues AboutInterviewing
• Making the appointments for the interviews
• The location of the interviews
• The preparation of the interviews
- Level of knowledge expected from the interviewer
- Level of knowledge expected from the interviewees
- Amount of information supplied to the interviewees
• The planning of the interview topics / questions
- Opening / Prior explanations
- The interview questions themselves
• Attentive listening skills
• Recording the interviews
• Transcribing the interviews
9
10.
Case Study Approach
•Interest is in an individual case rather than in
a method of inquiry
• Data may be quantitative or qualitative
• Focus on what can be learned from the
individual case
• A ‘case’ may be simple or complex
– A single employee
– A department or an organization
10
11.
Types of CaseStudy
• Intrinsic
– The case itself is of interest
• Instrumental case study
– A particular case is studied to provide insight into
an issue or to refine a theory
• Collective case study
– A number of cases are studied jointly in order to
investigate a phenomenon (instrumental study
extended to several cases)
11
12.
Analyzing Qualitative Data
Basedon:
• meanings expressed through word
• non-standardized data requiring classification
into categories
• analysis conducted through the use of
conceptualization
12
13.
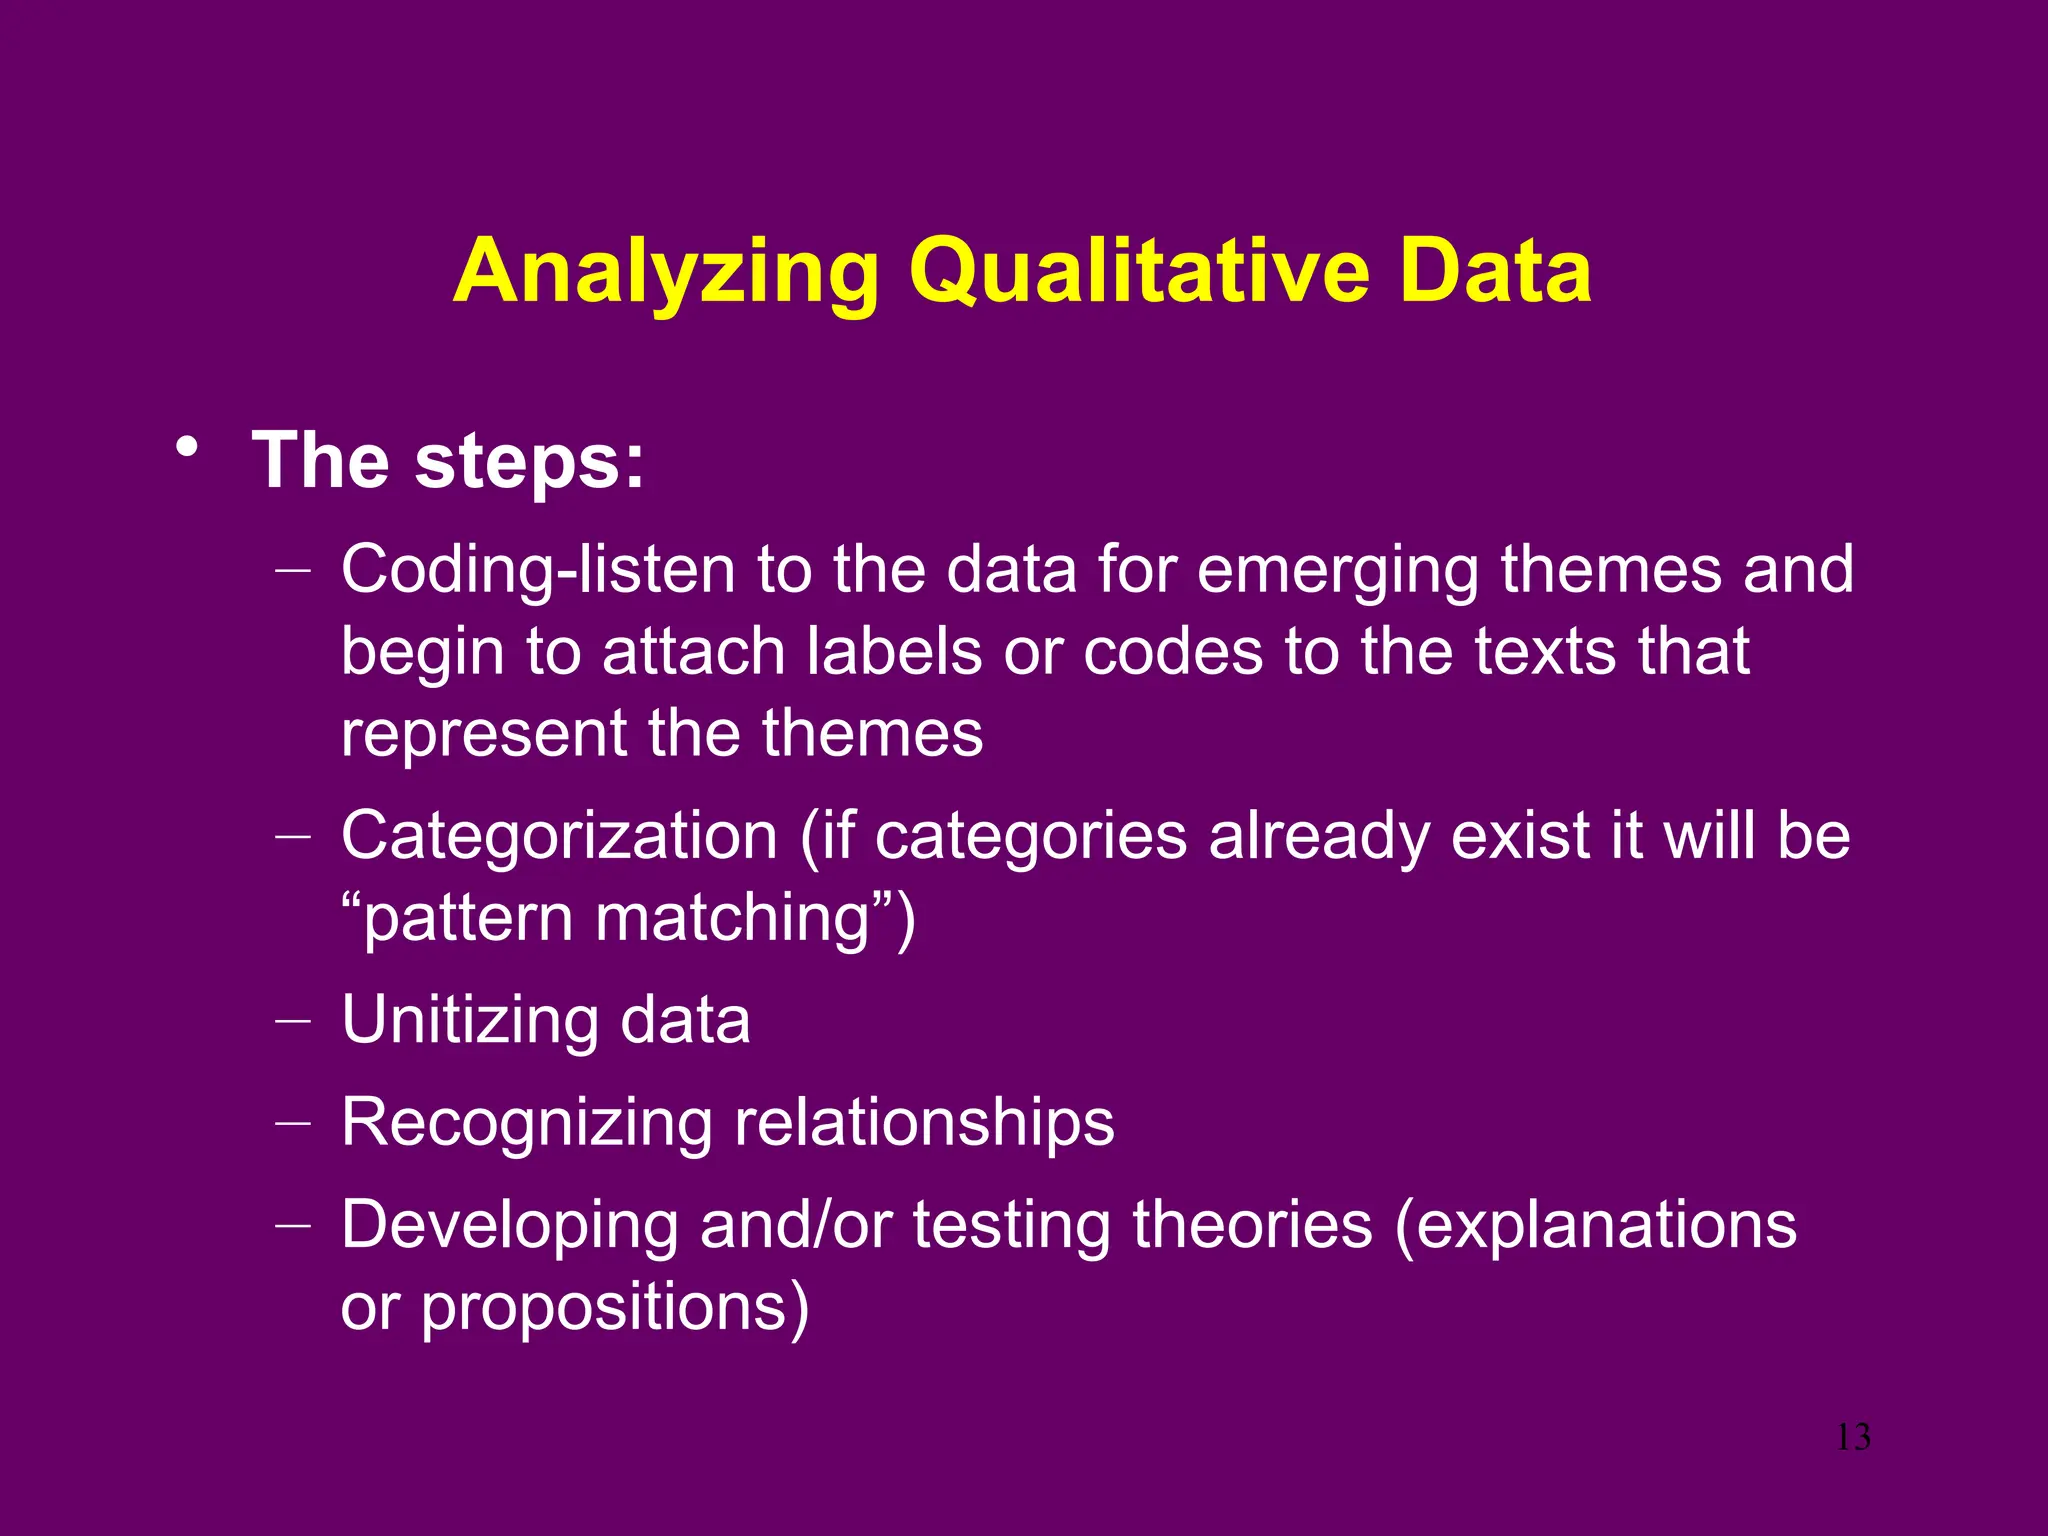
Analyzing Qualitative Data
•The steps:
– Coding-listen to the data for emerging themes and
begin to attach labels or codes to the texts that
represent the themes
– Categorization (if categories already exist it will be
“pattern matching”)
– Unitizing data
– Recognizing relationships
– Developing and/or testing theories (explanations
or propositions)
13
14.
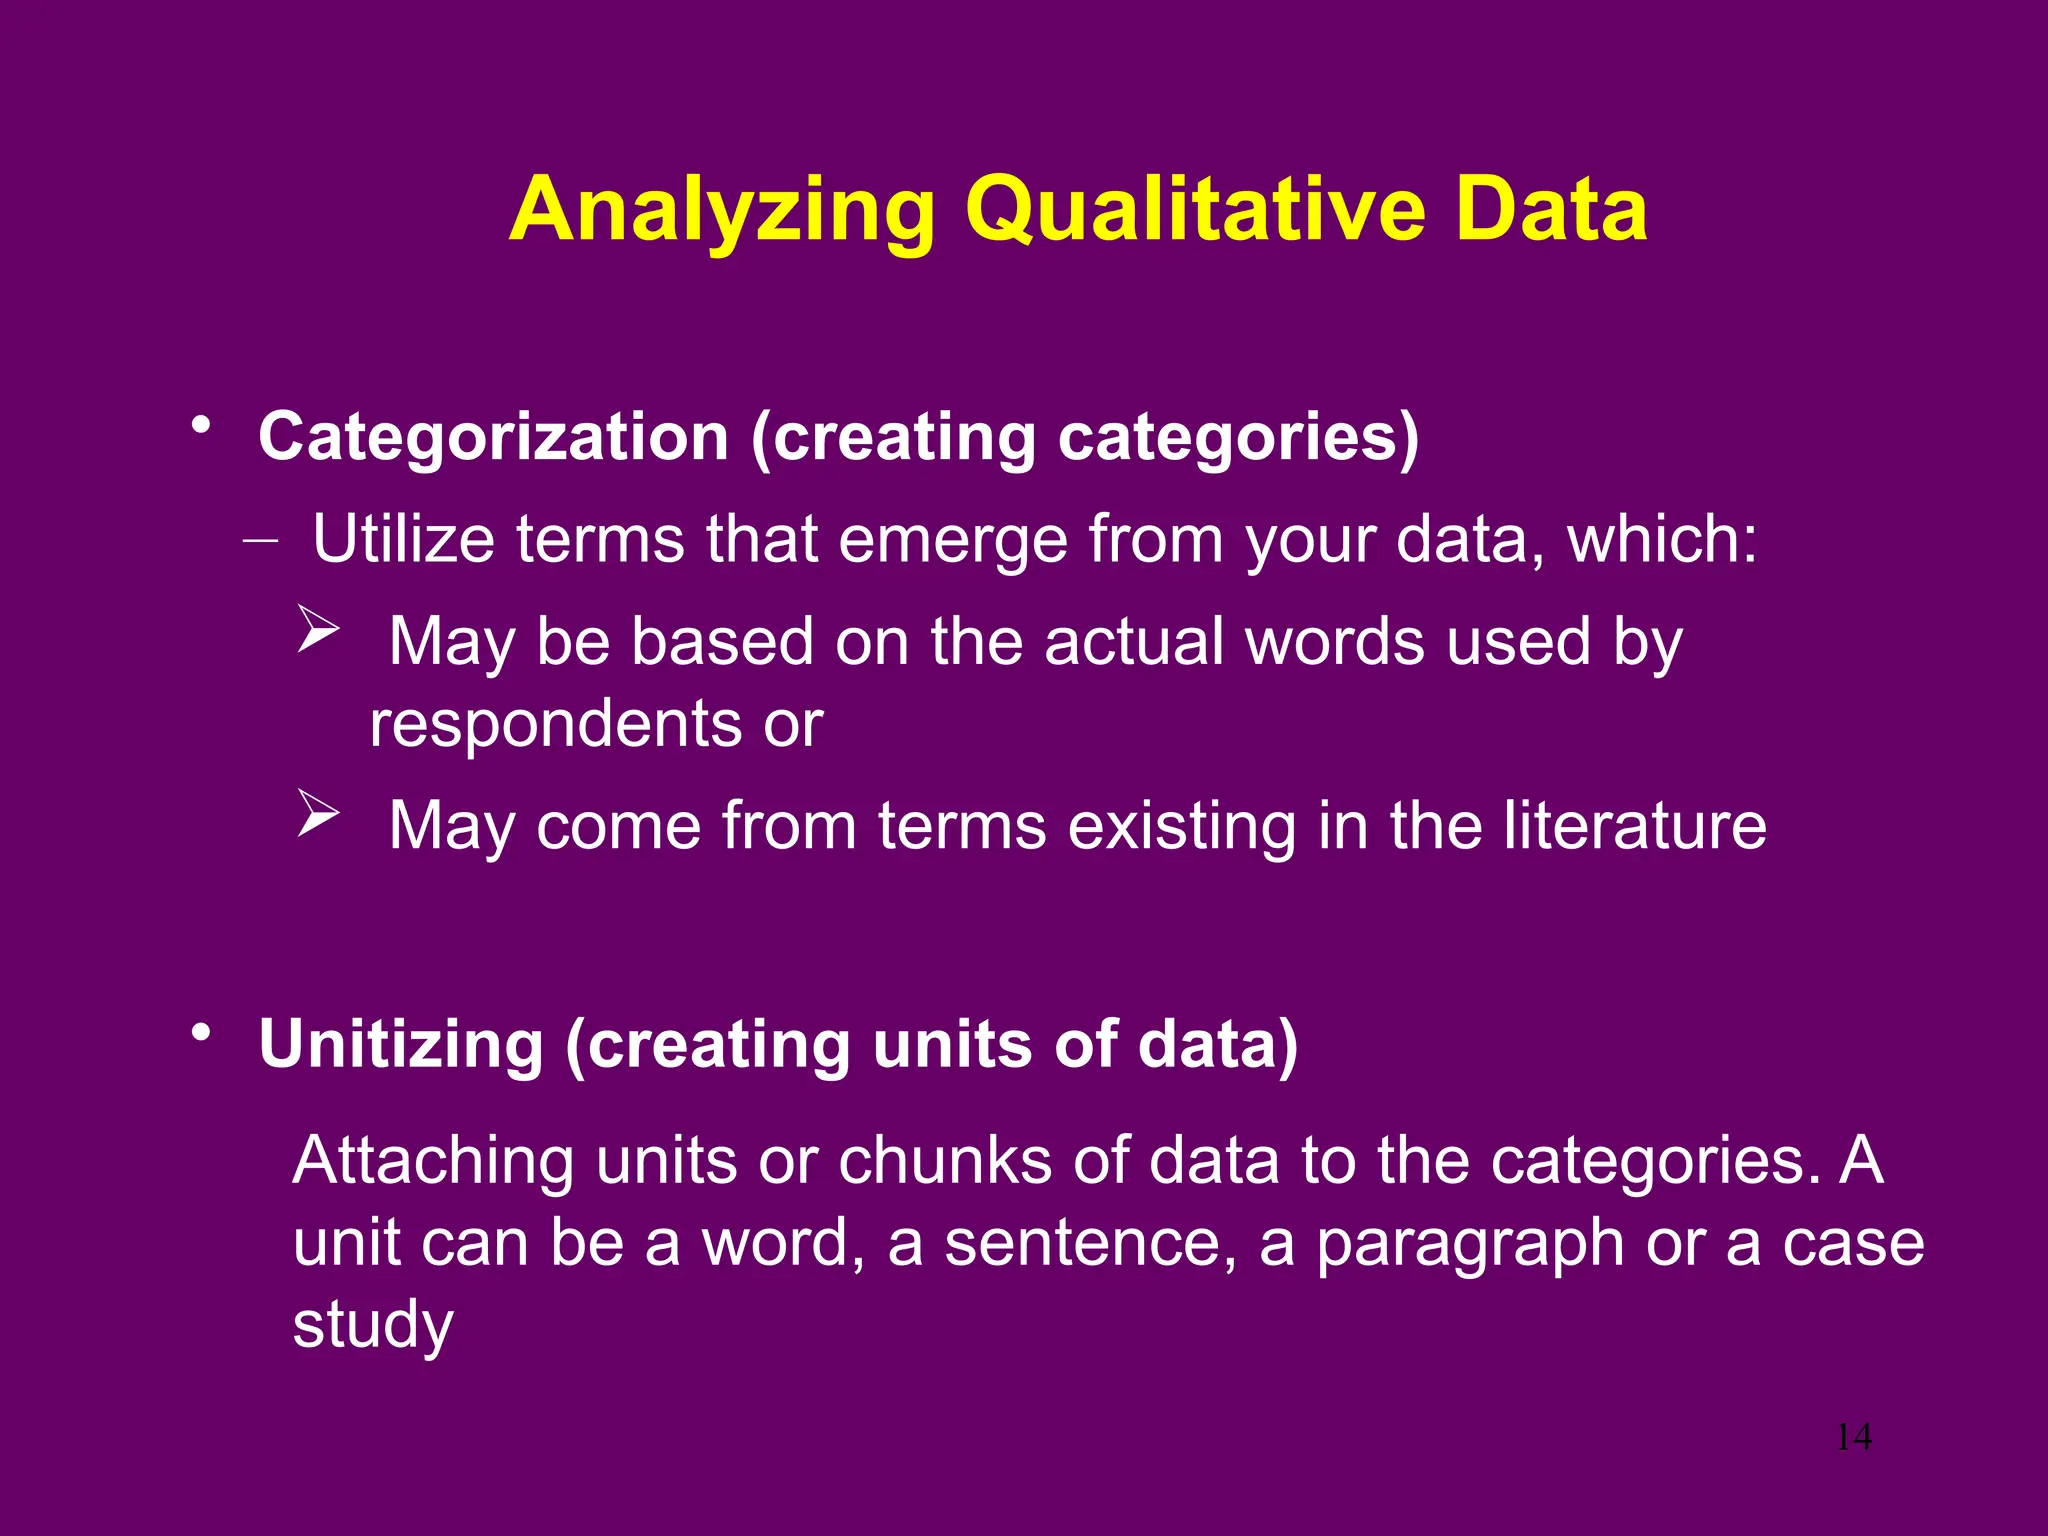
Analyzing Qualitative Data
•Categorization (creating categories)
– Utilize terms that emerge from your data, which:
May be based on the actual words used by
respondents or
May come from terms existing in the literature
• Unitizing (creating units of data)
Attaching units or chunks of data to the categories. A
unit can be a word, a sentence, a paragraph or a case
study
14
15.
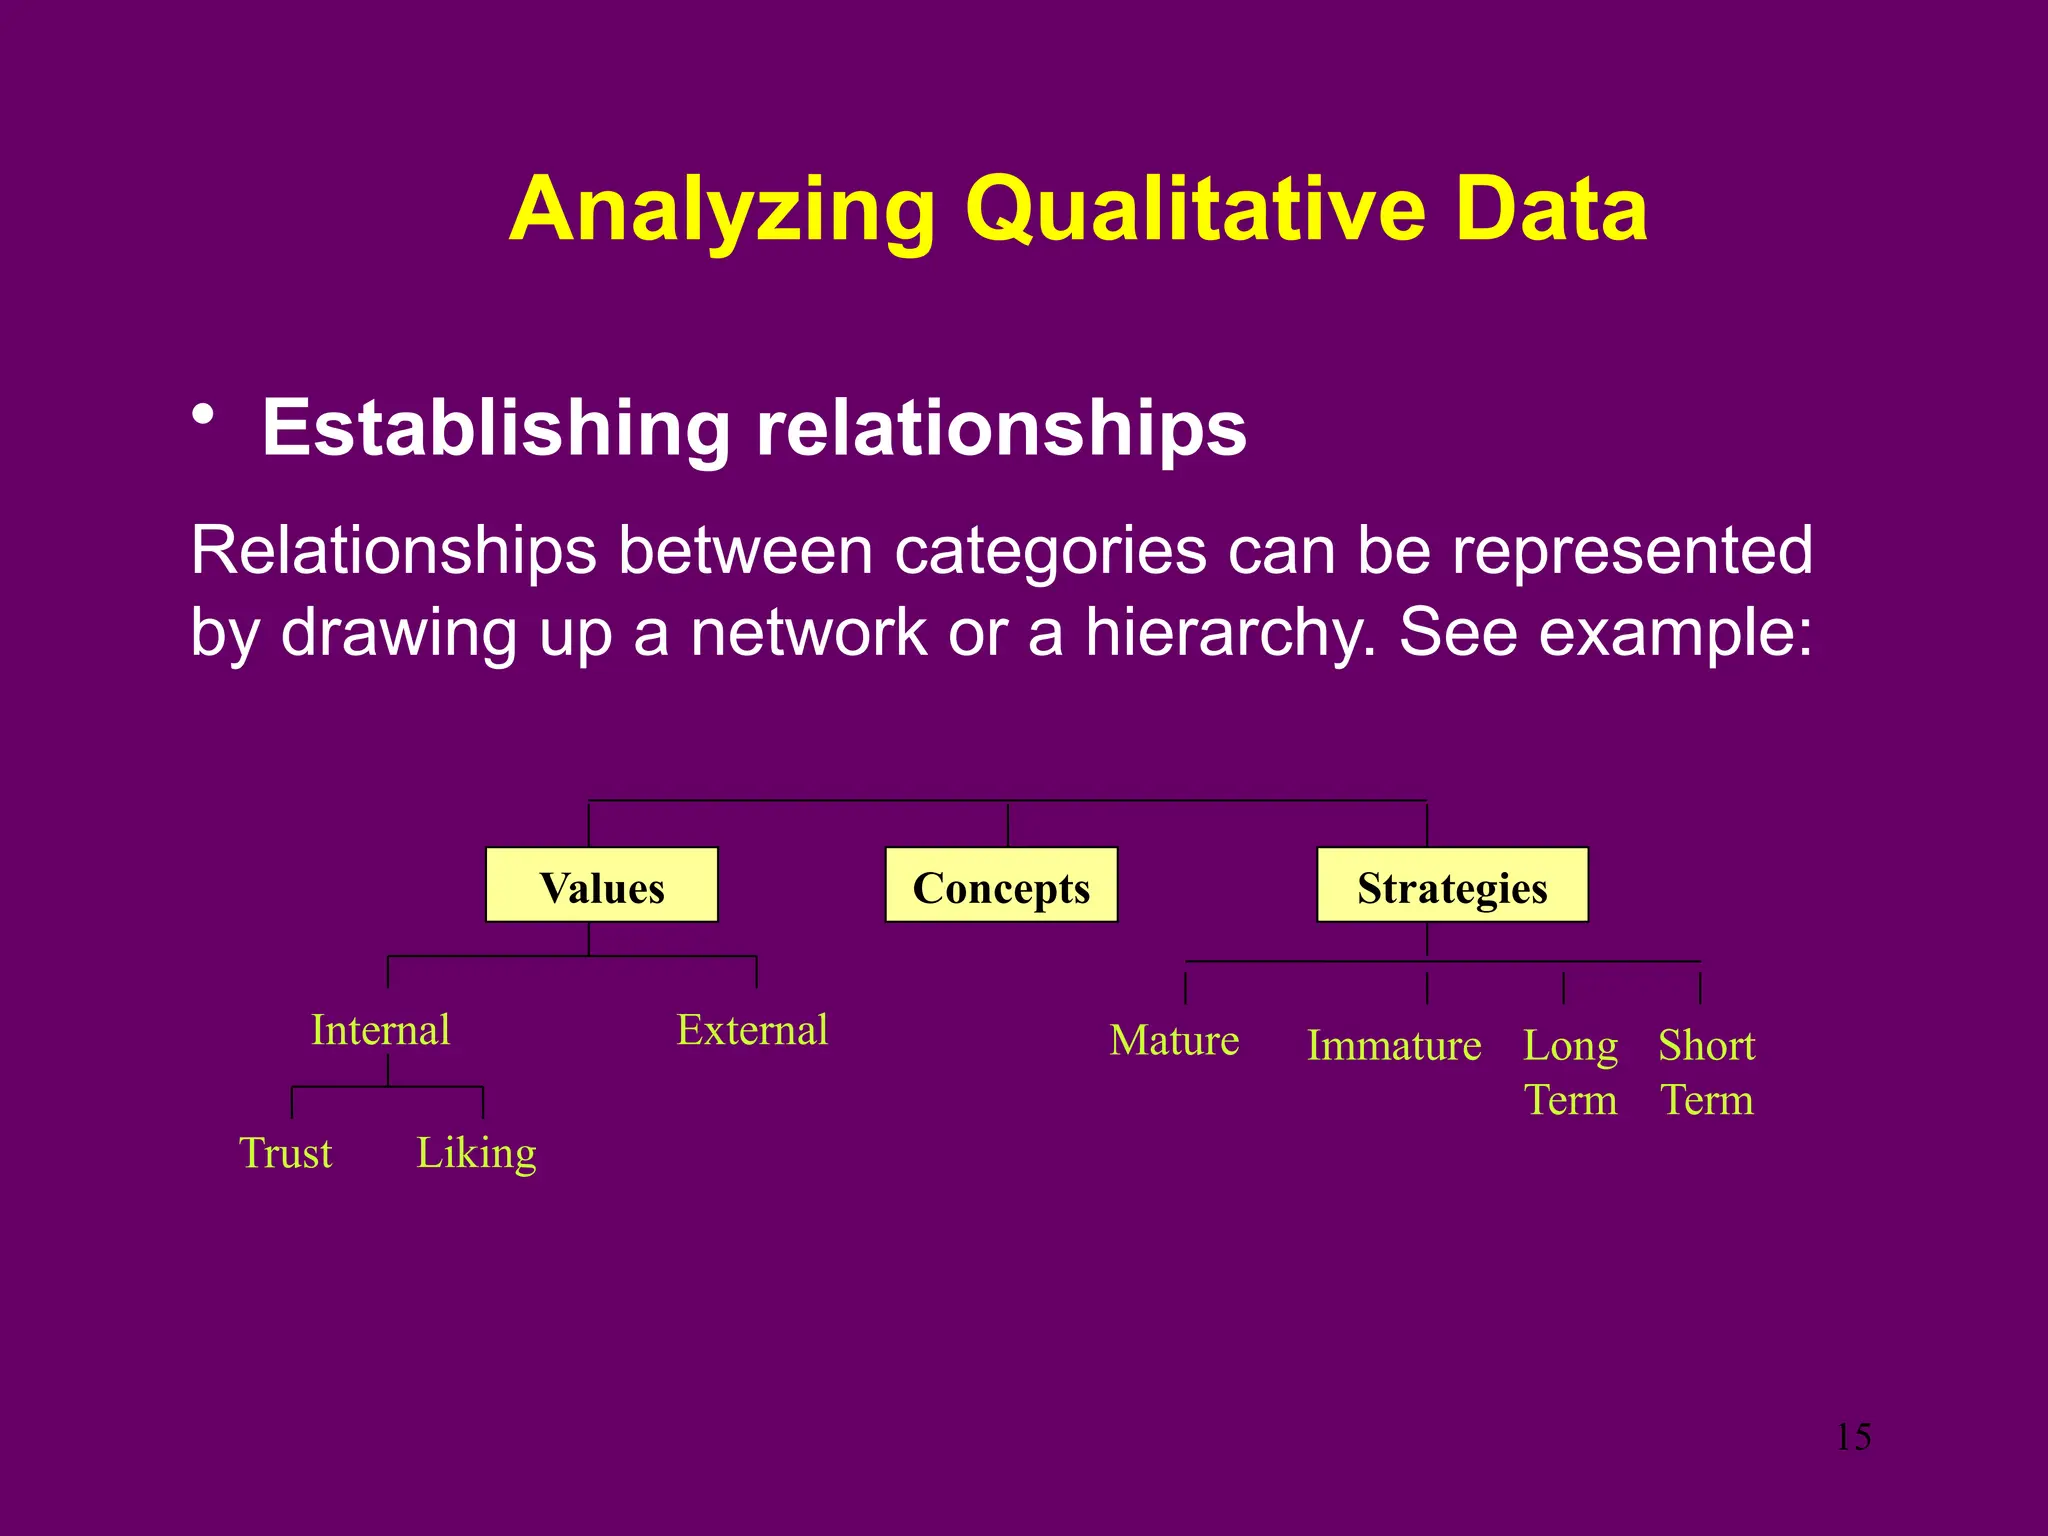
Analyzing Qualitative Data
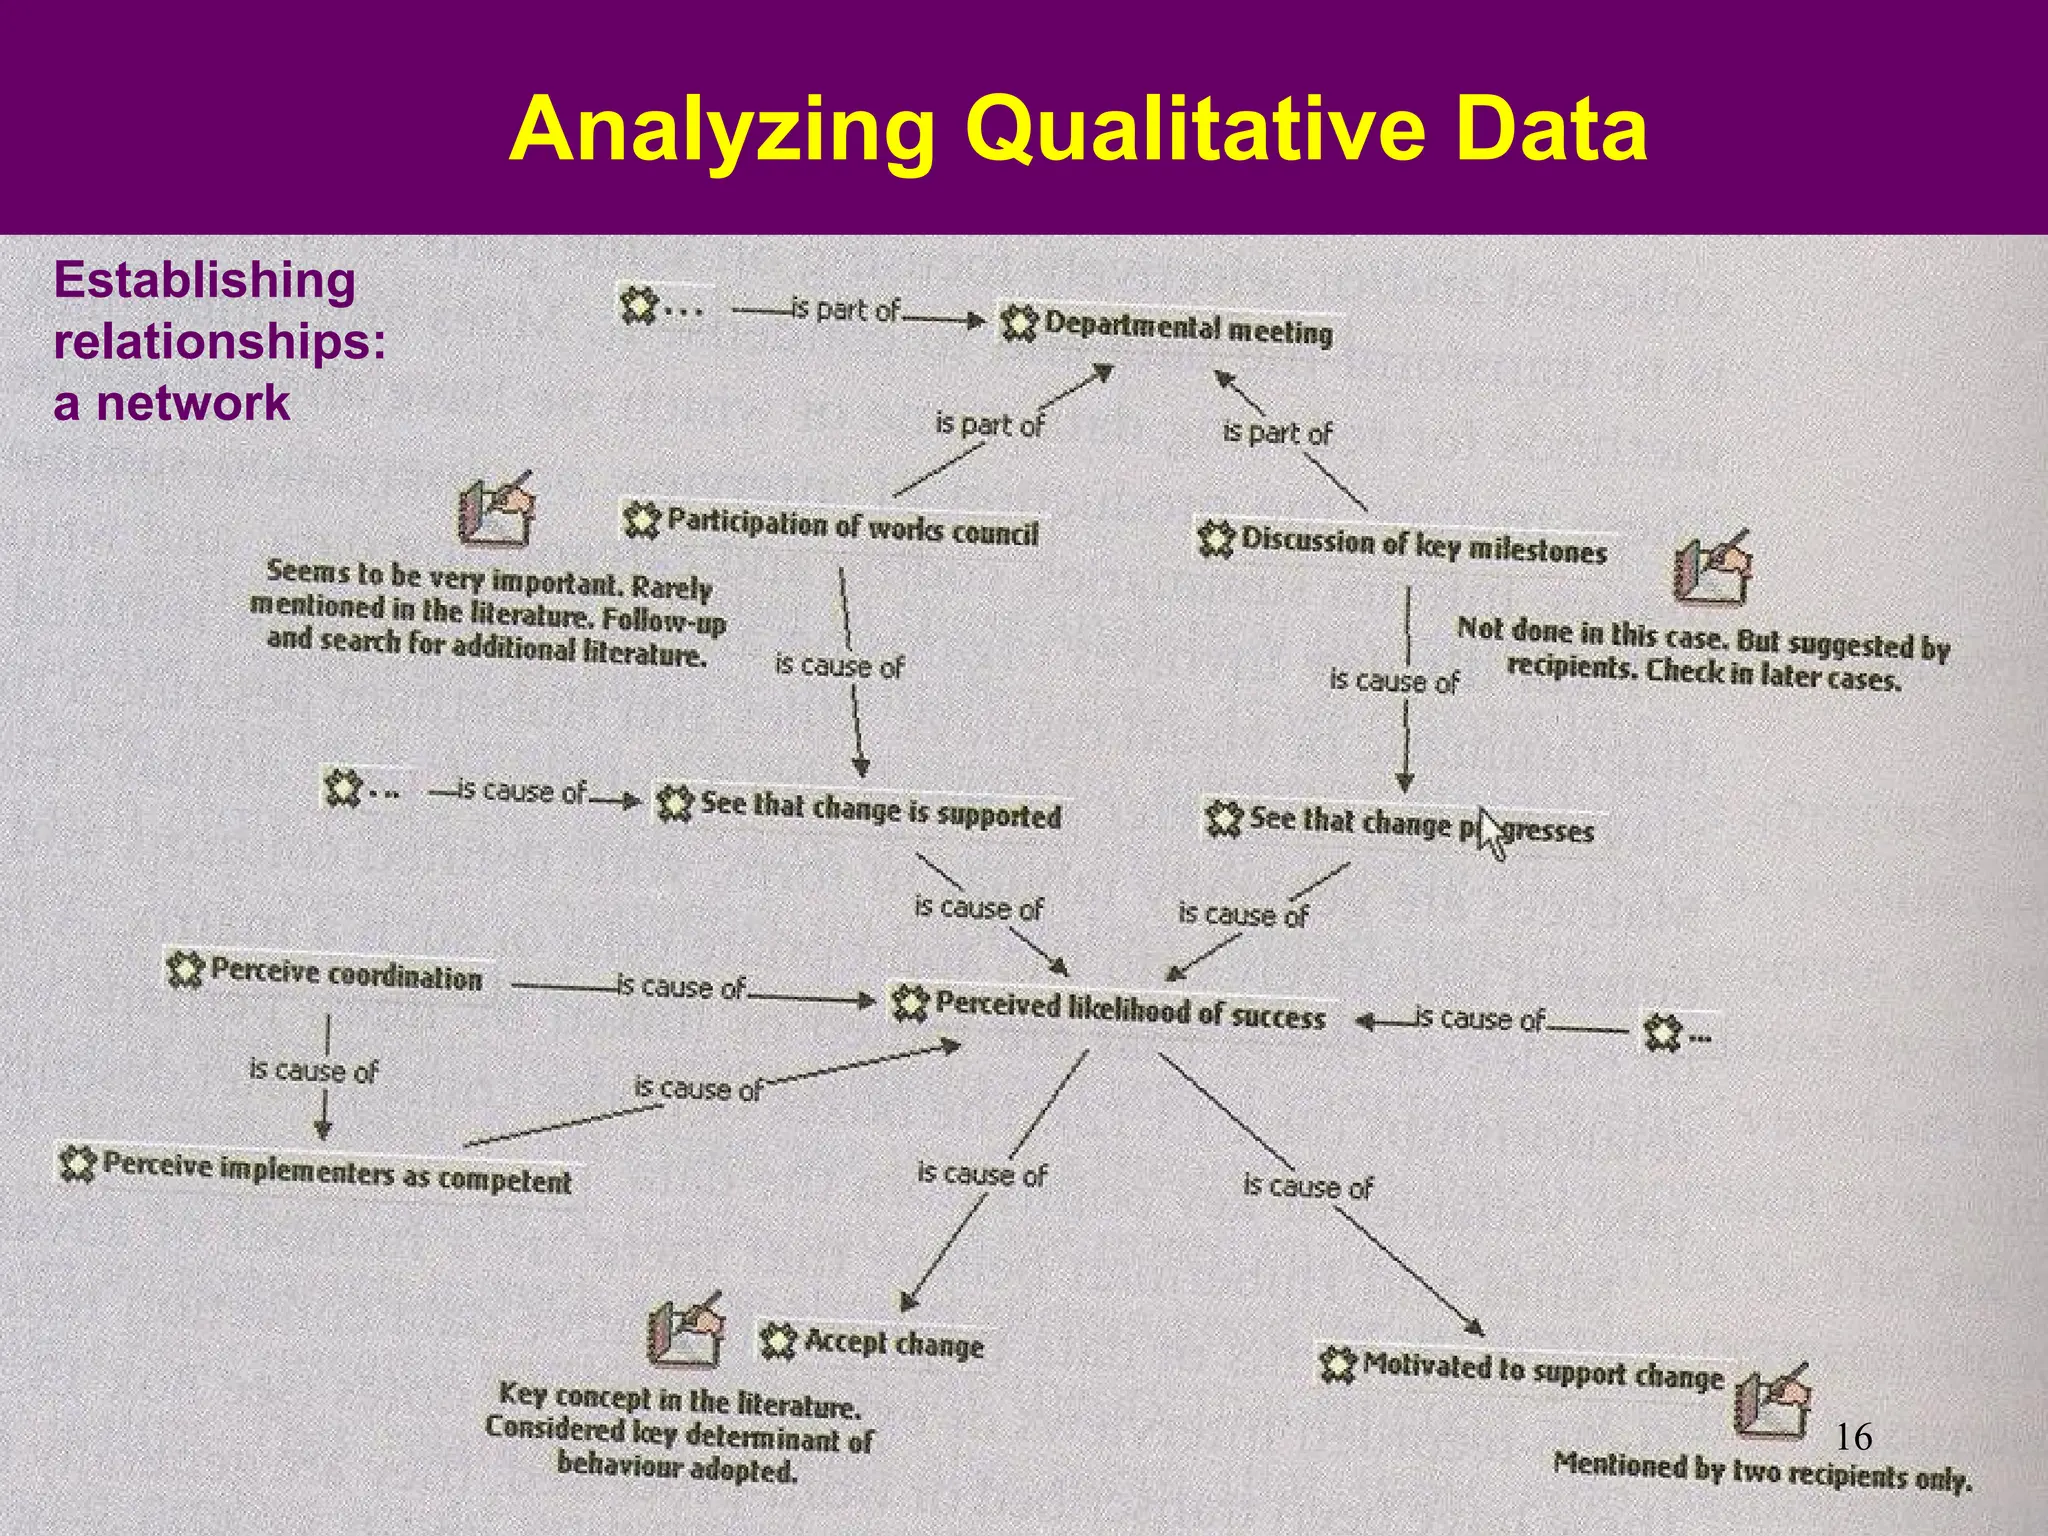
•Establishing relationships
Relationships between categories can be represented
by drawing up a network or a hierarchy. See example:
Values Strategies
Concepts
External
Internal Short
Term
Long
Term
Immature
Mature
Trust Liking
15
Analyzing Qualitative Data
•Developing and/or testing theories,
models, explanations or propositions
The appearance of an apparent relationship or connection
between categories will need to be tested if you are to conclude
that there is an actual relationship.
Such testing is not statistical but it is done through seeking
alternative explanations
Software tools for qualitative analysis:
• E.g. NVivo, Leximancer , NUD*IST
17
18.
Stages in QualitativeData Analysis
• Qualitative data analysis is a non-linear /
iterative process
– Numerous rounds of questioning,
reflecting, rephrasing, analysing,
theorising, verifying after each observation,
interview, or focus group discussion
18
19.
Stages in QualitativeData Analysis
• During data collection
– Reading – data immersion – reading and
re-reading
– Coding – listen to the data for emerging
themes and begin to attach labels or codes
to the texts that represent the themes
19
20.
Stages in QualitativeData Analysis
• After data collection
– Displaying – the themes (all information)
– Developing hypotheses, questioning and
verification
– Reducing – from the displayed data identify
the main points
20
21.
Stages in QualitativeData Analysis
• Interpretation (2 levels)
– At all stages – searching for core meanings
of thoughts, feelings, and behaviours
described
– Overall interpretation
• Identify how themes relate to each other
• Explain how study questions are
answered
• Explain what the findings mean beyond
the context of your study
21
22.
Processes in QualitativeData Analysis
1. Reading / Data immersion
– Read for content
• Are you obtaining the types of
information you intended to collect
• Identify emergent themes and develop
tentative explanations
• Note (new / surprising) topics that need
to be explored in further fieldwork
22
23.
– Read notingthe quality of the data
• Have you obtained superficial or rich and deep
responses?
• How vivid and detailed are the descriptions of
observations?
• Is there sufficient contextual detail?
• Problems in the quality of the data require a
review of:
– How you are asking questions (neutral or
leading)
– The venue
– The composition of the groups
– The style and characteristics of the
interviewer
– How soon after the field activity are notes
recorded
• Develop a system to identify problems in the
data (audit trail)
23
24.
- Read identifyingpatterns
- After identifying themes, examine how these
are patterned
– Do the themes occur in all or some of the
data?
– Are their relationships between themes?
– Are there contradictory responses?
– Are there gaps in understanding – these
require further exploration?
24
25.
2. Coding –
•No standard rules of how to code
– Emergent
– Borrowed
• Record coding decisions
– Record codes, definitions, and revisions
• Usually - insert codes / labels into the margins
• Building theme related files
– Cut and paste together into one file similarly
coded blocks of text
– Note: identifiers that help you to identify the
original source
• Identify sub-themes and explore them in greater
depth
25
26.
3. Displaying data
–Capture the variation or richness of each
theme
– Note differences between individuals and
sub-groups
– Return to the data and examine evidence
that supports each sub-theme
26
27.
4. Developing hypotheses,questioning and
verification
– Extract meaning from the data
– Do the categories developed make sense?
– What pieces of information contradict my
emerging ideas?
– What pieces of information are missing or
underdeveloped?
– What other opinions should be taken into
account?
– How do my own biases influence the data
collection and analysis process?
27
28.
5. Data reduction
i.e.distill the information to make visible the
most essential concepts and relationships
– Get an overall sense of the data
– Distinguish primary/main and secondary/
sub-themes
– Separate essential from non-essential data
– Use visual devices – e.g. matrices, diagrams
28
29.
6. Interpretation
i.e. identifyingthe core meaning of the data,
remaining faithful to the perspectives of
the study participants but with wider social
and theoretical relevance
– Credibility of attributed meaning
• Consistent with data collected
• Verified with respondents
• Present multiple perspectives (convergent
and divergent views)
• Did you go beyond what you expected to
find?
29