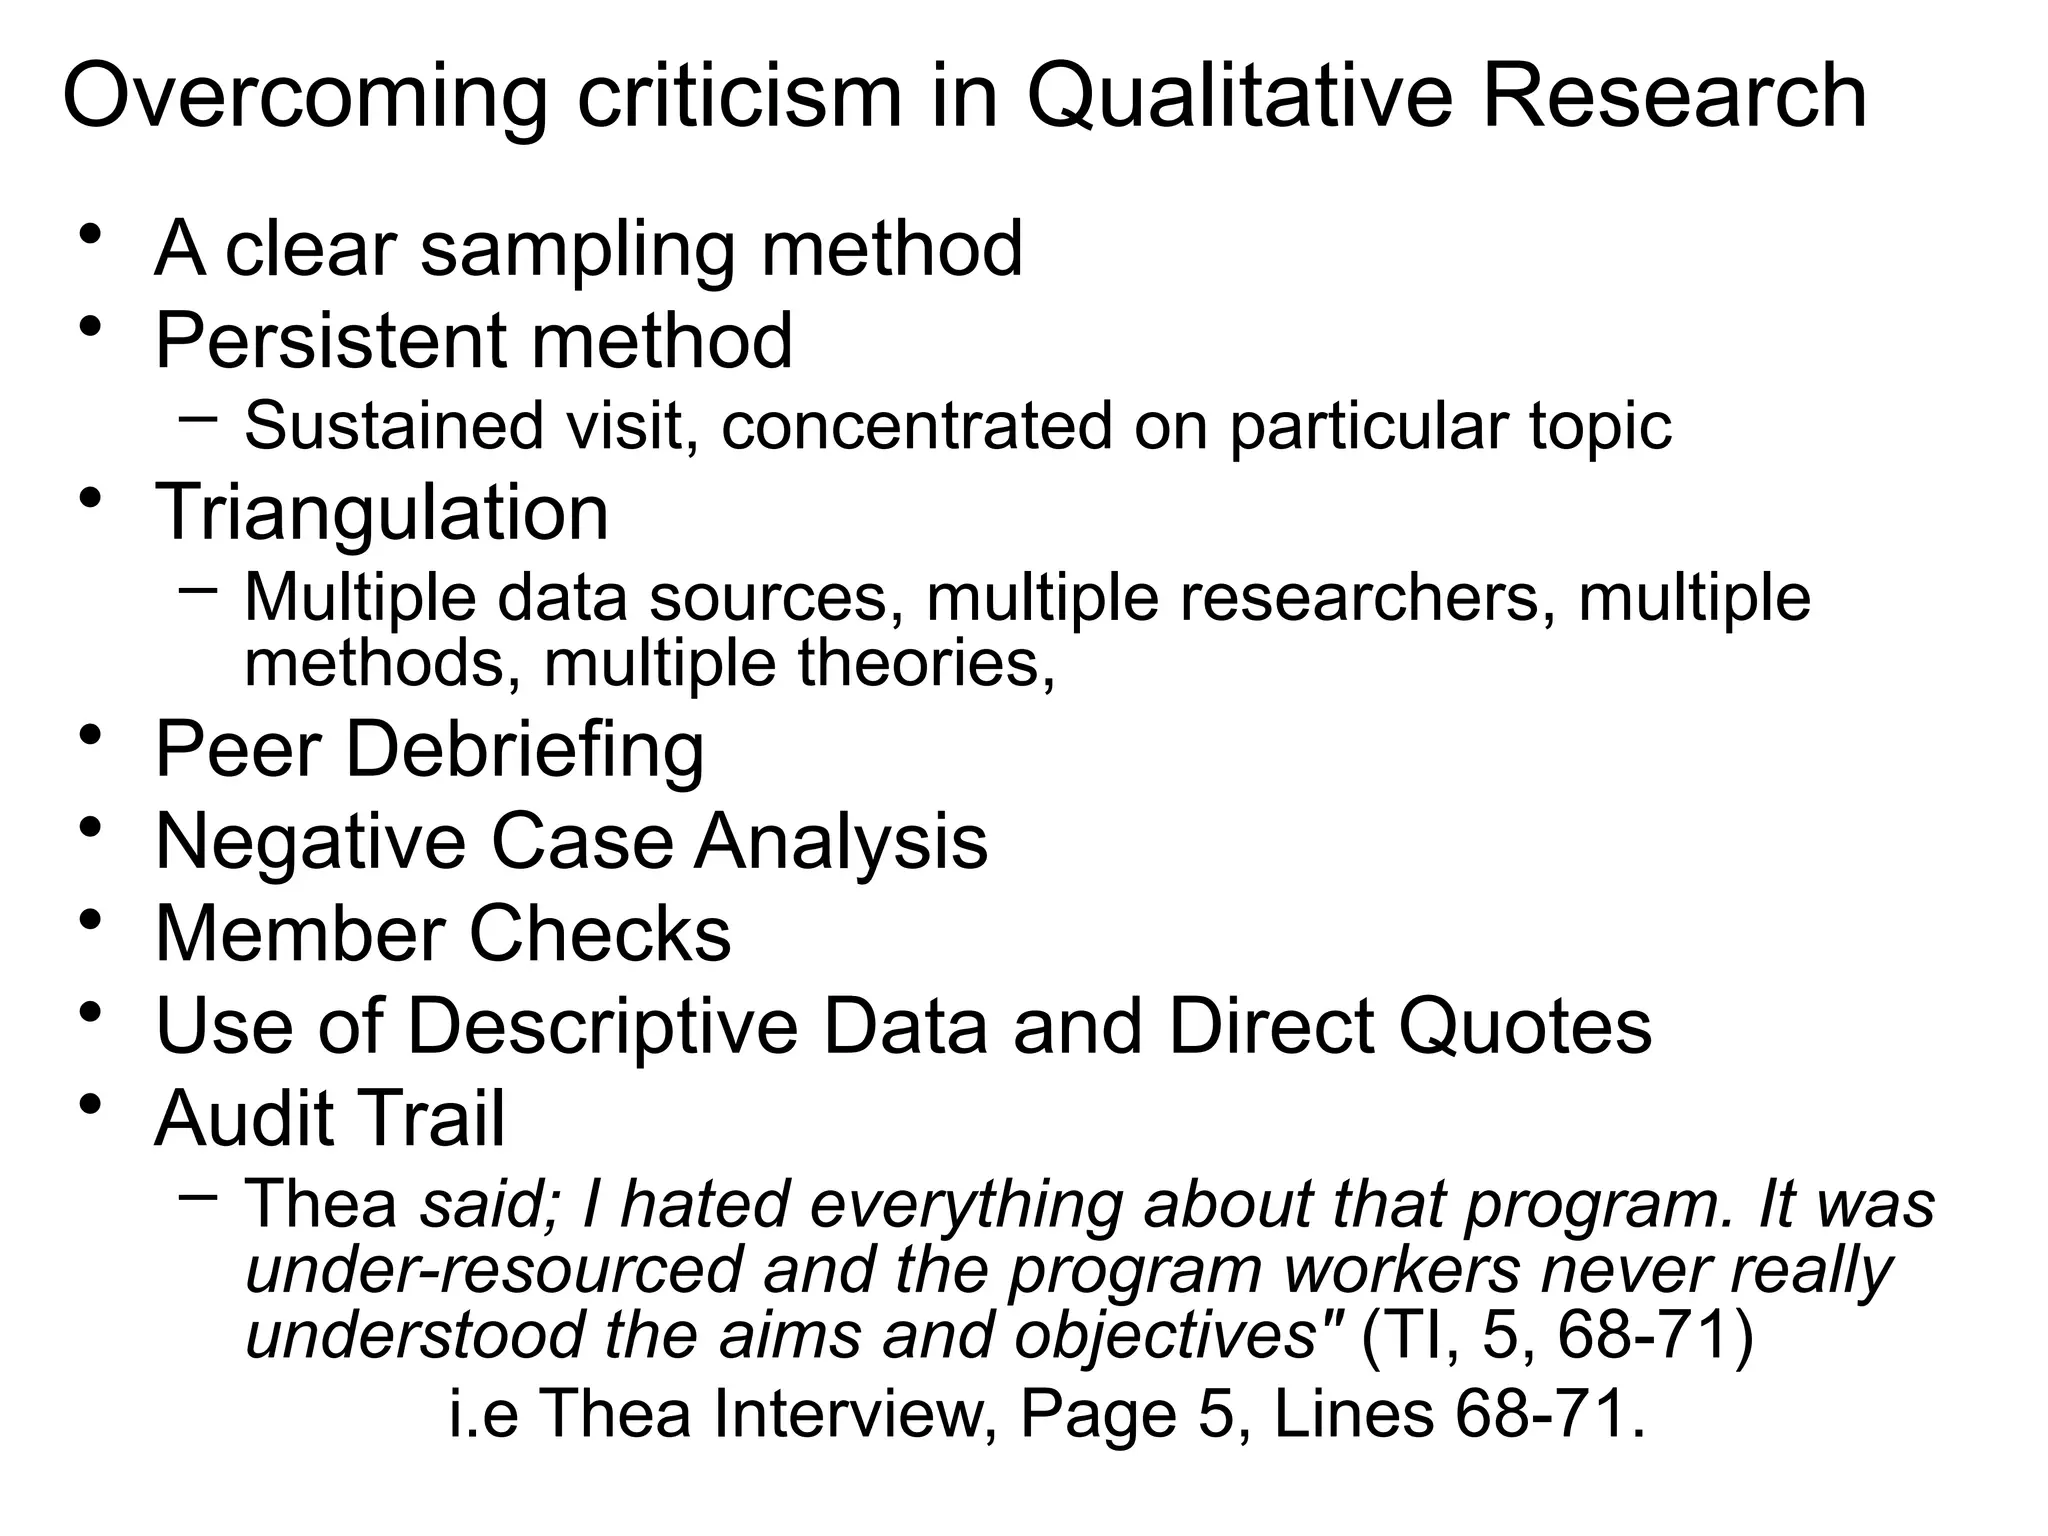
Analyzing Qualitative Data
Don’t do qualitative because
• You fear maths or numbers
• You think it is easier, it is not!
When to use
• Theory doesn’t lend itself to surveys or experiments
(ethnomethodology, post modernism)
• Concept/theory not developed enough to hypothesize
• No concepts/theory to build questions or design
• Your values/beliefs on human nature/behavior fits
qualitative
• RQs not suited to for surveys or experiments
• Need to learn about meanings, feelings, why’s, lives
Focal Points of QR
What
people
say
Culture
Mean,
Need
Desire
What
People
do
Ereaut, 2007
Data Management - Issues
Criteria for Judging
Quantitative
Alternative Criteria for
Judging Qualitative
Internal validity Credibility
External validity Transferability
Reliability Dependability
Objectivity Confirmability
Credibility
• Results are credible or believable from the
perspective of the participant in the
research
• The participants are the only ones who
can legitimately judge the credibility of the
results
Transferability
• Degree to which the results can be
generalized or transferred to other
contexts or settings
Dependability
• Emphasizes the need for the researcher to
account for the ever-changing context within
which research occurs.
• Research is responsible for describing the
changes and how these changes affect the
research
Conformability
• Refers to the degree to which the results could
be confirmed or corroborated by others.
• Strategies
– Documentation of the procedures for checking and
rechecking the data throughout the study
– Another researcher can take a “devil’s advocate” role
– Data audit
– Establish audit trail
Overcoming criticism in Qualitative Research
• A clear sampling method
• Persistent method
– Sustained visit, concentrated on particular topic
• Triangulation
– Multiple data sources, multiple researchers, multiple
methods, multiple theories,
• Peer Debriefing
• Negative Case Analysis
• Member Checks
• Use of Descriptive Data and Direct Quotes
• Audit Trail
– Thea said; I hated everything about that program. It was
under-resourced and the program workers never really
understood the aims and objectives" (TI, 5, 68-71)
i.e Thea Interview, Page 5, Lines 68-71.
• Everyday Information-
– descriptions
program settings including physical
environment
people involved/social environment
what people do
events (structured and unplanned)
time
non-verbal cues
things lacking (what is not said/done)
What data should be collected?
Cont’n
Cont’n
• Interesting Quotes/Conversations Pertinent to
the Question
– These need to be collected to use in reports later and
to record special program terminology/jargon
In addition it is necessary to add;
• Issues to do with the Data Collection
Method/Methodology in general
• Feelings, Emotions, Hunches and Impressions
(These are the basis of initial theories).
Data Analysis
• On-going and iterative
• Interim analysis – until the topic is understood
(until you run out of time or resources)
• No single way to gain understanding of
phenomena
• Numerous ways to report data
• Researcher’s language create reality
• What is understood is mot neat, linear, or fixed
• Researcher is inter-related with what and who is
studied
When to start analyzing?
• First interaction between the researcher
and the participants
– Have a clear sense of the RQs
– Write memos while collecting data
– Use metaphors, analogies, and visual devices
Steps….
• 1. Data Management
– Creating organizing data collected
– Check data for completeness
• Write dates on all notes
• Sequence all notes with labels
• Label notes according to type
• Make two photocopies of all notes
• Read through data to be sure they are legible
• Note potential themes and patterns
• 2. Reading and Memoing
– To get an initial sense of the data
– Reading field notes, transcripts, memo’s,
observer’s comments
• 3. Describing context and participants
– What is going on in the setting and among
participants?
– Separate and group pieces of data related to
different aspects of the setting, events, and
participants
Keeping notes organized
Ways to examine Qualitative Data
– Frequencies – how often does a certain phenomenon
or thing occur?
– Magnitudes – how intense or how much does the
phenomenon happen?
– Structures – what are the various types of the
phenomenon under study?
– Processes – is there order among the elements of
structure? Is there escalation?
– Causes – what cause the phenomenon under study?
– Consequences – what, if any, consequences are
there to the phenomenon
• 4. Classifying and Interpreting
– Breaking down data into small units
– Determining the importance of units
– Putting pertinent units together in a general
interpreted form
Categorizing data and noting patterns
Categories
• Miles and
Huberman
– Participant acts
– Activities
– Participant
meanings
– Relationship
among
participants
– setting
• Bogdan and Biklen
– Research setting
– Perspectives of
participants
– Participants’ way of
thinking
– Regularly occurring
activities
– Infrequently
occurring activities
– Methods
Categories – cont’d
• Process for identifying
– Rely on the RQs/ focus for initial ideas
– Identify themes or issues that cut across filed
notes
– Observer comments or memos
– Reflections
– Anomalies
– Commonalities
– Metaphors used
Example: What are some specific problems
needing action in USeP? Try to categorize
• More training is needed at all levels
• Too many signatures are required
• We need more computers
• There is a lack of attention to individual needs
• There is a lot of “us” and “we” sentiments
• There is not enough space for everyone
• We need more objective performance appraisal
• Training is needed for newly hired employees
• There is favoritism and preferential treatment of staff
• There is too much gossiping and criticizing
• There is a lot of overlapping and redundancy
• We need more objective recruitment and hiring
standards
Categories Responses
Management Issues There is a lack of attention to individual needs
There is a favoritism and preferential treatment of staff
Physical Environment We need more computers
There is not enough space for everyone
Personnel Practices We need more objective recruitment and hiring….
We need objective performance appraisal
Staff Development More training is needed at all levels
Training is needed for newly hired staff
Interpersonal There is a lot of “us” and “we” sentiments
There is too much gossiping and criticizing
Work structure Too many signatures are required
There is a lot of overlapping and redundancy
Noting Patterns
• 1. variable oriented analysis – aim to
provide a partial, general explanation
using relatively few variables (nomothetic)
• 2. case oriented analysis – examine one
case (idiographic)
• 3. cross case analysis – examines other
cases or subjects very intensely
• Link between 2 or more categories
• Primary basis for reporting
3 analytic strategies
• 1. negative case
– Examine data that contradicts an emerging
category
– Provides a different perspective
– Provides an important check to balance the
tendency to stay with first impressions
• 2. Analytic Induction
– Examine data to develop or test a theory
– Steps
• Start with preliminary focus or explanation of a
phenomenon
• Develop a hypothesis that explains data
• Collect data to test the hypothesis
• Accept or reformulate the hypothesis
– Data are continuously gathered until no
contradictory data are found
• 3. Constant comparison
– Constantly comparing identified ideas and
concepts to determine their distinctive
characteristics so they can be placed in
different appropriate categories
– Iterative in nature
– Ongoing throughout the research process
Title Form of Relationship
1. Strict Inclusion X is a kind of Y
2. Spatial X is a place in Y; X is a part of Y
3. Cause-effect X is a result of Y; X is a cause of Y
4. Rationale X is a reason for doing Y
5. Location for action X is a location for doing Y
6. Function X is used for Y
7. Means-end X is a way to do Y
8. Sequence X is a step (stage) in Y
9. Attribution X is an attribute (characteristic) of Y
Insights into interpretation
• Reflective, integrative, and explanatory
• Based heavily on connection, common
aspects, and linkages among data,
categories, and patterns
• Interpretation makes explicit the
conceptual basis of the categories and
patterns
3 Guiding Questions
• What is important in the data?
• Why is it important?
• What can be learned from it?

QUALITATIVE RESEARCH presentation 5.pptx

  • 1.
  • 2.
    Don’t do qualitativebecause • You fear maths or numbers • You think it is easier, it is not! When to use • Theory doesn’t lend itself to surveys or experiments (ethnomethodology, post modernism) • Concept/theory not developed enough to hypothesize • No concepts/theory to build questions or design • Your values/beliefs on human nature/behavior fits qualitative • RQs not suited to for surveys or experiments • Need to learn about meanings, feelings, why’s, lives
  • 3.
    Focal Points ofQR What people say Culture Mean, Need Desire What People do Ereaut, 2007
  • 4.
    Data Management -Issues Criteria for Judging Quantitative Alternative Criteria for Judging Qualitative Internal validity Credibility External validity Transferability Reliability Dependability Objectivity Confirmability
  • 5.
    Credibility • Results arecredible or believable from the perspective of the participant in the research • The participants are the only ones who can legitimately judge the credibility of the results
  • 6.
    Transferability • Degree towhich the results can be generalized or transferred to other contexts or settings Dependability • Emphasizes the need for the researcher to account for the ever-changing context within which research occurs. • Research is responsible for describing the changes and how these changes affect the research
  • 7.
    Conformability • Refers tothe degree to which the results could be confirmed or corroborated by others. • Strategies – Documentation of the procedures for checking and rechecking the data throughout the study – Another researcher can take a “devil’s advocate” role – Data audit – Establish audit trail
  • 8.
    Overcoming criticism inQualitative Research • A clear sampling method • Persistent method – Sustained visit, concentrated on particular topic • Triangulation – Multiple data sources, multiple researchers, multiple methods, multiple theories, • Peer Debriefing • Negative Case Analysis • Member Checks • Use of Descriptive Data and Direct Quotes • Audit Trail – Thea said; I hated everything about that program. It was under-resourced and the program workers never really understood the aims and objectives" (TI, 5, 68-71) i.e Thea Interview, Page 5, Lines 68-71.
  • 9.
    • Everyday Information- –descriptions program settings including physical environment people involved/social environment what people do events (structured and unplanned) time non-verbal cues things lacking (what is not said/done) What data should be collected?
  • 10.
  • 11.
    Cont’n • Interesting Quotes/ConversationsPertinent to the Question – These need to be collected to use in reports later and to record special program terminology/jargon In addition it is necessary to add; • Issues to do with the Data Collection Method/Methodology in general • Feelings, Emotions, Hunches and Impressions (These are the basis of initial theories).
  • 12.
    Data Analysis • On-goingand iterative • Interim analysis – until the topic is understood (until you run out of time or resources) • No single way to gain understanding of phenomena • Numerous ways to report data • Researcher’s language create reality • What is understood is mot neat, linear, or fixed • Researcher is inter-related with what and who is studied
  • 13.
    When to startanalyzing? • First interaction between the researcher and the participants – Have a clear sense of the RQs – Write memos while collecting data – Use metaphors, analogies, and visual devices
  • 14.
    Steps…. • 1. DataManagement – Creating organizing data collected – Check data for completeness • Write dates on all notes • Sequence all notes with labels • Label notes according to type • Make two photocopies of all notes • Read through data to be sure they are legible • Note potential themes and patterns
  • 15.
    • 2. Readingand Memoing – To get an initial sense of the data – Reading field notes, transcripts, memo’s, observer’s comments • 3. Describing context and participants – What is going on in the setting and among participants? – Separate and group pieces of data related to different aspects of the setting, events, and participants
  • 16.
  • 17.
    Ways to examineQualitative Data – Frequencies – how often does a certain phenomenon or thing occur? – Magnitudes – how intense or how much does the phenomenon happen? – Structures – what are the various types of the phenomenon under study? – Processes – is there order among the elements of structure? Is there escalation? – Causes – what cause the phenomenon under study? – Consequences – what, if any, consequences are there to the phenomenon
  • 18.
    • 4. Classifyingand Interpreting – Breaking down data into small units – Determining the importance of units – Putting pertinent units together in a general interpreted form Categorizing data and noting patterns
  • 19.
    Categories • Miles and Huberman –Participant acts – Activities – Participant meanings – Relationship among participants – setting • Bogdan and Biklen – Research setting – Perspectives of participants – Participants’ way of thinking – Regularly occurring activities – Infrequently occurring activities – Methods
  • 20.
    Categories – cont’d •Process for identifying – Rely on the RQs/ focus for initial ideas – Identify themes or issues that cut across filed notes – Observer comments or memos – Reflections – Anomalies – Commonalities – Metaphors used
  • 21.
    Example: What aresome specific problems needing action in USeP? Try to categorize • More training is needed at all levels • Too many signatures are required • We need more computers • There is a lack of attention to individual needs • There is a lot of “us” and “we” sentiments • There is not enough space for everyone • We need more objective performance appraisal • Training is needed for newly hired employees • There is favoritism and preferential treatment of staff • There is too much gossiping and criticizing • There is a lot of overlapping and redundancy • We need more objective recruitment and hiring standards
  • 22.
    Categories Responses Management IssuesThere is a lack of attention to individual needs There is a favoritism and preferential treatment of staff Physical Environment We need more computers There is not enough space for everyone Personnel Practices We need more objective recruitment and hiring…. We need objective performance appraisal Staff Development More training is needed at all levels Training is needed for newly hired staff Interpersonal There is a lot of “us” and “we” sentiments There is too much gossiping and criticizing Work structure Too many signatures are required There is a lot of overlapping and redundancy
  • 23.
    Noting Patterns • 1.variable oriented analysis – aim to provide a partial, general explanation using relatively few variables (nomothetic) • 2. case oriented analysis – examine one case (idiographic) • 3. cross case analysis – examines other cases or subjects very intensely • Link between 2 or more categories • Primary basis for reporting
  • 24.
    3 analytic strategies •1. negative case – Examine data that contradicts an emerging category – Provides a different perspective – Provides an important check to balance the tendency to stay with first impressions
  • 25.
    • 2. AnalyticInduction – Examine data to develop or test a theory – Steps • Start with preliminary focus or explanation of a phenomenon • Develop a hypothesis that explains data • Collect data to test the hypothesis • Accept or reformulate the hypothesis – Data are continuously gathered until no contradictory data are found
  • 26.
    • 3. Constantcomparison – Constantly comparing identified ideas and concepts to determine their distinctive characteristics so they can be placed in different appropriate categories – Iterative in nature – Ongoing throughout the research process
  • 27.
    Title Form ofRelationship 1. Strict Inclusion X is a kind of Y 2. Spatial X is a place in Y; X is a part of Y 3. Cause-effect X is a result of Y; X is a cause of Y 4. Rationale X is a reason for doing Y 5. Location for action X is a location for doing Y 6. Function X is used for Y 7. Means-end X is a way to do Y 8. Sequence X is a step (stage) in Y 9. Attribution X is an attribute (characteristic) of Y
  • 28.
    Insights into interpretation •Reflective, integrative, and explanatory • Based heavily on connection, common aspects, and linkages among data, categories, and patterns • Interpretation makes explicit the conceptual basis of the categories and patterns
  • 29.
    3 Guiding Questions •What is important in the data? • Why is it important? • What can be learned from it?

Editor's Notes

  • #3 Knowledge we have, what we understand - Researching the conscious mind – Grounded theory Emotional drivers, conscious and unconscious – psyche – phenomenology Actions we take, what we see ourselves doing – meaningful behavior – case study Cultural focus and meaning systems – shared meanings, norms and codes - ethnography