SlideShare a Scribd company logo
Lecture 10


                     Writing and Analytical
                           Resources


                        Abdisalam Issa-Salwe
                         Taibah University
            College of Computer Science & Engineering
                  Computer Science Department


Outline
1.   Dimensions and units
2.   Graphing
3.   Plot
4.   Reporting data in text or tables
5.   Random Error


                                                        2


                                                            1
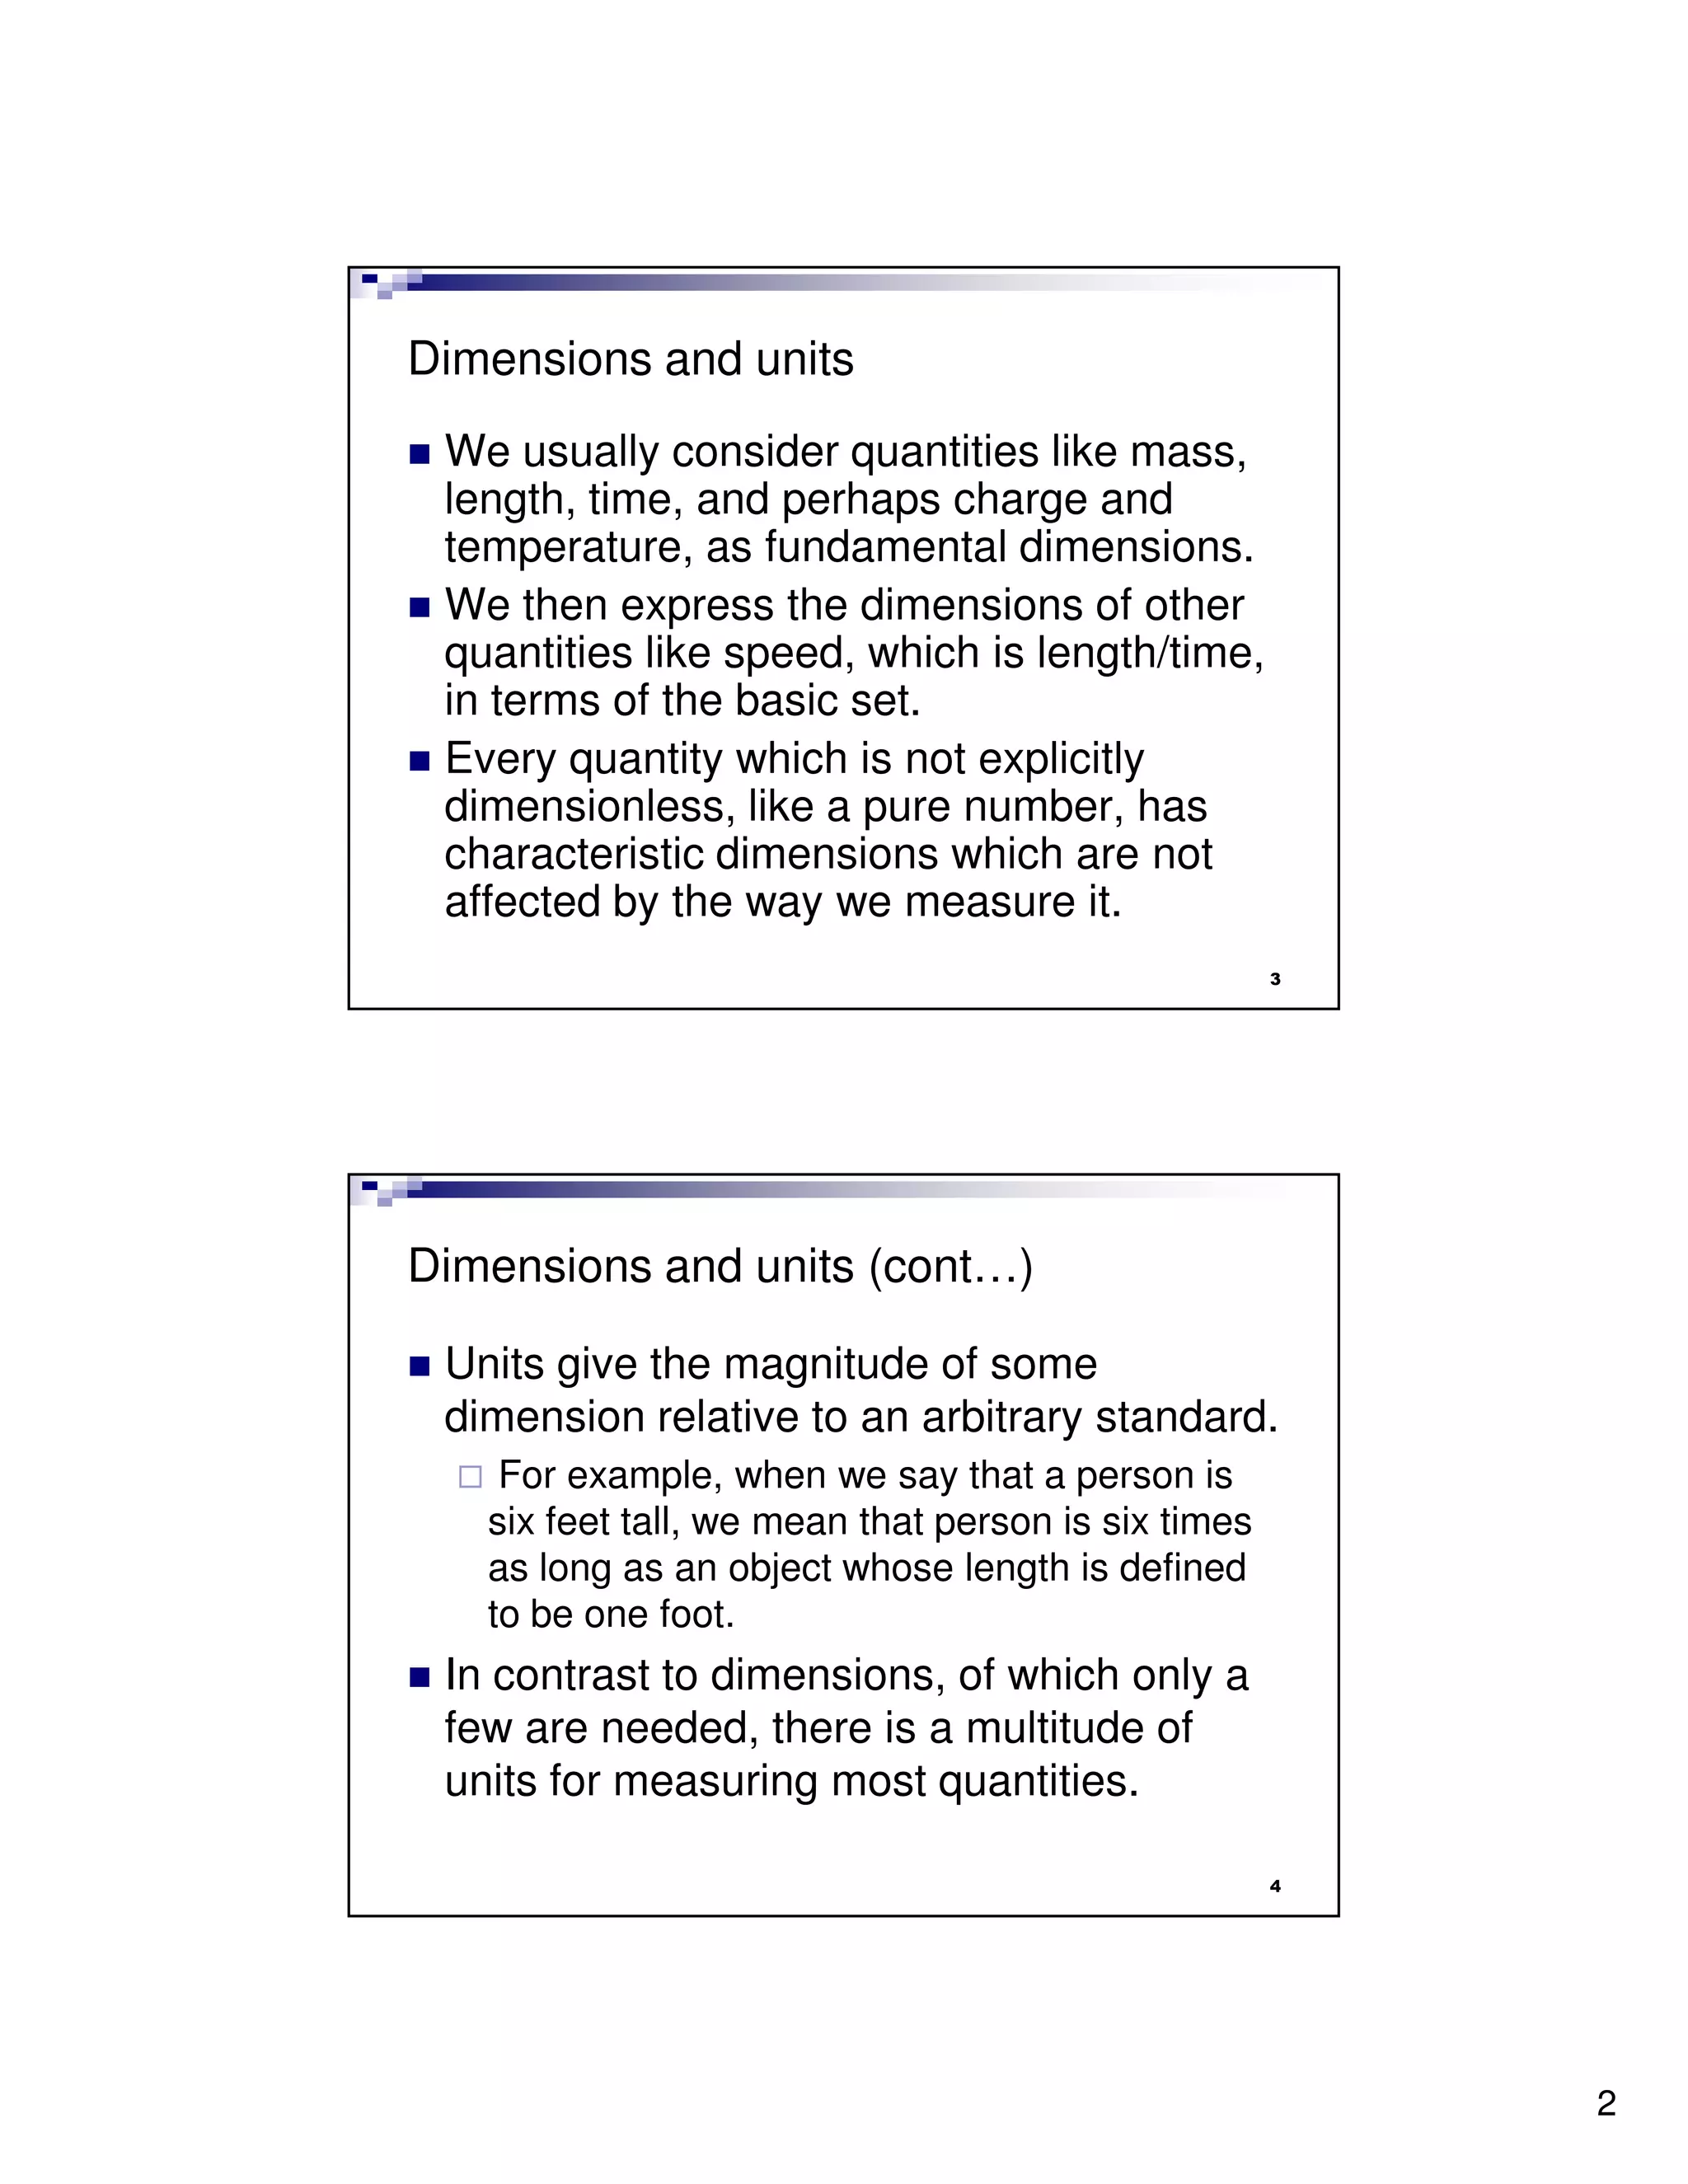
Dimensions and units
 We usually consider quantities like mass,
 length, time, and perhaps charge and
 temperature, as fundamental dimensions.
 We then express the dimensions of other
 quantities like speed, which is length/time,
 in terms of the basic set.
 Every quantity which is not explicitly
 dimensionless, like a pure number, has
 characteristic dimensions which are not
 affected by the way we measure it.
                                                     3


Dimensions and units (cont…)

 Units give the magnitude of some
 dimension relative to an arbitrary standard.
    For example, when we say that a person is
   six feet tall, we mean that person is six times
   as long as an object whose length is defined
   to be one foot.
 In contrast to dimensions, of which only a
 few are needed, there is a multitude of
 units for measuring most quantities.

                                                     4


                                                         2
Dimensions and units (cont…)

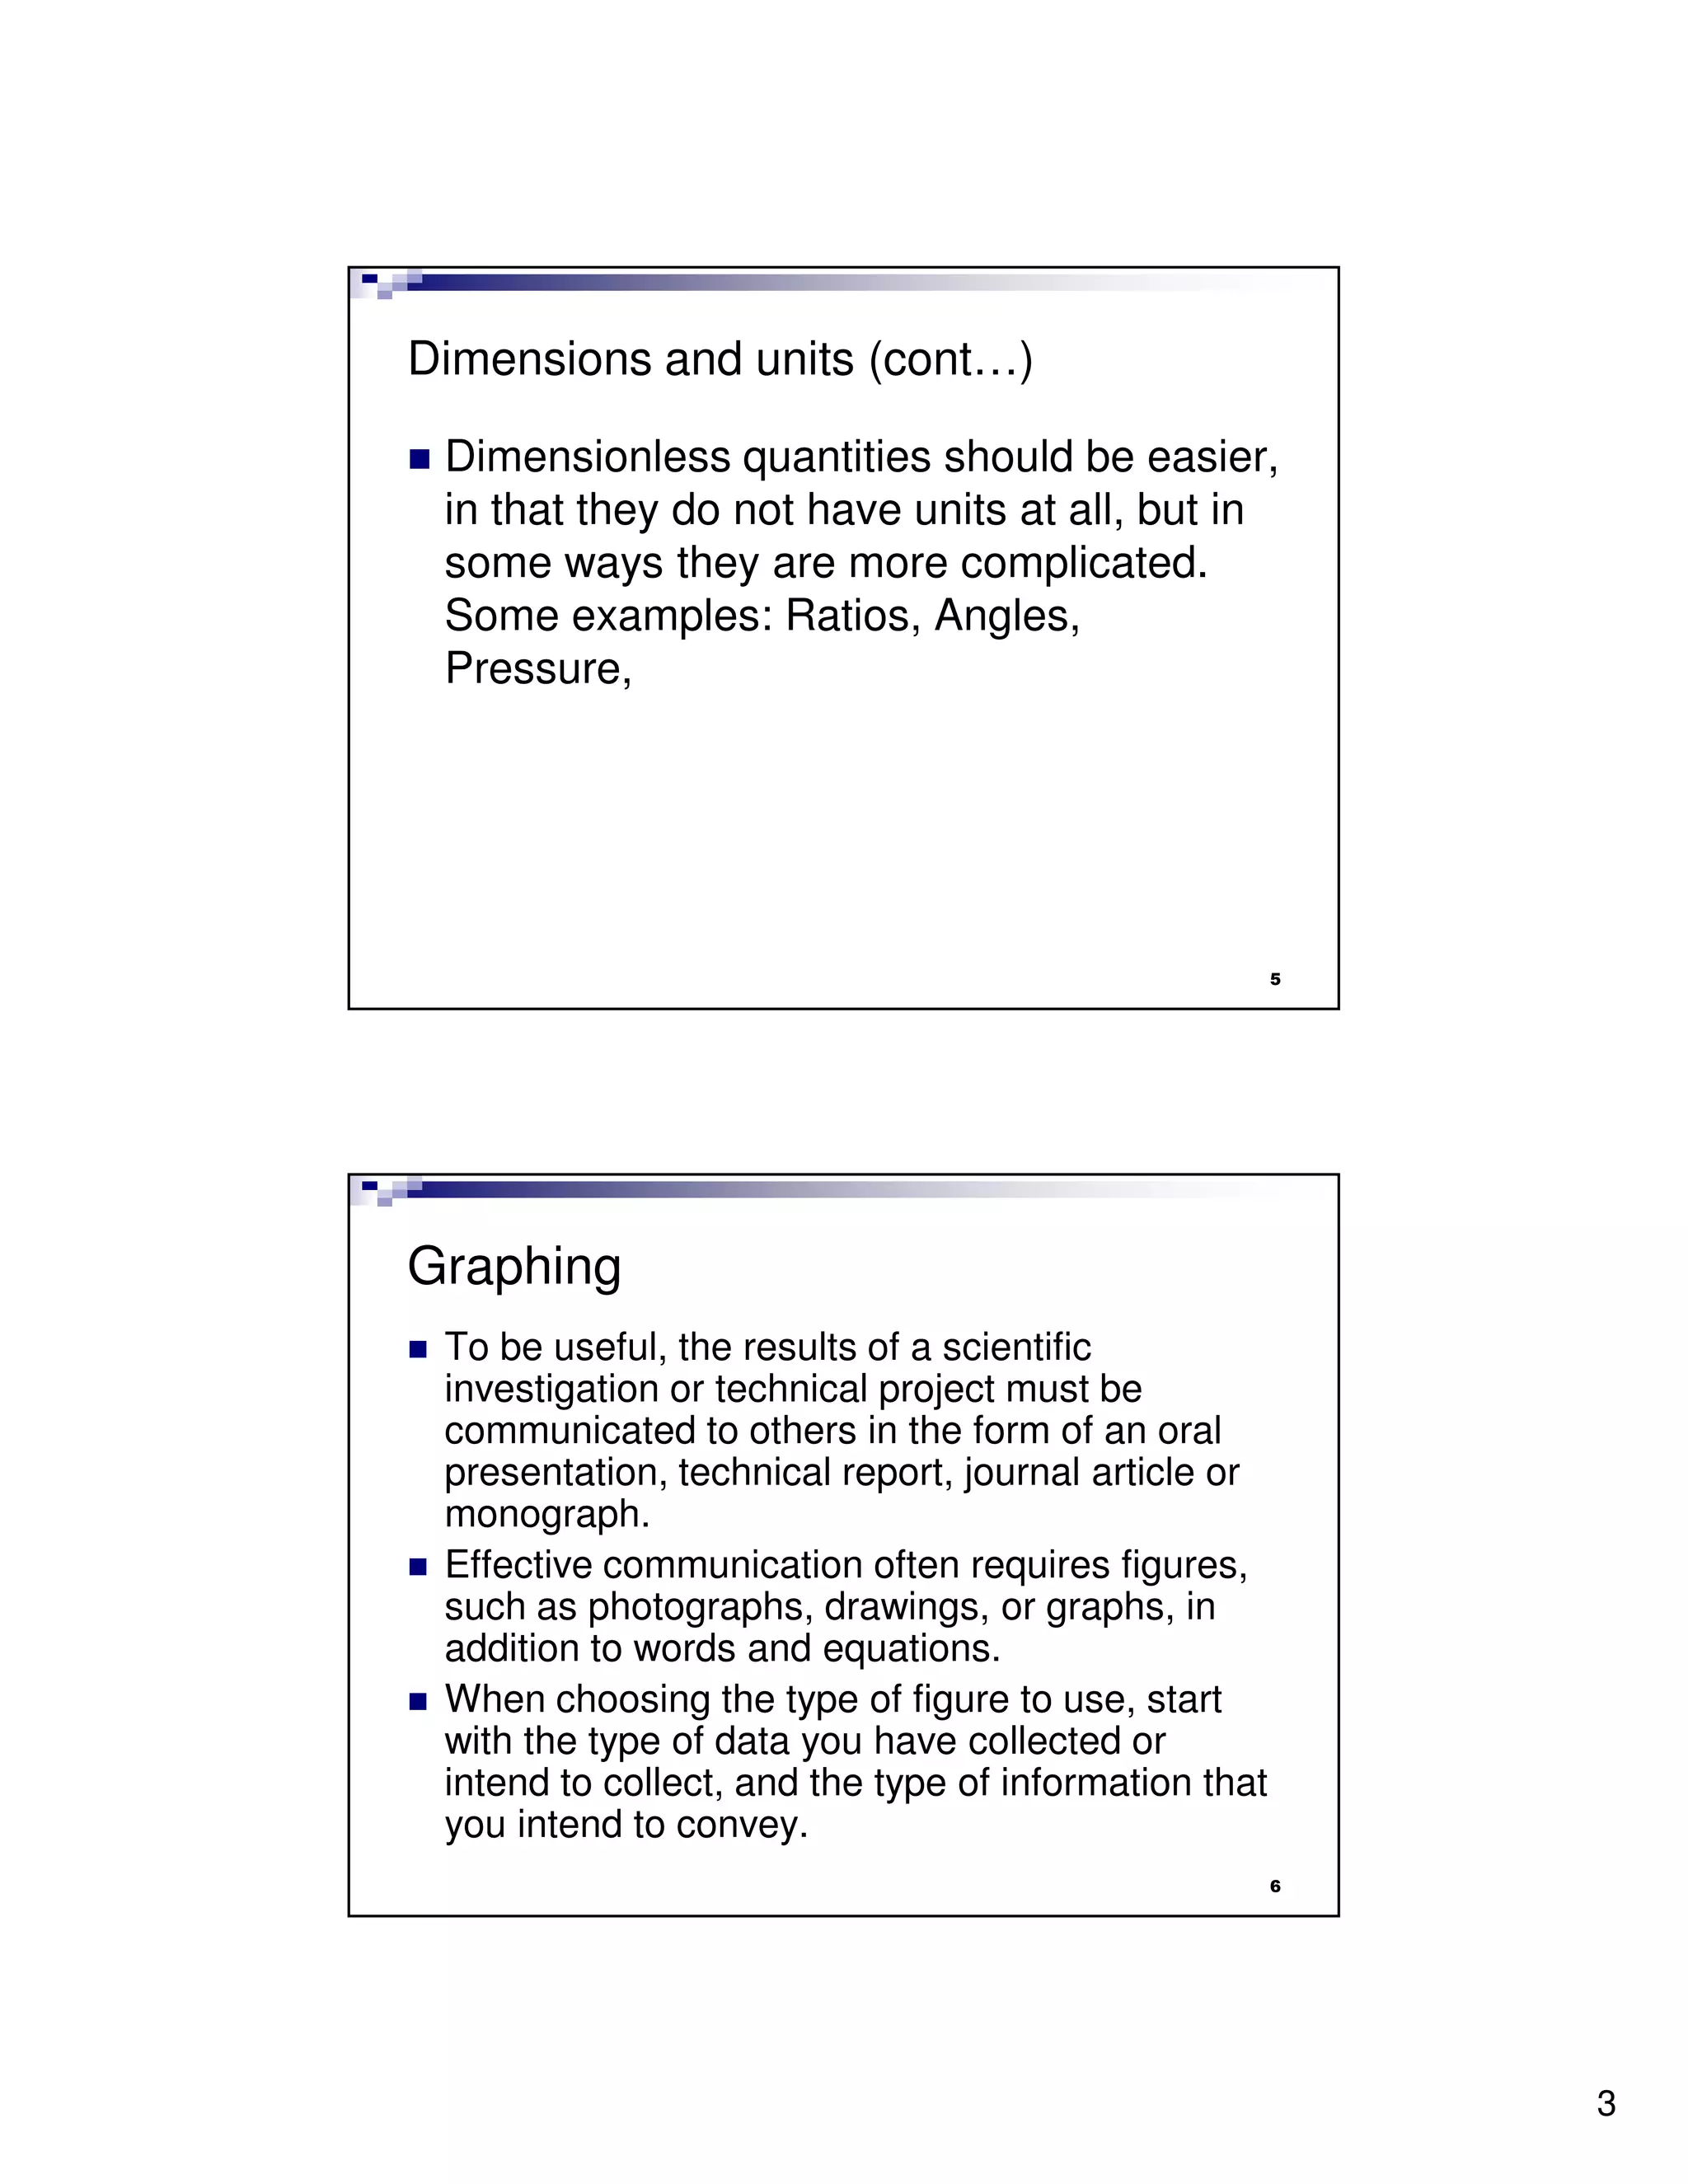
 Dimensionless quantities should be easier,
 in that they do not have units at all, but in
 some ways they are more complicated.
 Some examples: Ratios, Angles,
 Pressure,


                                                       5


Graphing
 To be useful, the results of a scientific
 investigation or technical project must be
 communicated to others in the form of an oral
 presentation, technical report, journal article or
 monograph.
 Effective communication often requires figures,
 such as photographs, drawings, or graphs, in
 addition to words and equations.
 When choosing the type of figure to use, start
 with the type of data you have collected or
 intend to collect, and the type of information that
 you intend to convey.
                                                       6


                                                           3
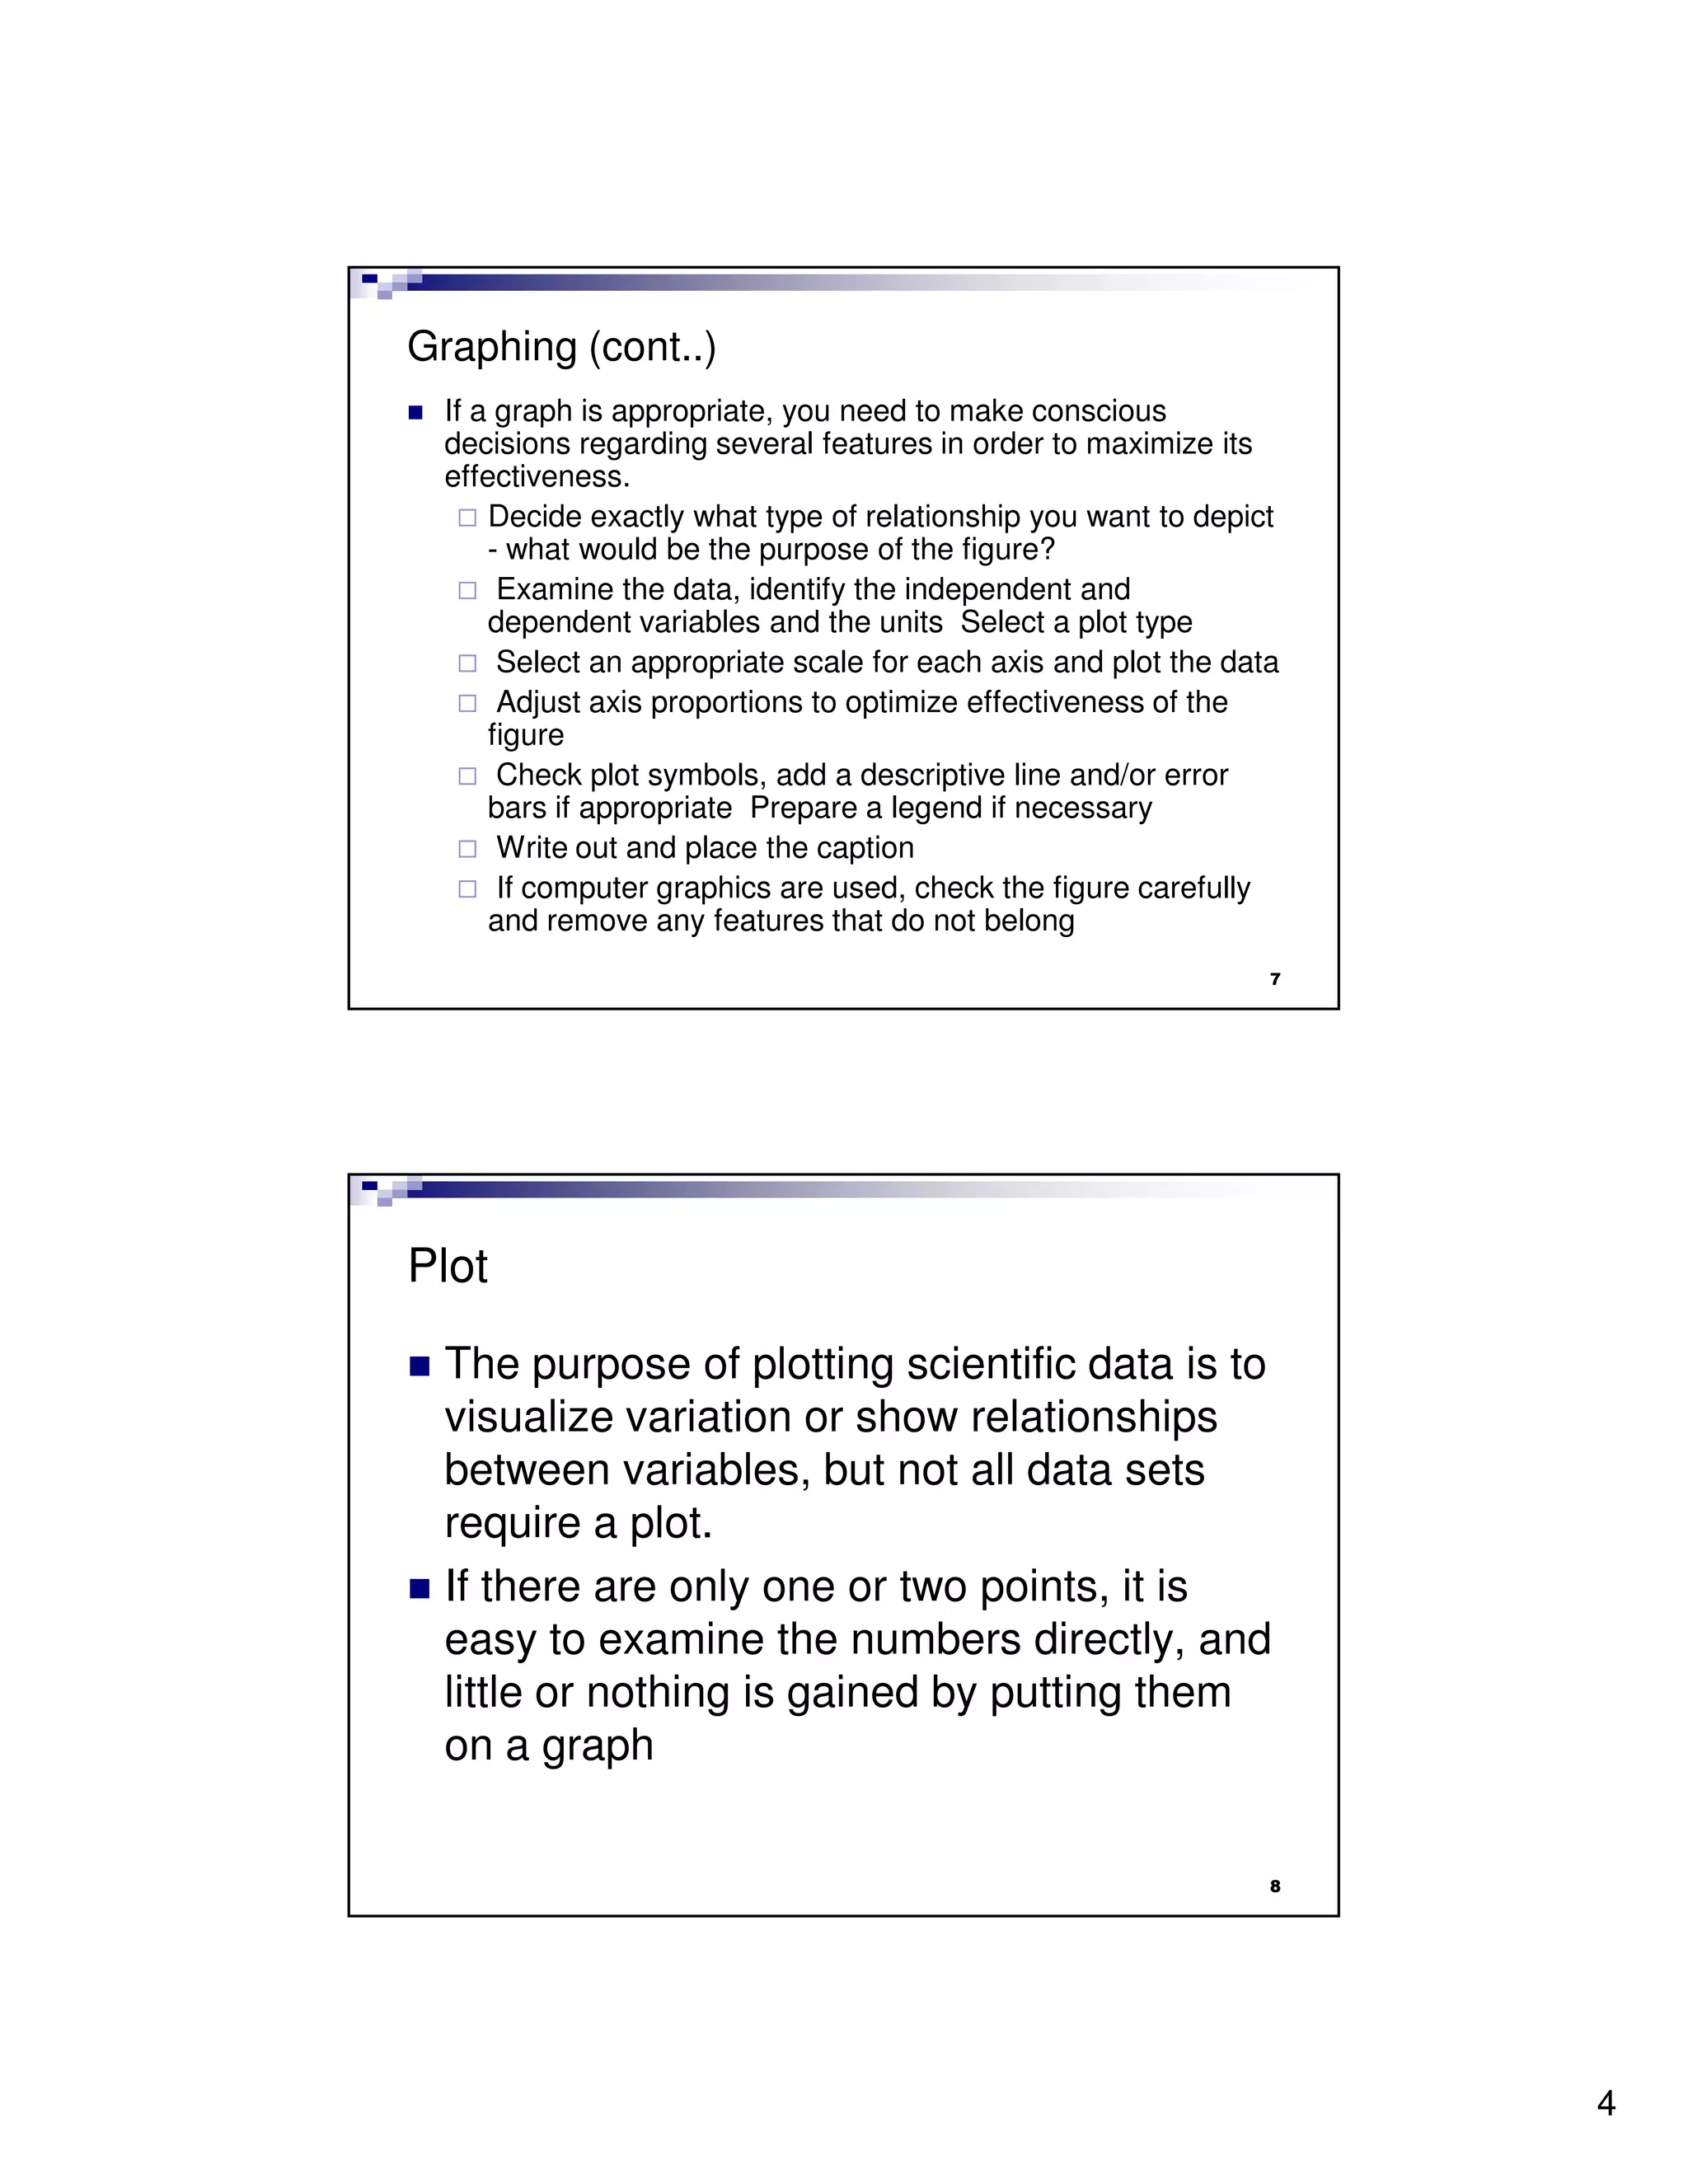
Graphing (cont..)
  If a graph is appropriate, you need to make conscious
  decisions regarding several features in order to maximize its
  effectiveness.
      Decide exactly what type of relationship you want to depict
      - what would be the purpose of the figure?
       Examine the data, identify the independent and
      dependent variables and the units Select a plot type
       Select an appropriate scale for each axis and plot the data
       Adjust axis proportions to optimize effectiveness of the
      figure
       Check plot symbols, add a descriptive line and/or error
      bars if appropriate Prepare a legend if necessary
       Write out and place the caption
       If computer graphics are used, check the figure carefully
      and remove any features that do not belong
                                                                 7


Plot

  The purpose of plotting scientific data is to
  visualize variation or show relationships
  between variables, but not all data sets
  require a plot.
  If there are only one or two points, it is
  easy to examine the numbers directly, and
  little or nothing is gained by putting them
  on a graph


                                                                 8


                                                                     4
Reporting data in text or tables

 Assuming that you have a normal
 distribution, a set of data for a single
 sample can be written in text or in a table
 as mean ± error, which is usually either
 the standard deviation or the standard
 deviation of the mean (e.g., 9.8 ± 0.02 m/s
 2).


                                                  9


Random Error
 Random error, known also as experimental
 error, contributes uncertainty to any
 experiment or observation that involves
 measurements.
 One must take such error into account when
 making critical decisions.
 When you present data that are based on
 uncertain quantities, people who see your
 results should have the opportunity to take
 random error into account when deciding
 whether or not to agree with your conclusions.

                                                  10


                                                       5
Random Error (cont…)

 Without an estimate of error, the
 implication is that the data are perfect.
 Random error plays such an important role
 in decision making, it is necessary to
 represent such error appropriately in text,
 tables, and in figures.


                                            11


Random Error (cont…)

 To represent random error, we
 commonly use what we call an error
 bar, consisting of a vertical line that
 extends from the mean value in
 proportion to the magnitude of the error.
 The most common type of error bar that
 you will encounter includes a "cap" that
 clearly indicates the end of the bar in each
 direction.
                                            12


                                                 6
References

 Introductory Laboratory Courses in
 Biochemistry & Cell Biology,
 syllabushttp://www.ruf.rice.edu/~bioslabs/b
 ios211/index.htm
 Abdisalam Issa-Salwe lecture notes,
 Taibah University.


                                           13


                                                7

More Related Content

What's hot

GPP Spreadsheets
GPP SpreadsheetsGPP Spreadsheets
GPP Spreadsheets
mrcarty
 
Spss lecture notes
Spss lecture notesSpss lecture notes
Spss lecture notes
David mbwiga
 
Unit 8 presenting data in charts, graphs and tables
Unit 8 presenting data in charts, graphs and tablesUnit 8 presenting data in charts, graphs and tables
Unit 8 presenting data in charts, graphs and tables
igids
 
Continuing Our Look At Primary And Secondary Data
Continuing Our Look At Primary And Secondary DataContinuing Our Look At Primary And Secondary Data
Continuing Our Look At Primary And Secondary Data
guest2137aa
 
SELECTED DATA PREPARATION METHODS
SELECTED DATA PREPARATION METHODSSELECTED DATA PREPARATION METHODS
SELECTED DATA PREPARATION METHODS
KAMIL MAJEED
 

What's hot (20)

"A basic guide to SPSS"
"A basic guide to SPSS""A basic guide to SPSS"
"A basic guide to SPSS"
 
Rubrics & Self Assessments Online Submission
Rubrics & Self Assessments Online SubmissionRubrics & Self Assessments Online Submission
Rubrics & Self Assessments Online Submission
 
Julie S
Julie SJulie S
Julie S
 
GPP Spreadsheets
GPP SpreadsheetsGPP Spreadsheets
GPP Spreadsheets
 
Artificial Intelligence - Data Analysis, Creative & Critical Thinking and AI...
Artificial Intelligence - Data Analysis, Creative & Critical Thinking and  AI...Artificial Intelligence - Data Analysis, Creative & Critical Thinking and  AI...
Artificial Intelligence - Data Analysis, Creative & Critical Thinking and AI...
 
Descriptive Statistics - SPSS
Descriptive Statistics - SPSSDescriptive Statistics - SPSS
Descriptive Statistics - SPSS
 
Spss lecture notes
Spss lecture notesSpss lecture notes
Spss lecture notes
 
Spss presentation
Spss presentationSpss presentation
Spss presentation
 
Unit 8 presenting data in charts, graphs and tables
Unit 8 presenting data in charts, graphs and tablesUnit 8 presenting data in charts, graphs and tables
Unit 8 presenting data in charts, graphs and tables
 
Spss series - data entry and coding
Spss series - data entry and codingSpss series - data entry and coding
Spss series - data entry and coding
 
Excel SUMIFS Function
Excel SUMIFS FunctionExcel SUMIFS Function
Excel SUMIFS Function
 
Nurses Data Analysis by Applied SPSS
Nurses Data Analysis by Applied SPSSNurses Data Analysis by Applied SPSS
Nurses Data Analysis by Applied SPSS
 
Visualization-2
Visualization-2Visualization-2
Visualization-2
 
Continuing Our Look At Primary And Secondary Data
Continuing Our Look At Primary And Secondary DataContinuing Our Look At Primary And Secondary Data
Continuing Our Look At Primary And Secondary Data
 
Clustering - Machine Learning Techniques
Clustering - Machine Learning TechniquesClustering - Machine Learning Techniques
Clustering - Machine Learning Techniques
 
Decision tree
Decision treeDecision tree
Decision tree
 
SELECTED DATA PREPARATION METHODS
SELECTED DATA PREPARATION METHODSSELECTED DATA PREPARATION METHODS
SELECTED DATA PREPARATION METHODS
 
Stem and leaf plot
Stem and leaf plotStem and leaf plot
Stem and leaf plot
 
Statistical Writing (Sven Sandin)
Statistical Writing (Sven Sandin)Statistical Writing (Sven Sandin)
Statistical Writing (Sven Sandin)
 
Statistical Writing. Tables and Figures (Sven Sandin)
Statistical Writing. Tables and Figures (Sven Sandin)Statistical Writing. Tables and Figures (Sven Sandin)
Statistical Writing. Tables and Figures (Sven Sandin)
 

Viewers also liked

Viewers also liked (7)

Visiting ibiza
Visiting ibizaVisiting ibiza
Visiting ibiza
 
2010 Volunteer Calendar Packet
2010 Volunteer Calendar Packet2010 Volunteer Calendar Packet
2010 Volunteer Calendar Packet
 
Understanding Arta Factor
Understanding Arta FactorUnderstanding Arta Factor
Understanding Arta Factor
 
Mikael Bäck: The Continued Evolution of Mobile Broadband
Mikael Bäck: The Continued Evolution of Mobile BroadbandMikael Bäck: The Continued Evolution of Mobile Broadband
Mikael Bäck: The Continued Evolution of Mobile Broadband
 
Project SAME Presentation
Project SAME PresentationProject SAME Presentation
Project SAME Presentation
 
iOS development, Ahti Liin, Mooncascade OÜ @ MoMo Tallinn 11.04.11
iOS development, Ahti Liin, Mooncascade OÜ @ MoMo Tallinn 11.04.11iOS development, Ahti Liin, Mooncascade OÜ @ MoMo Tallinn 11.04.11
iOS development, Ahti Liin, Mooncascade OÜ @ MoMo Tallinn 11.04.11
 
For the Love of Bacon - America's Cult Meme
For the Love of Bacon - America's Cult MemeFor the Love of Bacon - America's Cult Meme
For the Love of Bacon - America's Cult Meme
 

Similar to Lecture10 (writing&analytical resources)

Biology statistics made_simple_using_excel
Biology statistics made_simple_using_excelBiology statistics made_simple_using_excel
Biology statistics made_simple_using_excel
haramaya university
 
Focus on what you learned that made an impression, what may have s.docx
Focus on what you learned that made an impression, what may have s.docxFocus on what you learned that made an impression, what may have s.docx
Focus on what you learned that made an impression, what may have s.docx
keugene1
 
Graphicalrepresntationofdatausingstatisticaltools2019_210902_105156.pdf
Graphicalrepresntationofdatausingstatisticaltools2019_210902_105156.pdfGraphicalrepresntationofdatausingstatisticaltools2019_210902_105156.pdf
Graphicalrepresntationofdatausingstatisticaltools2019_210902_105156.pdf
Himakshi7
 
Ch17 lab r_verdu103: Entry level statistics exercise (descriptives)
Ch17 lab r_verdu103: Entry level statistics exercise (descriptives)Ch17 lab r_verdu103: Entry level statistics exercise (descriptives)
Ch17 lab r_verdu103: Entry level statistics exercise (descriptives)
Sherri Gunder
 
Design PatternsChristian Behrenshttpswww.behance.netgall.docx
Design PatternsChristian Behrenshttpswww.behance.netgall.docxDesign PatternsChristian Behrenshttpswww.behance.netgall.docx
Design PatternsChristian Behrenshttpswww.behance.netgall.docx
carolinef5
 

Similar to Lecture10 (writing&analytical resources) (20)

Biology statistics made_simple_using_excel
Biology statistics made_simple_using_excelBiology statistics made_simple_using_excel
Biology statistics made_simple_using_excel
 
Research Methodology-Data Processing
Research Methodology-Data ProcessingResearch Methodology-Data Processing
Research Methodology-Data Processing
 
Research methodology-Research Report
Research methodology-Research ReportResearch methodology-Research Report
Research methodology-Research Report
 
7.pptx
7.pptx7.pptx
7.pptx
 
Unit 2_ Descriptive Analytics for MBA .pptx
Unit 2_ Descriptive Analytics for MBA .pptxUnit 2_ Descriptive Analytics for MBA .pptx
Unit 2_ Descriptive Analytics for MBA .pptx
 
OLD SEVEN TOOLS OF QUALTIY MANAGEMENT
OLD SEVEN TOOLS OF QUALTIY MANAGEMENTOLD SEVEN TOOLS OF QUALTIY MANAGEMENT
OLD SEVEN TOOLS OF QUALTIY MANAGEMENT
 
Tqm old tools
Tqm old toolsTqm old tools
Tqm old tools
 
Tqm old tools
Tqm old toolsTqm old tools
Tqm old tools
 
Btm8107 8 week2 activity understanding and exploring assumptions a+ work
Btm8107 8 week2 activity understanding and exploring assumptions a+ workBtm8107 8 week2 activity understanding and exploring assumptions a+ work
Btm8107 8 week2 activity understanding and exploring assumptions a+ work
 
Focus on what you learned that made an impression, what may have s.docx
Focus on what you learned that made an impression, what may have s.docxFocus on what you learned that made an impression, what may have s.docx
Focus on what you learned that made an impression, what may have s.docx
 
Chemistry Lab Manual
Chemistry Lab ManualChemistry Lab Manual
Chemistry Lab Manual
 
7 qc tools
7 qc tools7 qc tools
7 qc tools
 
Unit-1 Measurement and Error.pdf
Unit-1 Measurement and Error.pdfUnit-1 Measurement and Error.pdf
Unit-1 Measurement and Error.pdf
 
CHAPTER 7.pptx
CHAPTER 7.pptxCHAPTER 7.pptx
CHAPTER 7.pptx
 
Graphicalrepresntationofdatausingstatisticaltools2019_210902_105156.pdf
Graphicalrepresntationofdatausingstatisticaltools2019_210902_105156.pdfGraphicalrepresntationofdatausingstatisticaltools2019_210902_105156.pdf
Graphicalrepresntationofdatausingstatisticaltools2019_210902_105156.pdf
 
Exploratory Data Analysis
Exploratory Data AnalysisExploratory Data Analysis
Exploratory Data Analysis
 
UNIT - 5 : 20ACS04 – PROBLEM SOLVING AND PROGRAMMING USING PYTHON
UNIT - 5 : 20ACS04 – PROBLEM SOLVING AND PROGRAMMING USING PYTHONUNIT - 5 : 20ACS04 – PROBLEM SOLVING AND PROGRAMMING USING PYTHON
UNIT - 5 : 20ACS04 – PROBLEM SOLVING AND PROGRAMMING USING PYTHON
 
Ch17 lab r_verdu103: Entry level statistics exercise (descriptives)
Ch17 lab r_verdu103: Entry level statistics exercise (descriptives)Ch17 lab r_verdu103: Entry level statistics exercise (descriptives)
Ch17 lab r_verdu103: Entry level statistics exercise (descriptives)
 
Data .pptx
Data .pptxData .pptx
Data .pptx
 
Design PatternsChristian Behrenshttpswww.behance.netgall.docx
Design PatternsChristian Behrenshttpswww.behance.netgall.docxDesign PatternsChristian Behrenshttpswww.behance.netgall.docx
Design PatternsChristian Behrenshttpswww.behance.netgall.docx
 

More from Taibah University, College of Computer Science & Engineering

More from Taibah University, College of Computer Science & Engineering (20)

Lecture 1- Computer Organization and Architecture.pdf
Lecture 1- Computer Organization and Architecture.pdfLecture 1- Computer Organization and Architecture.pdf
Lecture 1- Computer Organization and Architecture.pdf
 
The paper the welfare state of the somali nation - a possible solution to t...
The paper   the welfare state of the somali nation - a possible solution to t...The paper   the welfare state of the somali nation - a possible solution to t...
The paper the welfare state of the somali nation - a possible solution to t...
 
Colonial intrusion and_the_somali_resistance
Colonial intrusion and_the_somali_resistanceColonial intrusion and_the_somali_resistance
Colonial intrusion and_the_somali_resistance
 
Lecture 3 (Contemporary approaches to Information Systems)
Lecture 3 (Contemporary approaches to Information Systems)Lecture 3 (Contemporary approaches to Information Systems)
Lecture 3 (Contemporary approaches to Information Systems)
 
Lecture 7 (business-level strategy and the value chain model)
Lecture 7  (business-level strategy and the value chain model)Lecture 7  (business-level strategy and the value chain model)
Lecture 7 (business-level strategy and the value chain model)
 
Lecture 4 (using information technology for competitive advantage)
Lecture 4 (using information technology for competitive advantage)Lecture 4 (using information technology for competitive advantage)
Lecture 4 (using information technology for competitive advantage)
 
Lecture 2 (major types of information systems in organizations)
Lecture 2 (major types of information systems in organizations)Lecture 2 (major types of information systems in organizations)
Lecture 2 (major types of information systems in organizations)
 
Practical session 1 (critical path analaysis)
Practical session 1 (critical path analaysis)Practical session 1 (critical path analaysis)
Practical session 1 (critical path analaysis)
 
Chapter 2 modeling the process and life-cycle
Chapter 2  modeling the process and life-cycleChapter 2  modeling the process and life-cycle
Chapter 2 modeling the process and life-cycle
 
Historical Perspective on the Challenge Facing the Somali Sacral Unity
Historical Perspective on the Challenge Facing the Somali Sacral UnityHistorical Perspective on the Challenge Facing the Somali Sacral Unity
Historical Perspective on the Challenge Facing the Somali Sacral Unity
 
Colonial intrusion and the Somali Resistance
Colonial intrusion and the Somali ResistanceColonial intrusion and the Somali Resistance
Colonial intrusion and the Somali Resistance
 
Lecture 8 (information systems and strategy planning)
Lecture 8  (information systems and strategy planning)Lecture 8  (information systems and strategy planning)
Lecture 8 (information systems and strategy planning)
 
Lecture 4 (using information technology for competitive advantage)
Lecture 4 (using information technology for competitive advantage)Lecture 4 (using information technology for competitive advantage)
Lecture 4 (using information technology for competitive advantage)
 
Lecture1 data structure(introduction)
Lecture1 data structure(introduction)Lecture1 data structure(introduction)
Lecture1 data structure(introduction)
 
Lecture2 is331 data&infomanag(databaseenv)
Lecture2 is331 data&infomanag(databaseenv)Lecture2 is331 data&infomanag(databaseenv)
Lecture2 is331 data&infomanag(databaseenv)
 
Lecture1 is322 data&infomanag(introduction)(old curr)
Lecture1 is322 data&infomanag(introduction)(old curr)Lecture1 is322 data&infomanag(introduction)(old curr)
Lecture1 is322 data&infomanag(introduction)(old curr)
 
Lecture6 is353(ea&data viewpoint )
Lecture6 is353(ea&data viewpoint )Lecture6 is353(ea&data viewpoint )
Lecture6 is353(ea&data viewpoint )
 
Lecture4 is353-ea(fea)
Lecture4 is353-ea(fea)Lecture4 is353-ea(fea)
Lecture4 is353-ea(fea)
 
Lecture3 is353-ea(togaf)
Lecture3 is353-ea(togaf)Lecture3 is353-ea(togaf)
Lecture3 is353-ea(togaf)
 
Lecture2 is353-ea(the zachma framework)
Lecture2 is353-ea(the zachma framework)Lecture2 is353-ea(the zachma framework)
Lecture2 is353-ea(the zachma framework)
 

Lecture10 (writing&analytical resources)

  • 1. Lecture 10 Writing and Analytical Resources Abdisalam Issa-Salwe Taibah University College of Computer Science & Engineering Computer Science Department Outline 1. Dimensions and units 2. Graphing 3. Plot 4. Reporting data in text or tables 5. Random Error 2 1
  • 2. Dimensions and units We usually consider quantities like mass, length, time, and perhaps charge and temperature, as fundamental dimensions. We then express the dimensions of other quantities like speed, which is length/time, in terms of the basic set. Every quantity which is not explicitly dimensionless, like a pure number, has characteristic dimensions which are not affected by the way we measure it. 3 Dimensions and units (cont…) Units give the magnitude of some dimension relative to an arbitrary standard. For example, when we say that a person is six feet tall, we mean that person is six times as long as an object whose length is defined to be one foot. In contrast to dimensions, of which only a few are needed, there is a multitude of units for measuring most quantities. 4 2
  • 3. Dimensions and units (cont…) Dimensionless quantities should be easier, in that they do not have units at all, but in some ways they are more complicated. Some examples: Ratios, Angles, Pressure, 5 Graphing To be useful, the results of a scientific investigation or technical project must be communicated to others in the form of an oral presentation, technical report, journal article or monograph. Effective communication often requires figures, such as photographs, drawings, or graphs, in addition to words and equations. When choosing the type of figure to use, start with the type of data you have collected or intend to collect, and the type of information that you intend to convey. 6 3
  • 4. Graphing (cont..) If a graph is appropriate, you need to make conscious decisions regarding several features in order to maximize its effectiveness. Decide exactly what type of relationship you want to depict - what would be the purpose of the figure? Examine the data, identify the independent and dependent variables and the units Select a plot type Select an appropriate scale for each axis and plot the data Adjust axis proportions to optimize effectiveness of the figure Check plot symbols, add a descriptive line and/or error bars if appropriate Prepare a legend if necessary Write out and place the caption If computer graphics are used, check the figure carefully and remove any features that do not belong 7 Plot The purpose of plotting scientific data is to visualize variation or show relationships between variables, but not all data sets require a plot. If there are only one or two points, it is easy to examine the numbers directly, and little or nothing is gained by putting them on a graph 8 4
  • 5. Reporting data in text or tables Assuming that you have a normal distribution, a set of data for a single sample can be written in text or in a table as mean ± error, which is usually either the standard deviation or the standard deviation of the mean (e.g., 9.8 ± 0.02 m/s 2). 9 Random Error Random error, known also as experimental error, contributes uncertainty to any experiment or observation that involves measurements. One must take such error into account when making critical decisions. When you present data that are based on uncertain quantities, people who see your results should have the opportunity to take random error into account when deciding whether or not to agree with your conclusions. 10 5
  • 6. Random Error (cont…) Without an estimate of error, the implication is that the data are perfect. Random error plays such an important role in decision making, it is necessary to represent such error appropriately in text, tables, and in figures. 11 Random Error (cont…) To represent random error, we commonly use what we call an error bar, consisting of a vertical line that extends from the mean value in proportion to the magnitude of the error. The most common type of error bar that you will encounter includes a "cap" that clearly indicates the end of the bar in each direction. 12 6
  • 7. References Introductory Laboratory Courses in Biochemistry & Cell Biology, syllabushttp://www.ruf.rice.edu/~bioslabs/b ios211/index.htm Abdisalam Issa-Salwe lecture notes, Taibah University. 13 7