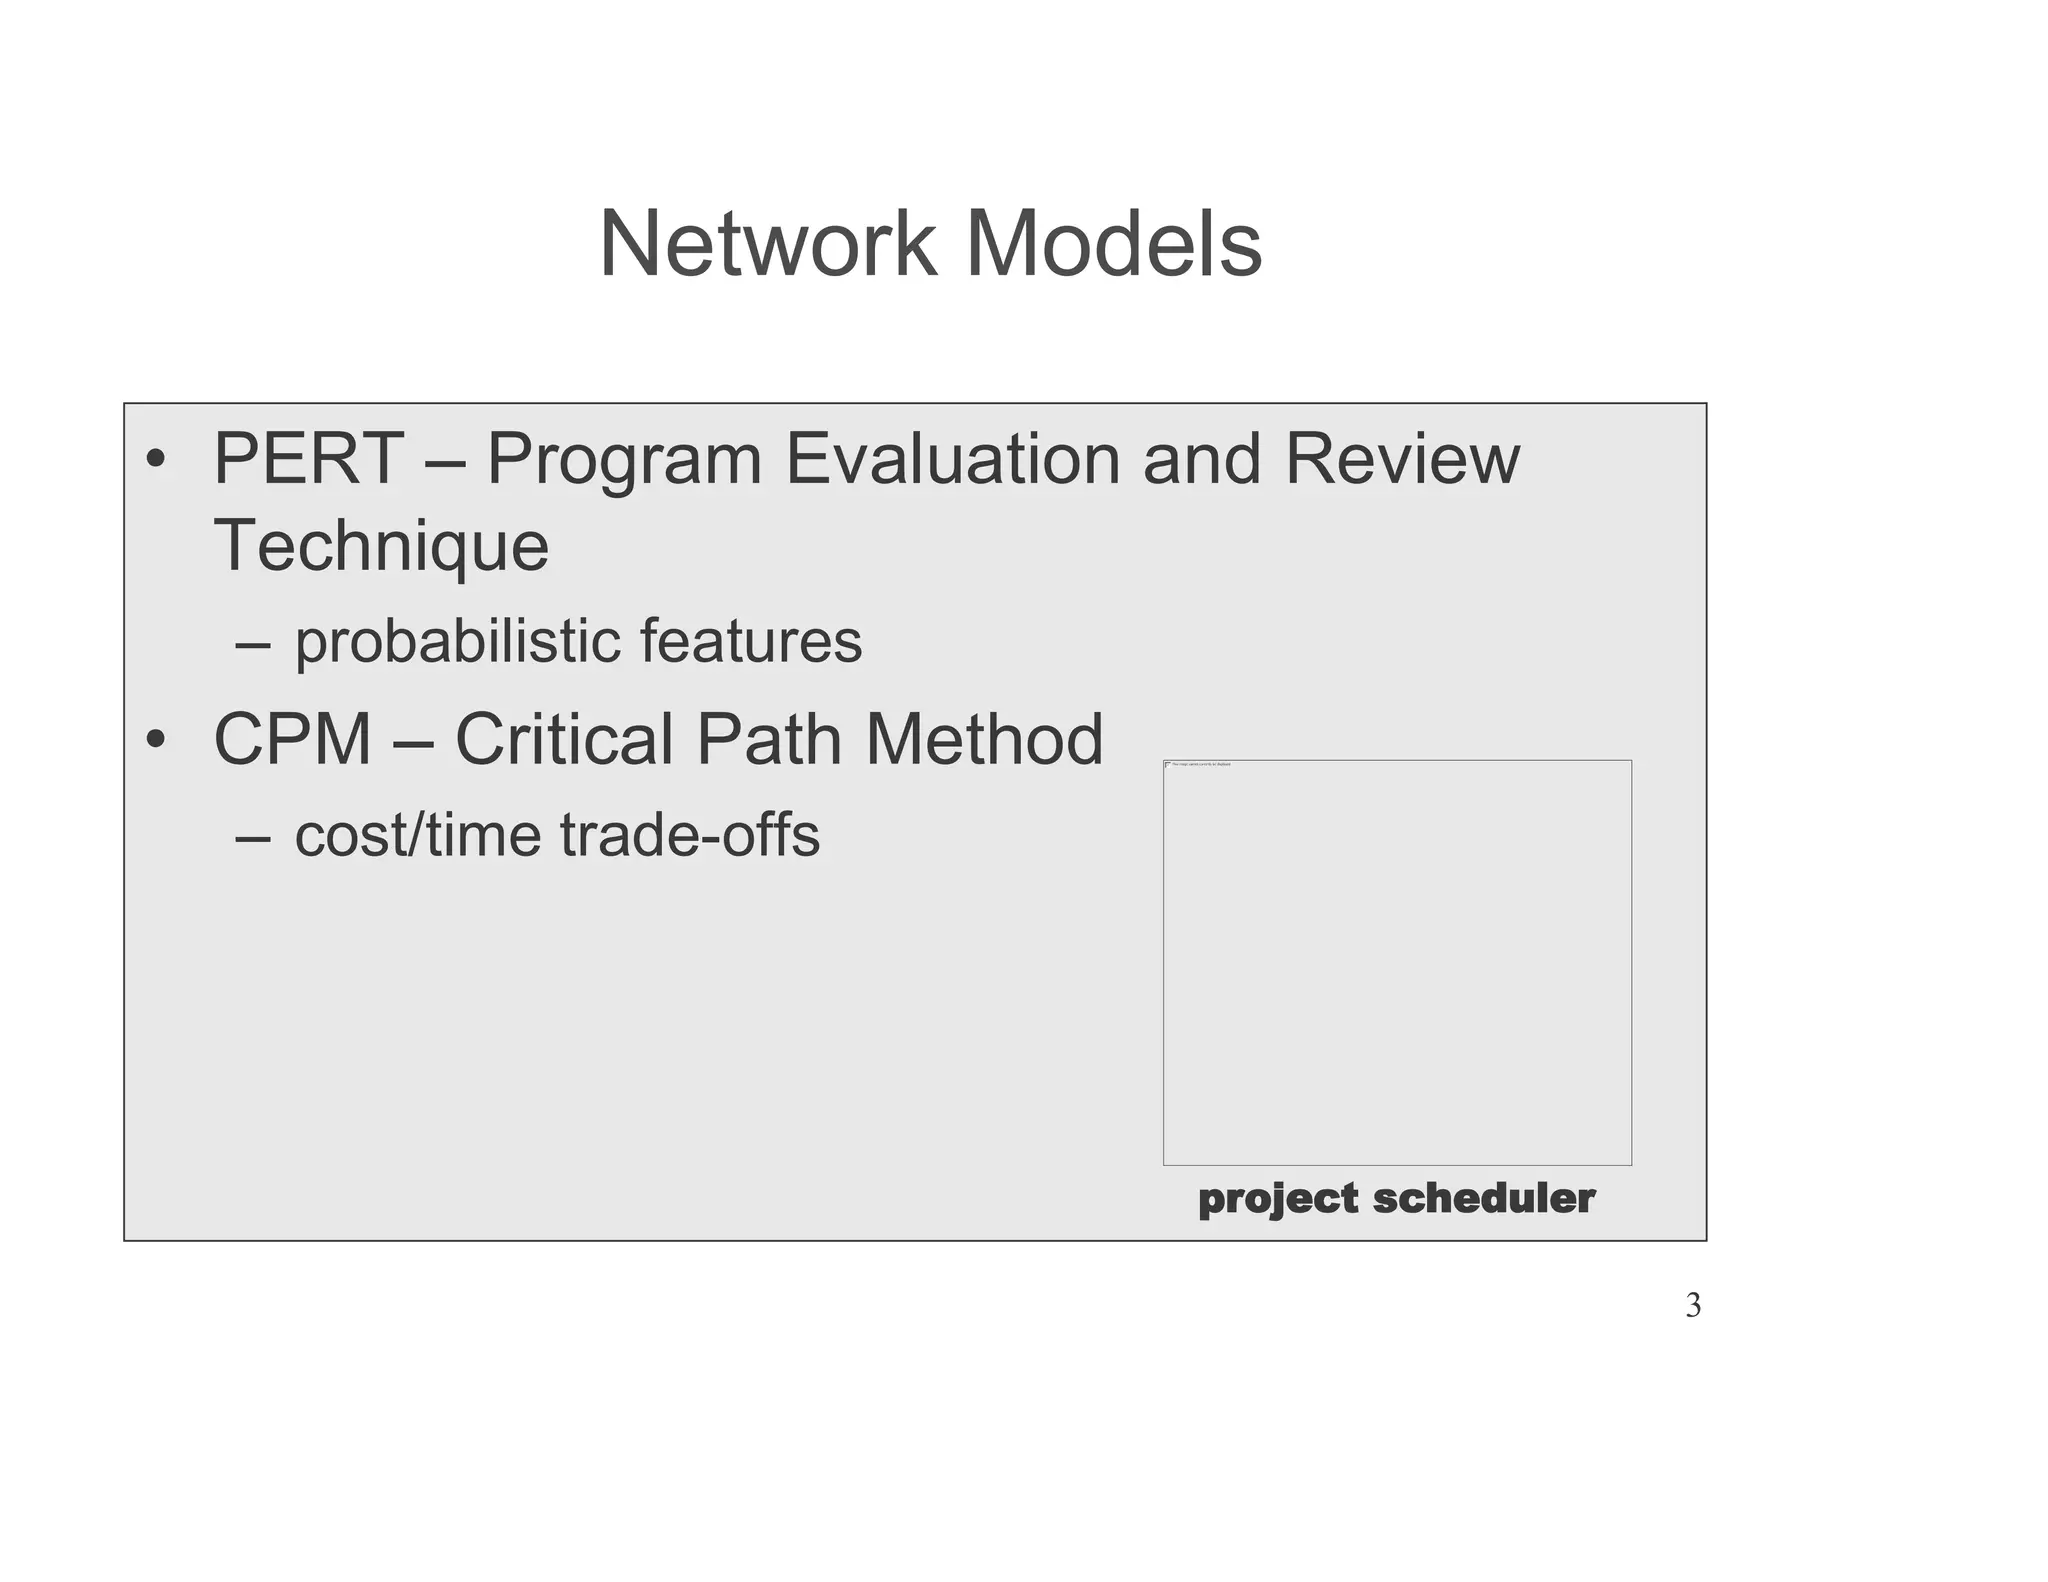
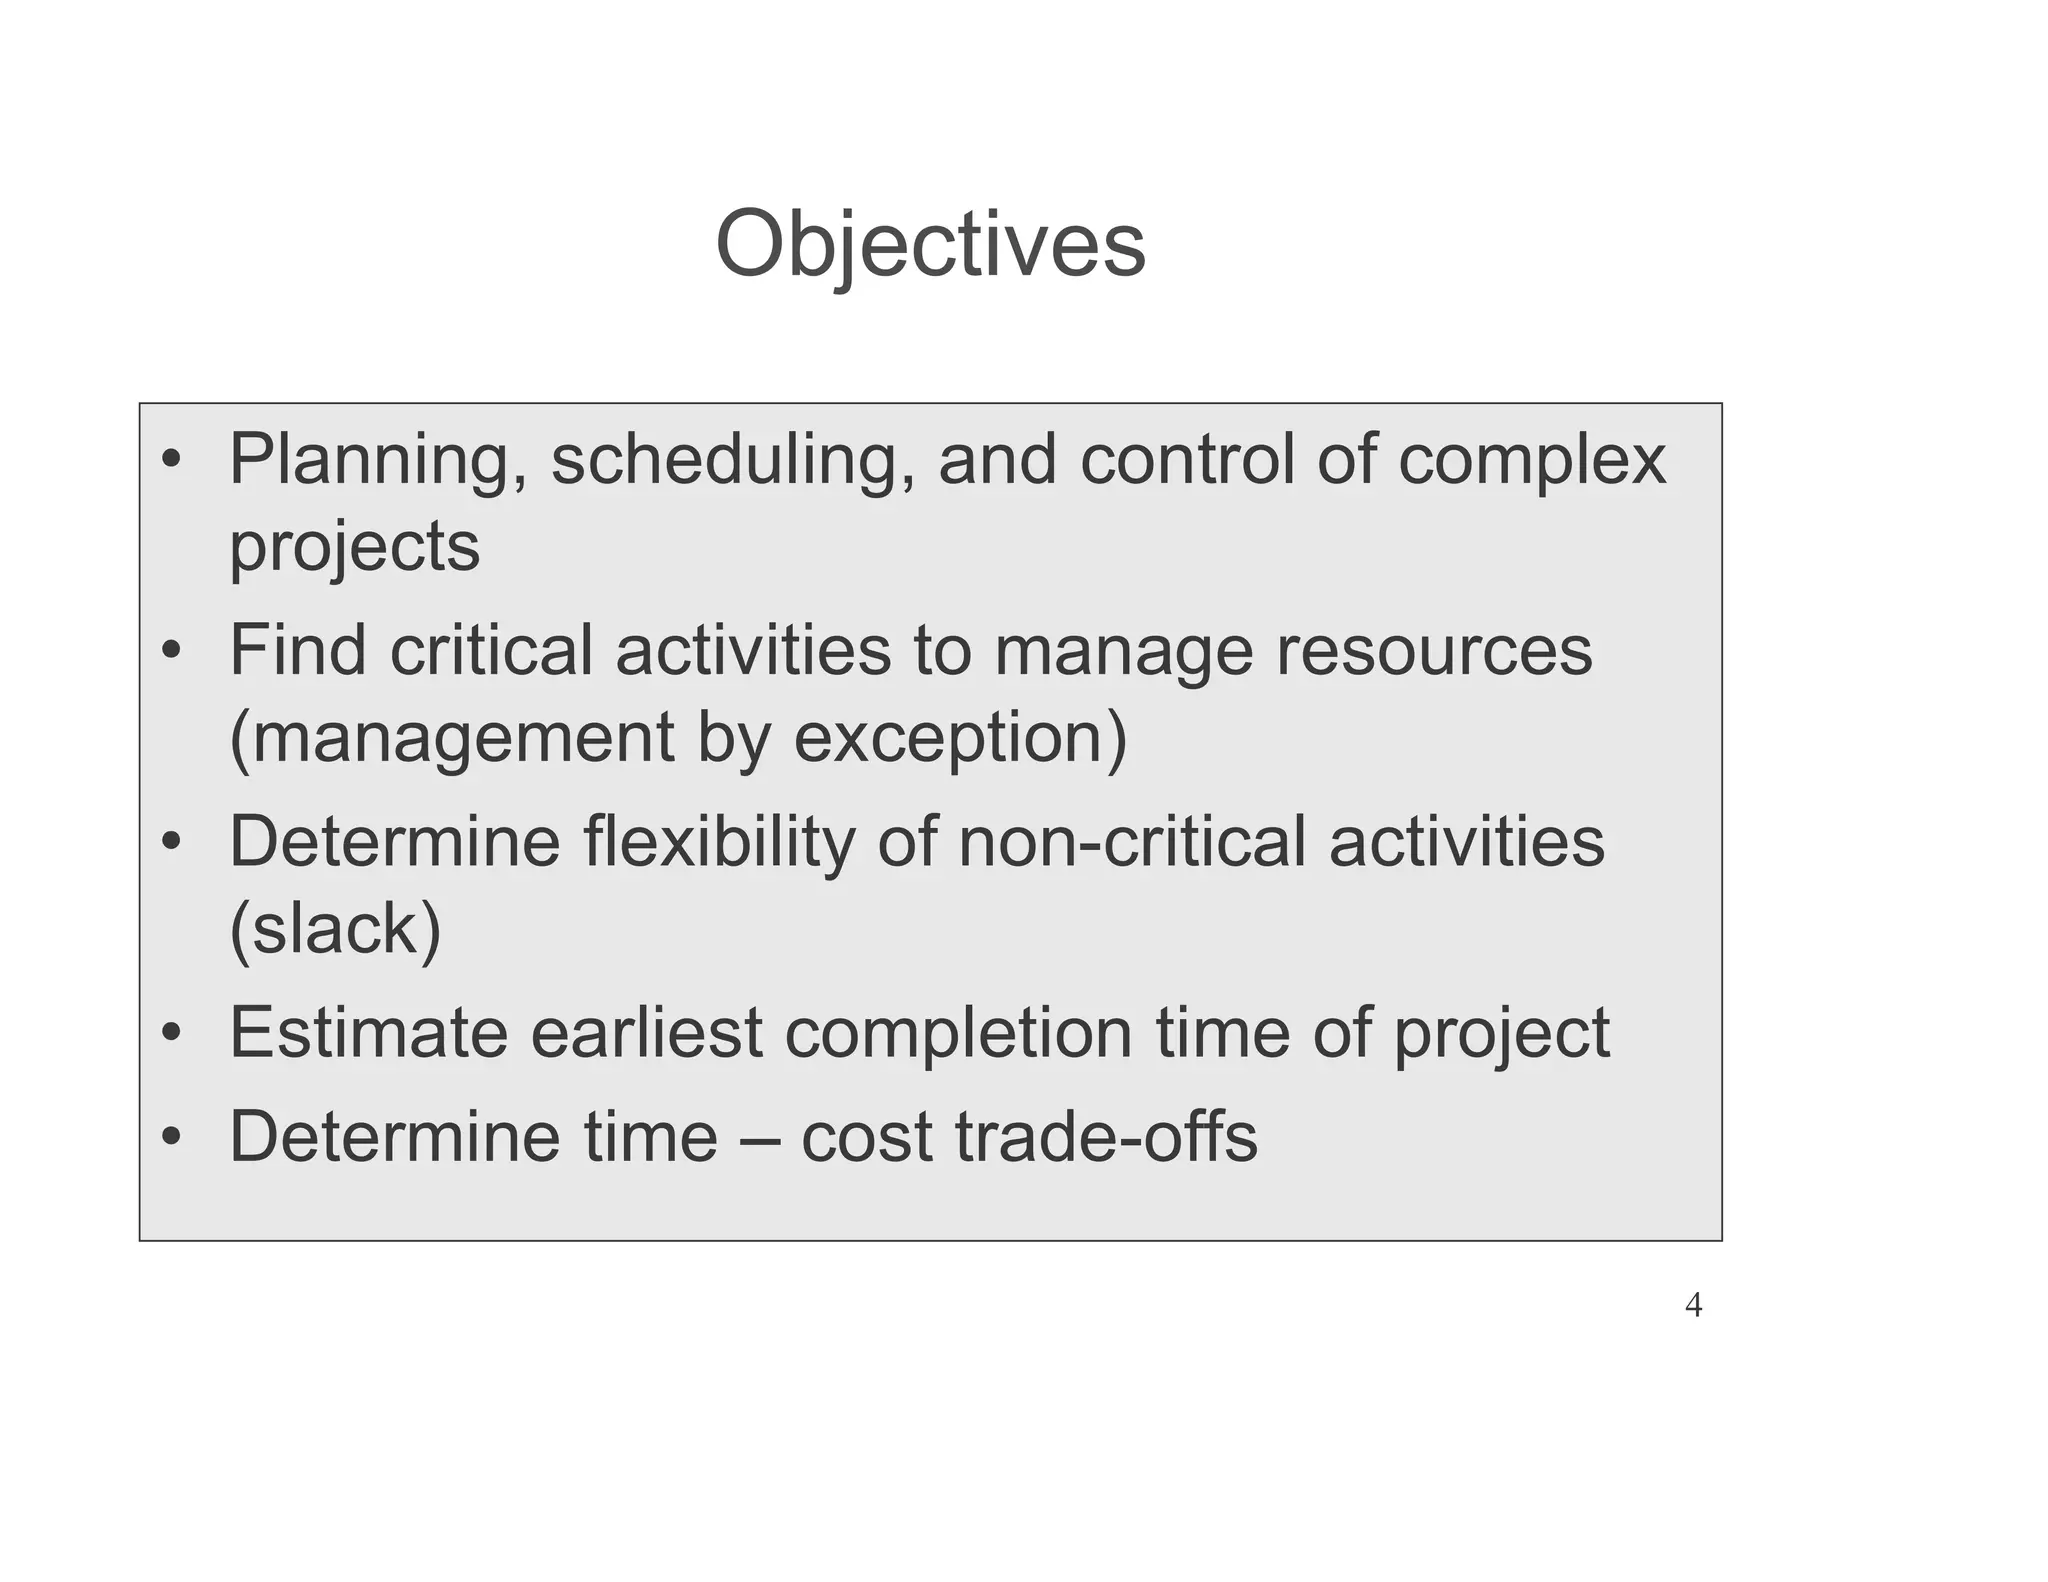
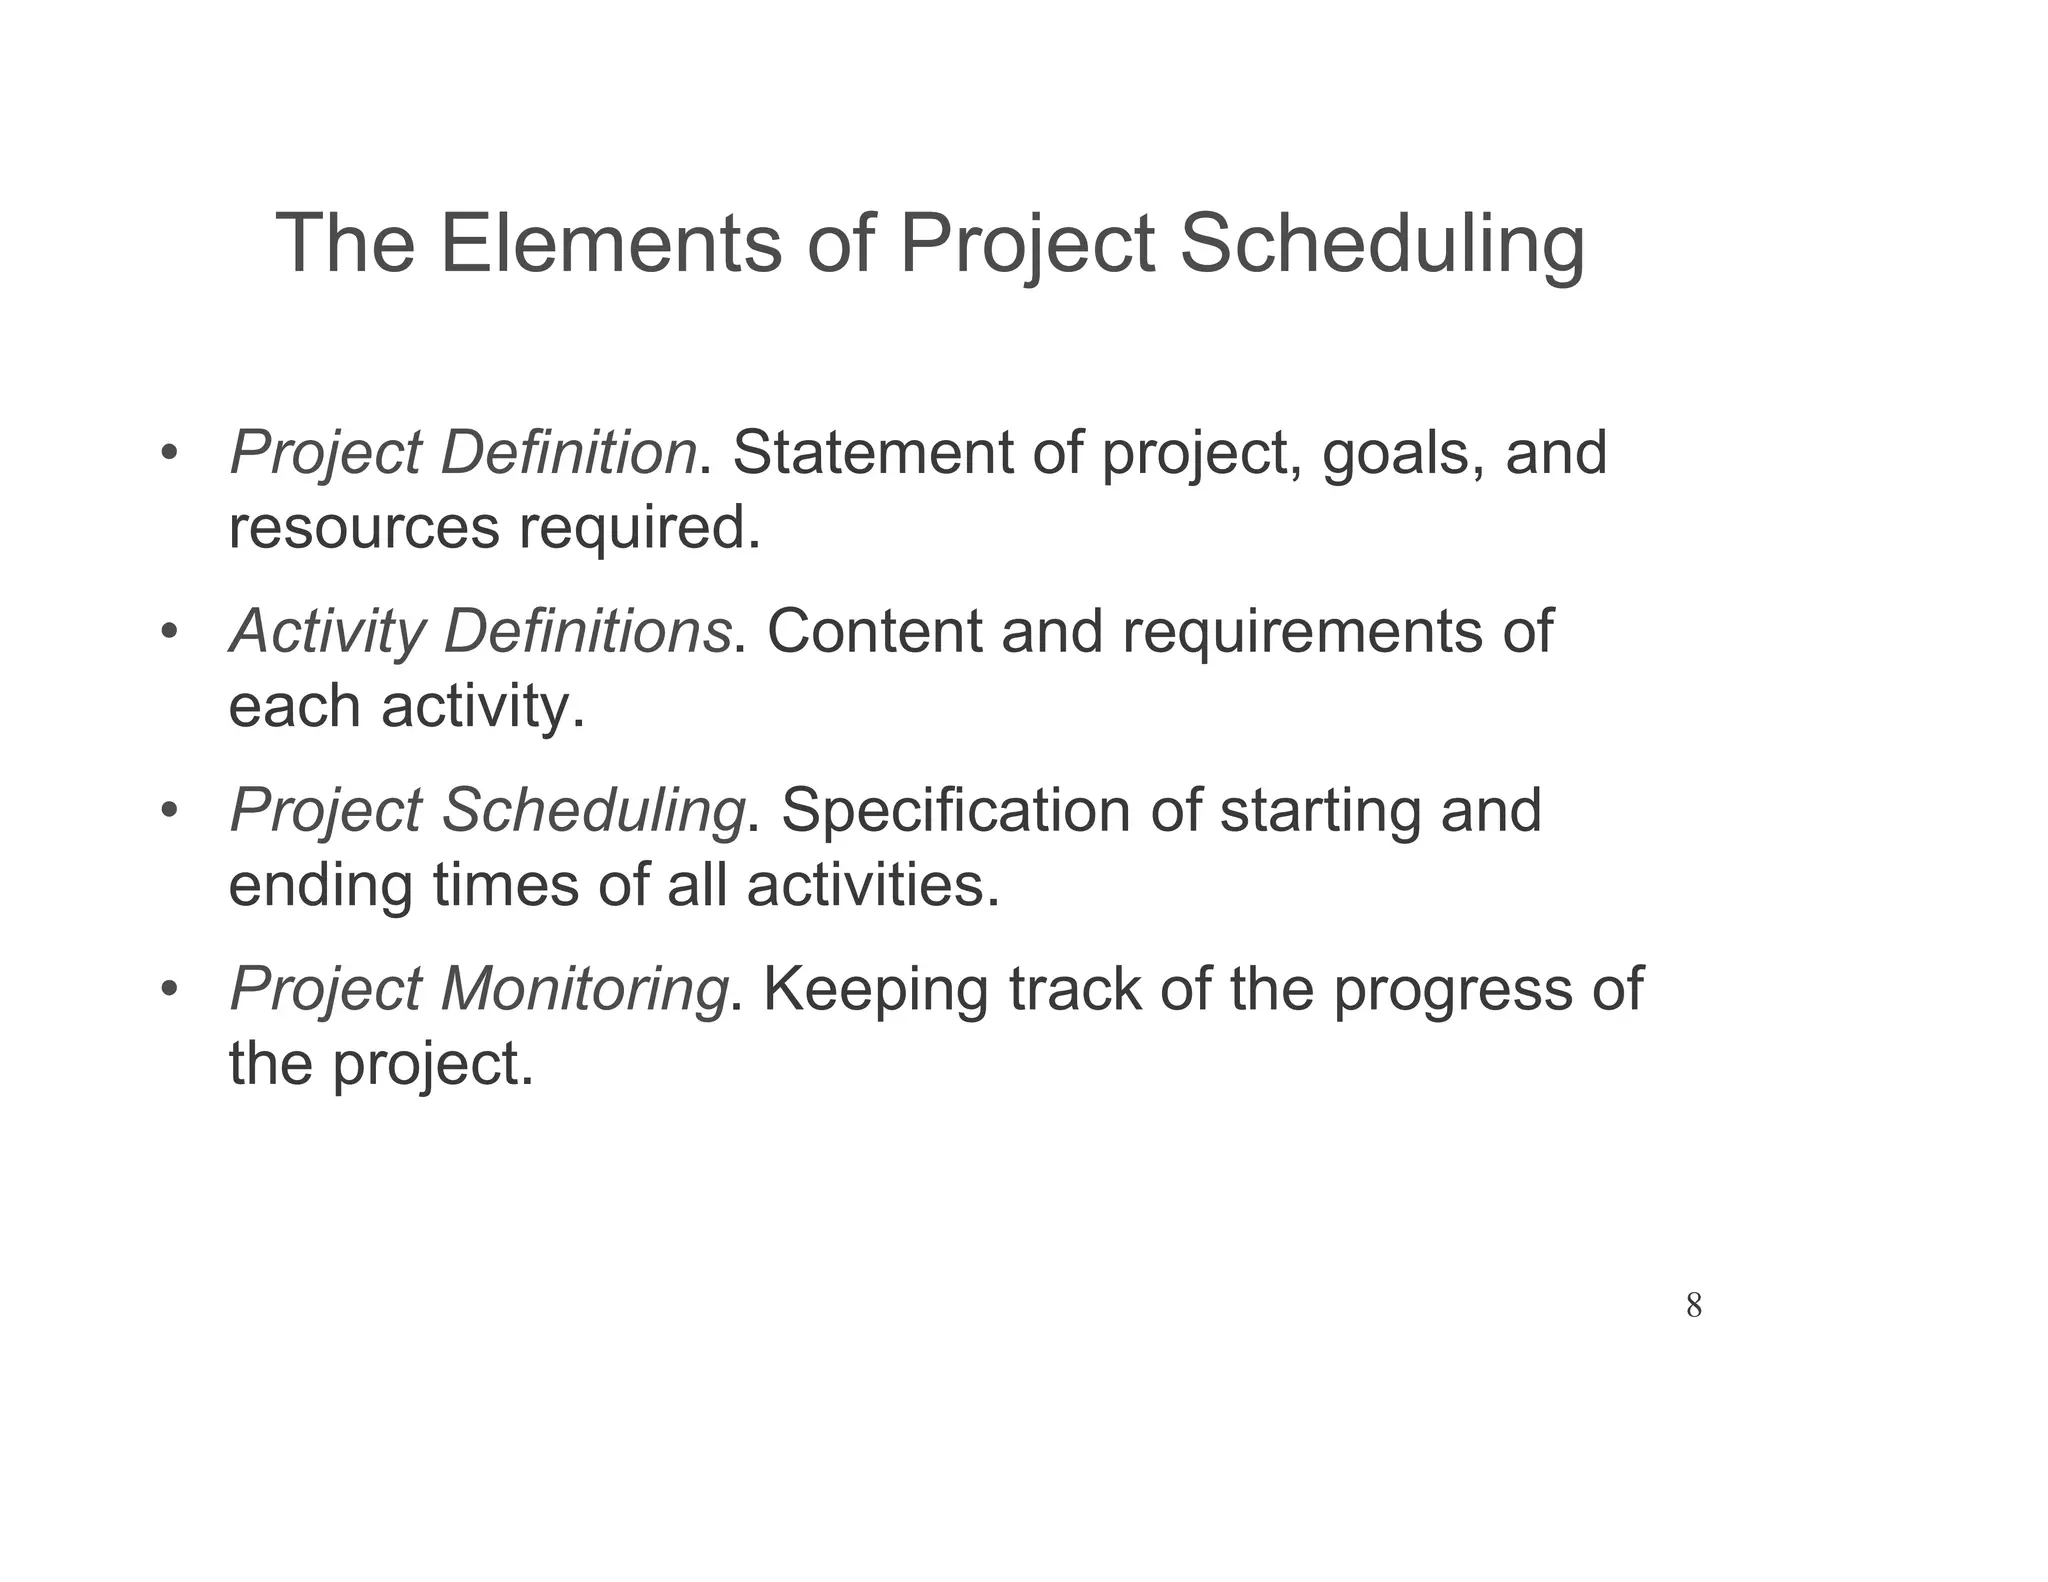
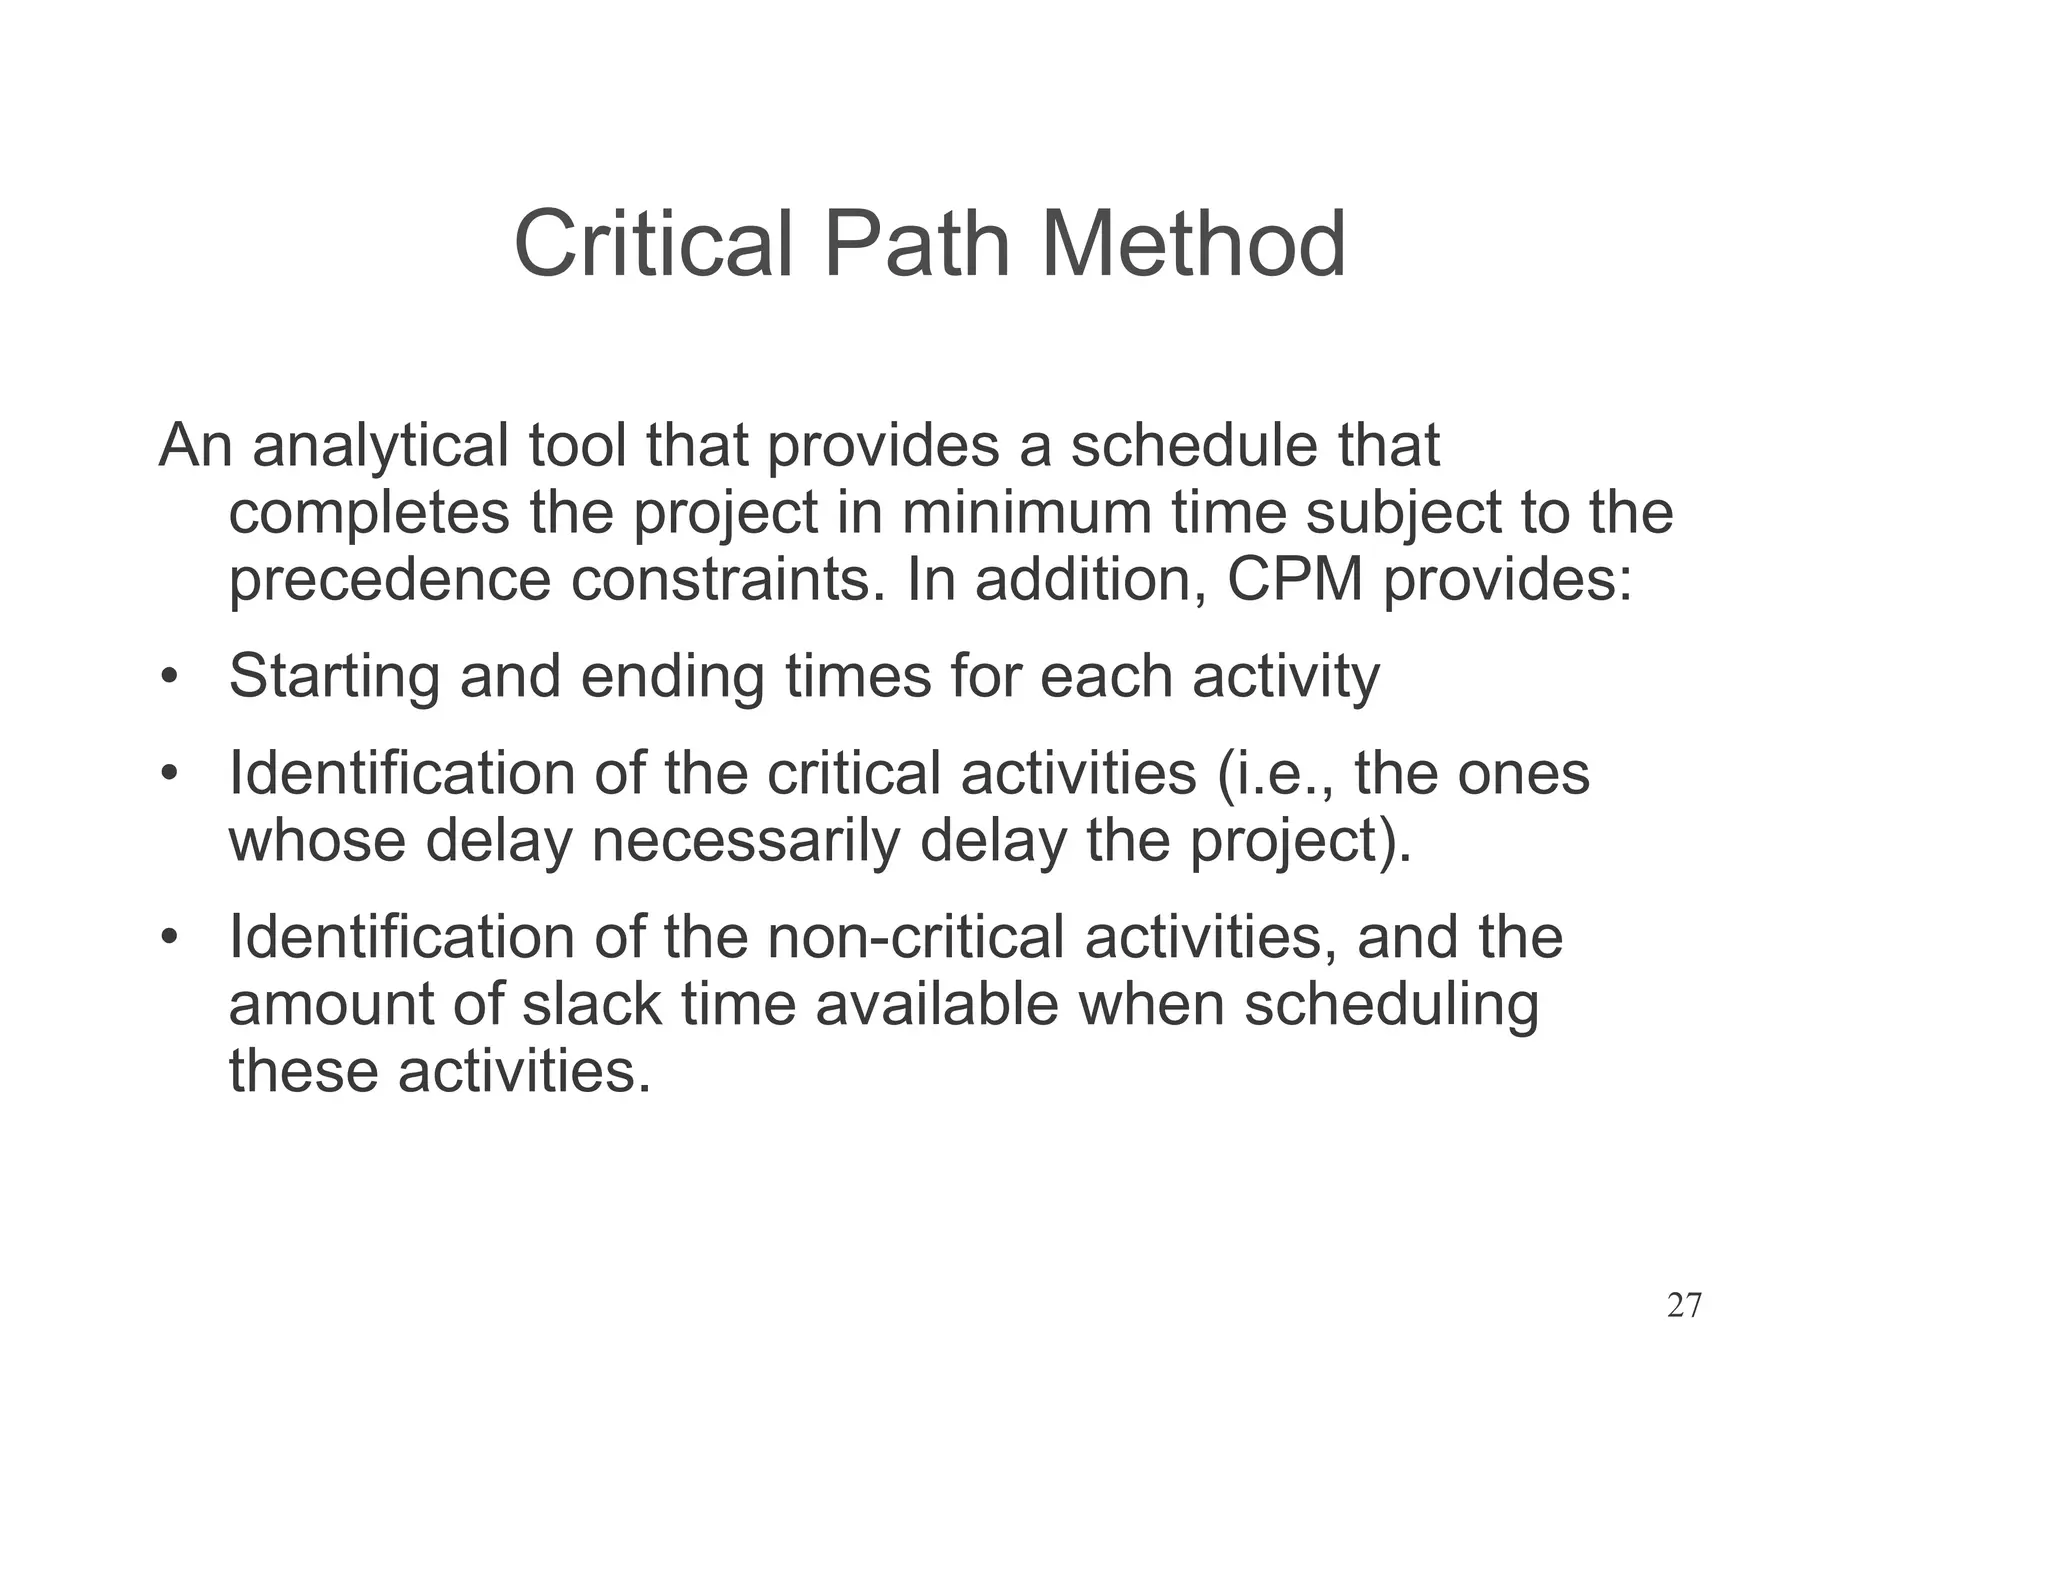
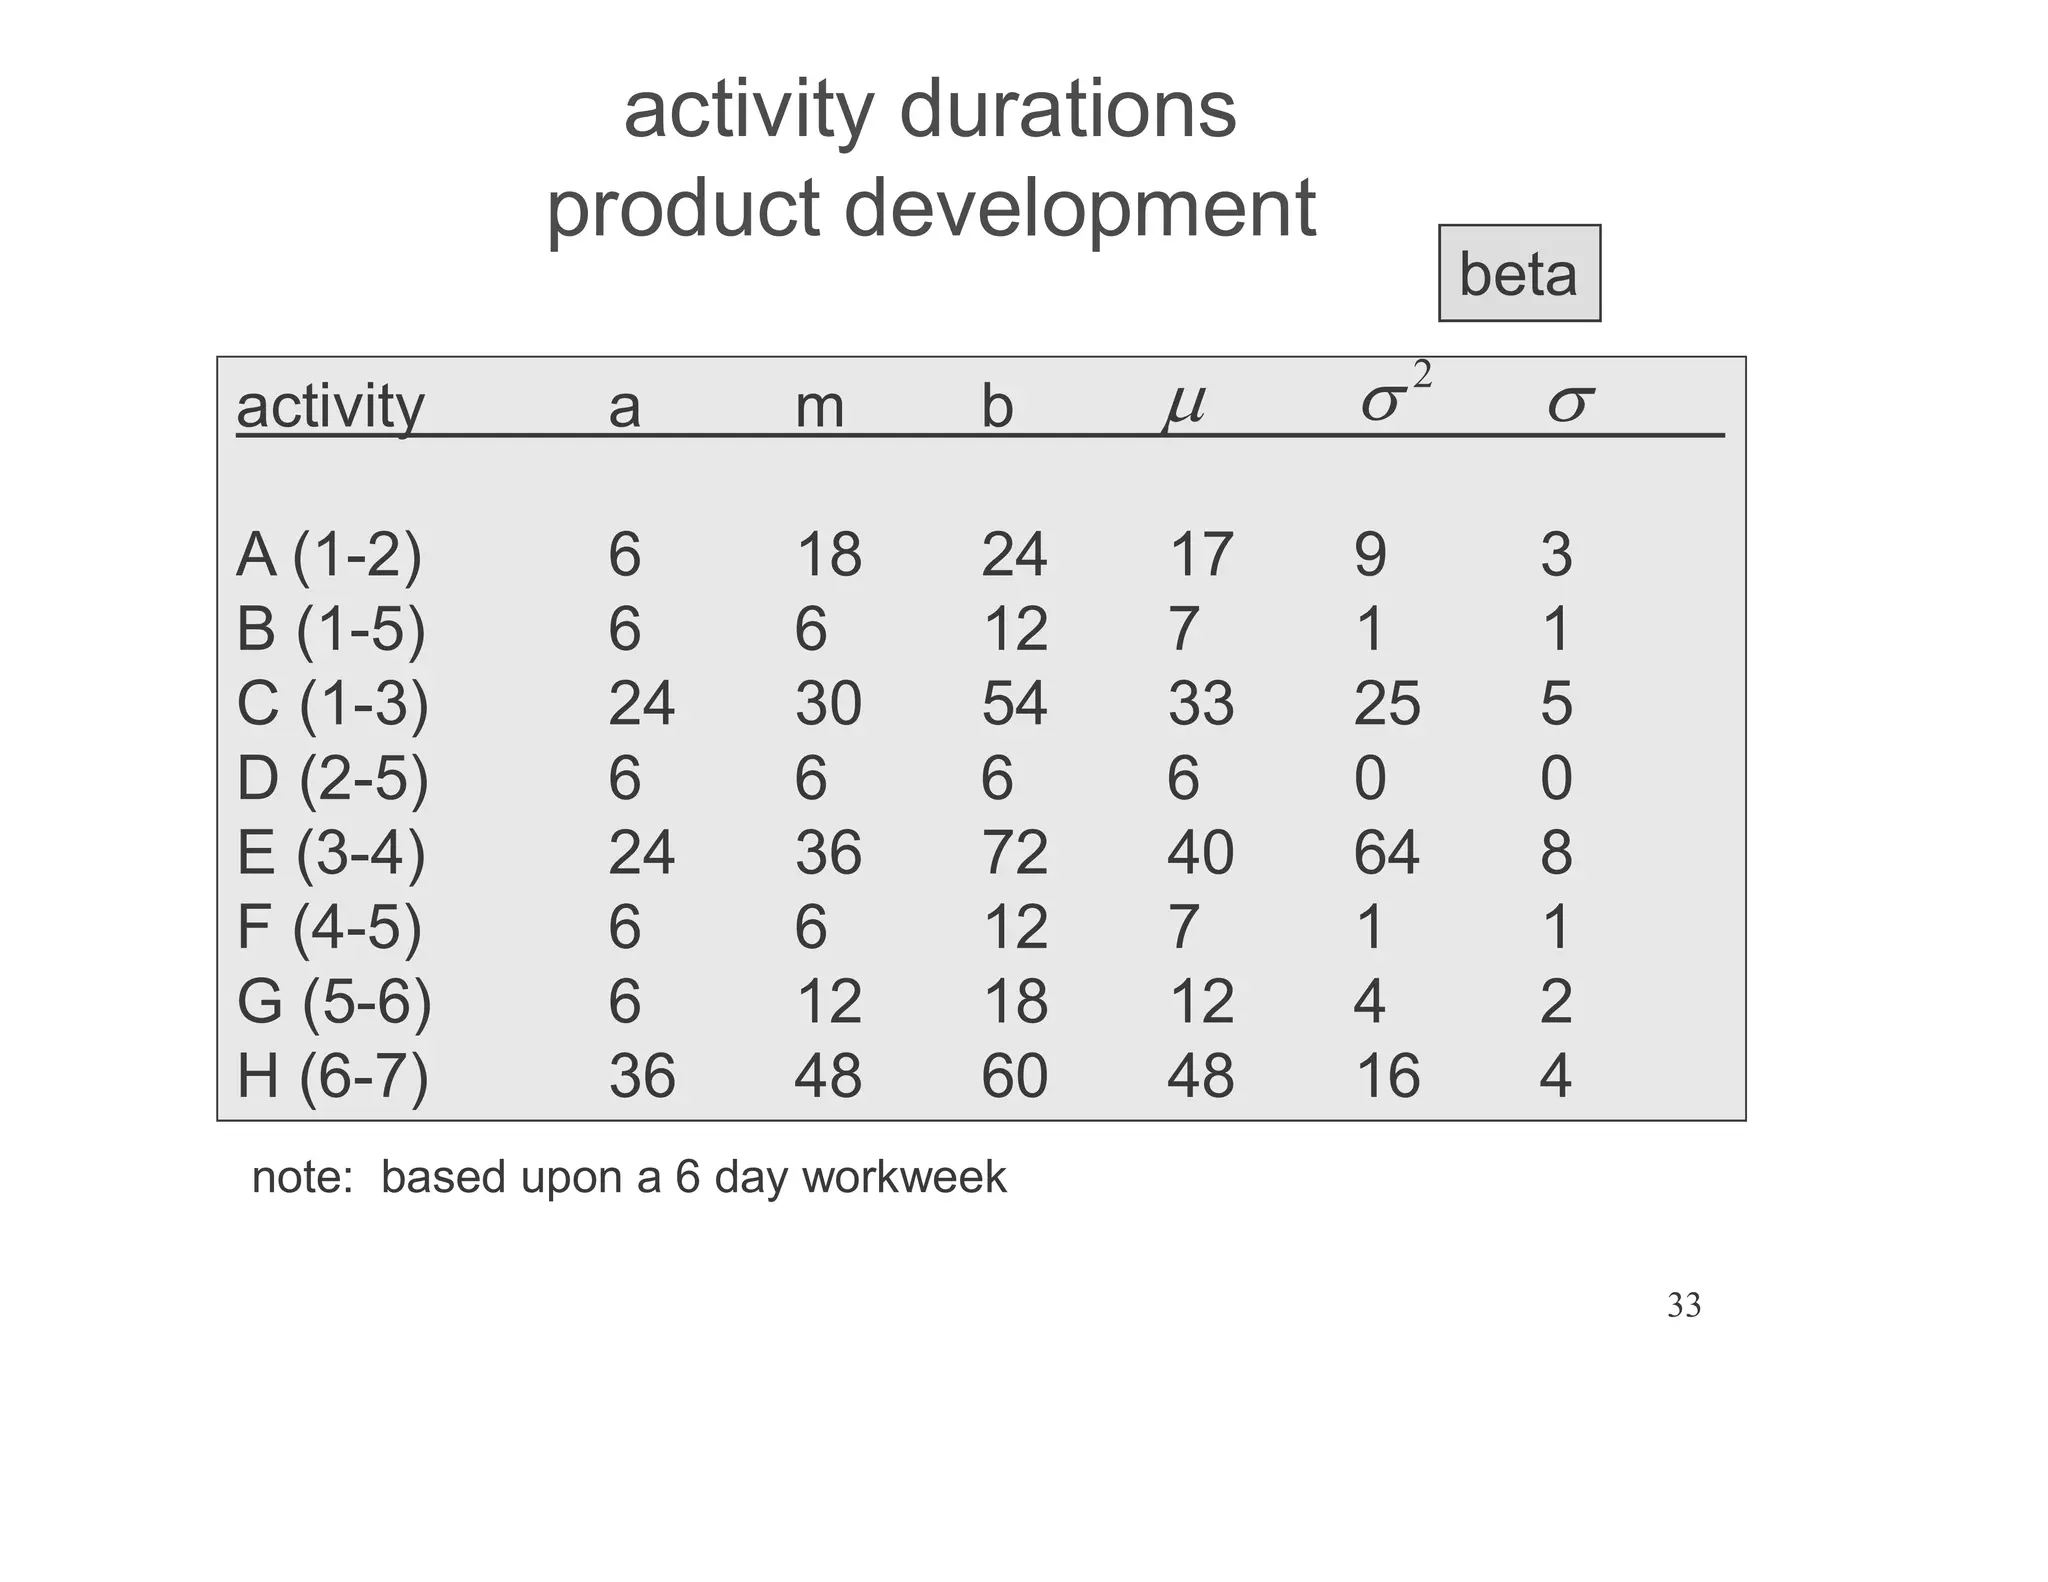
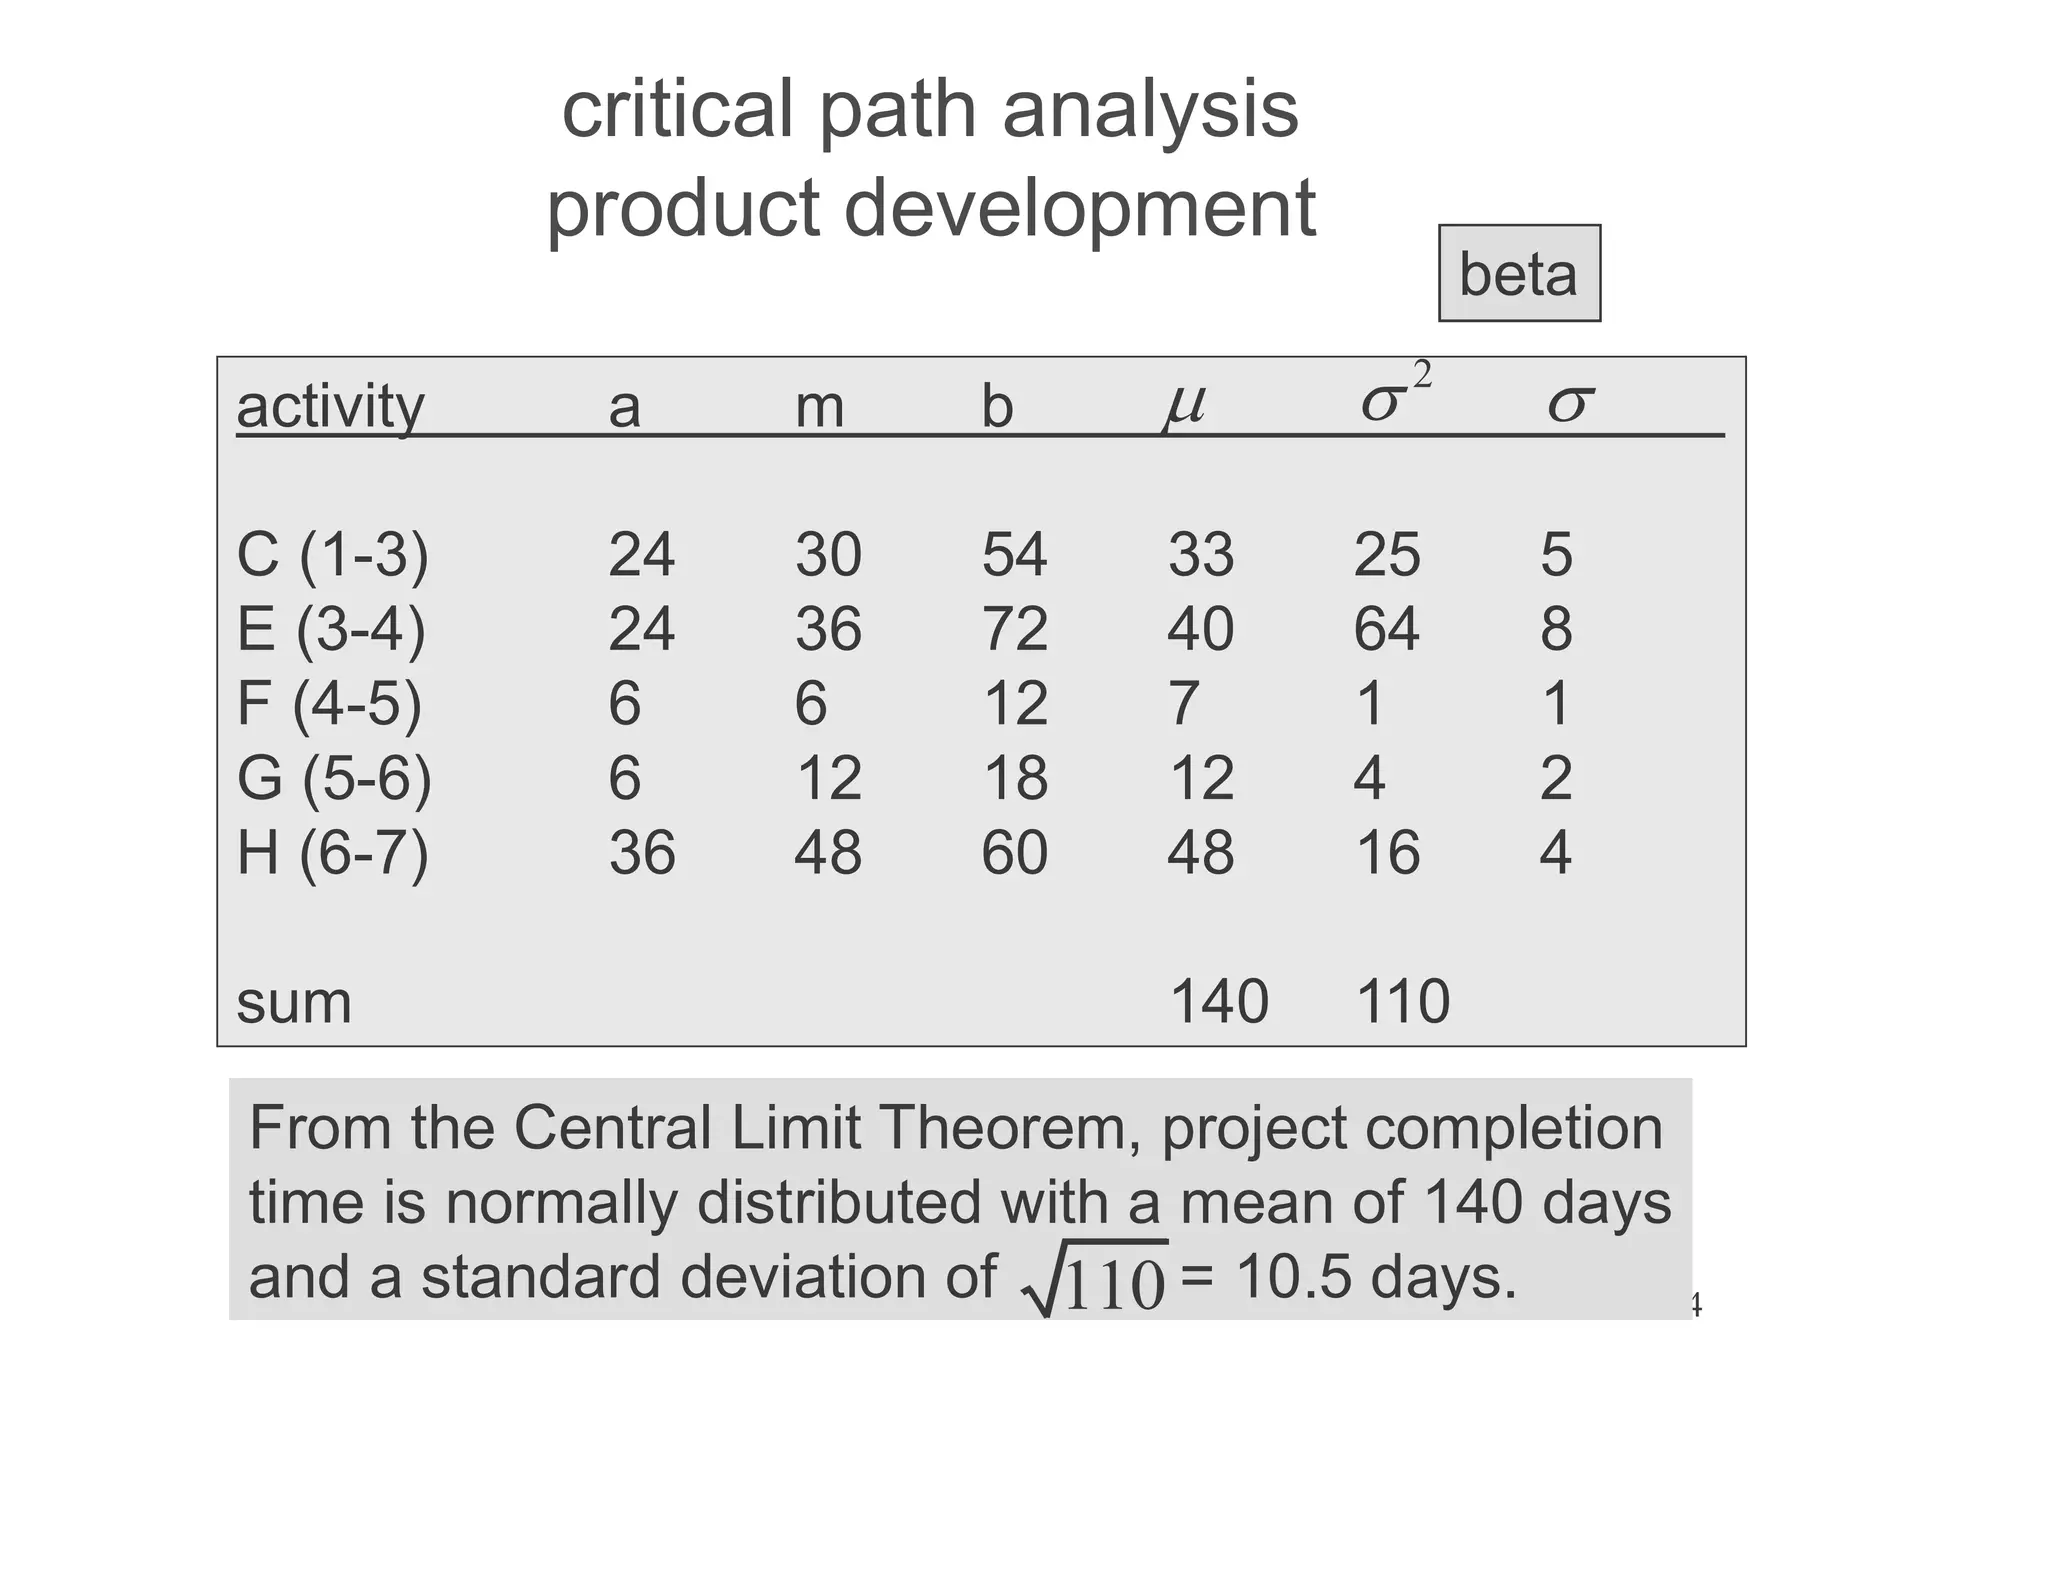
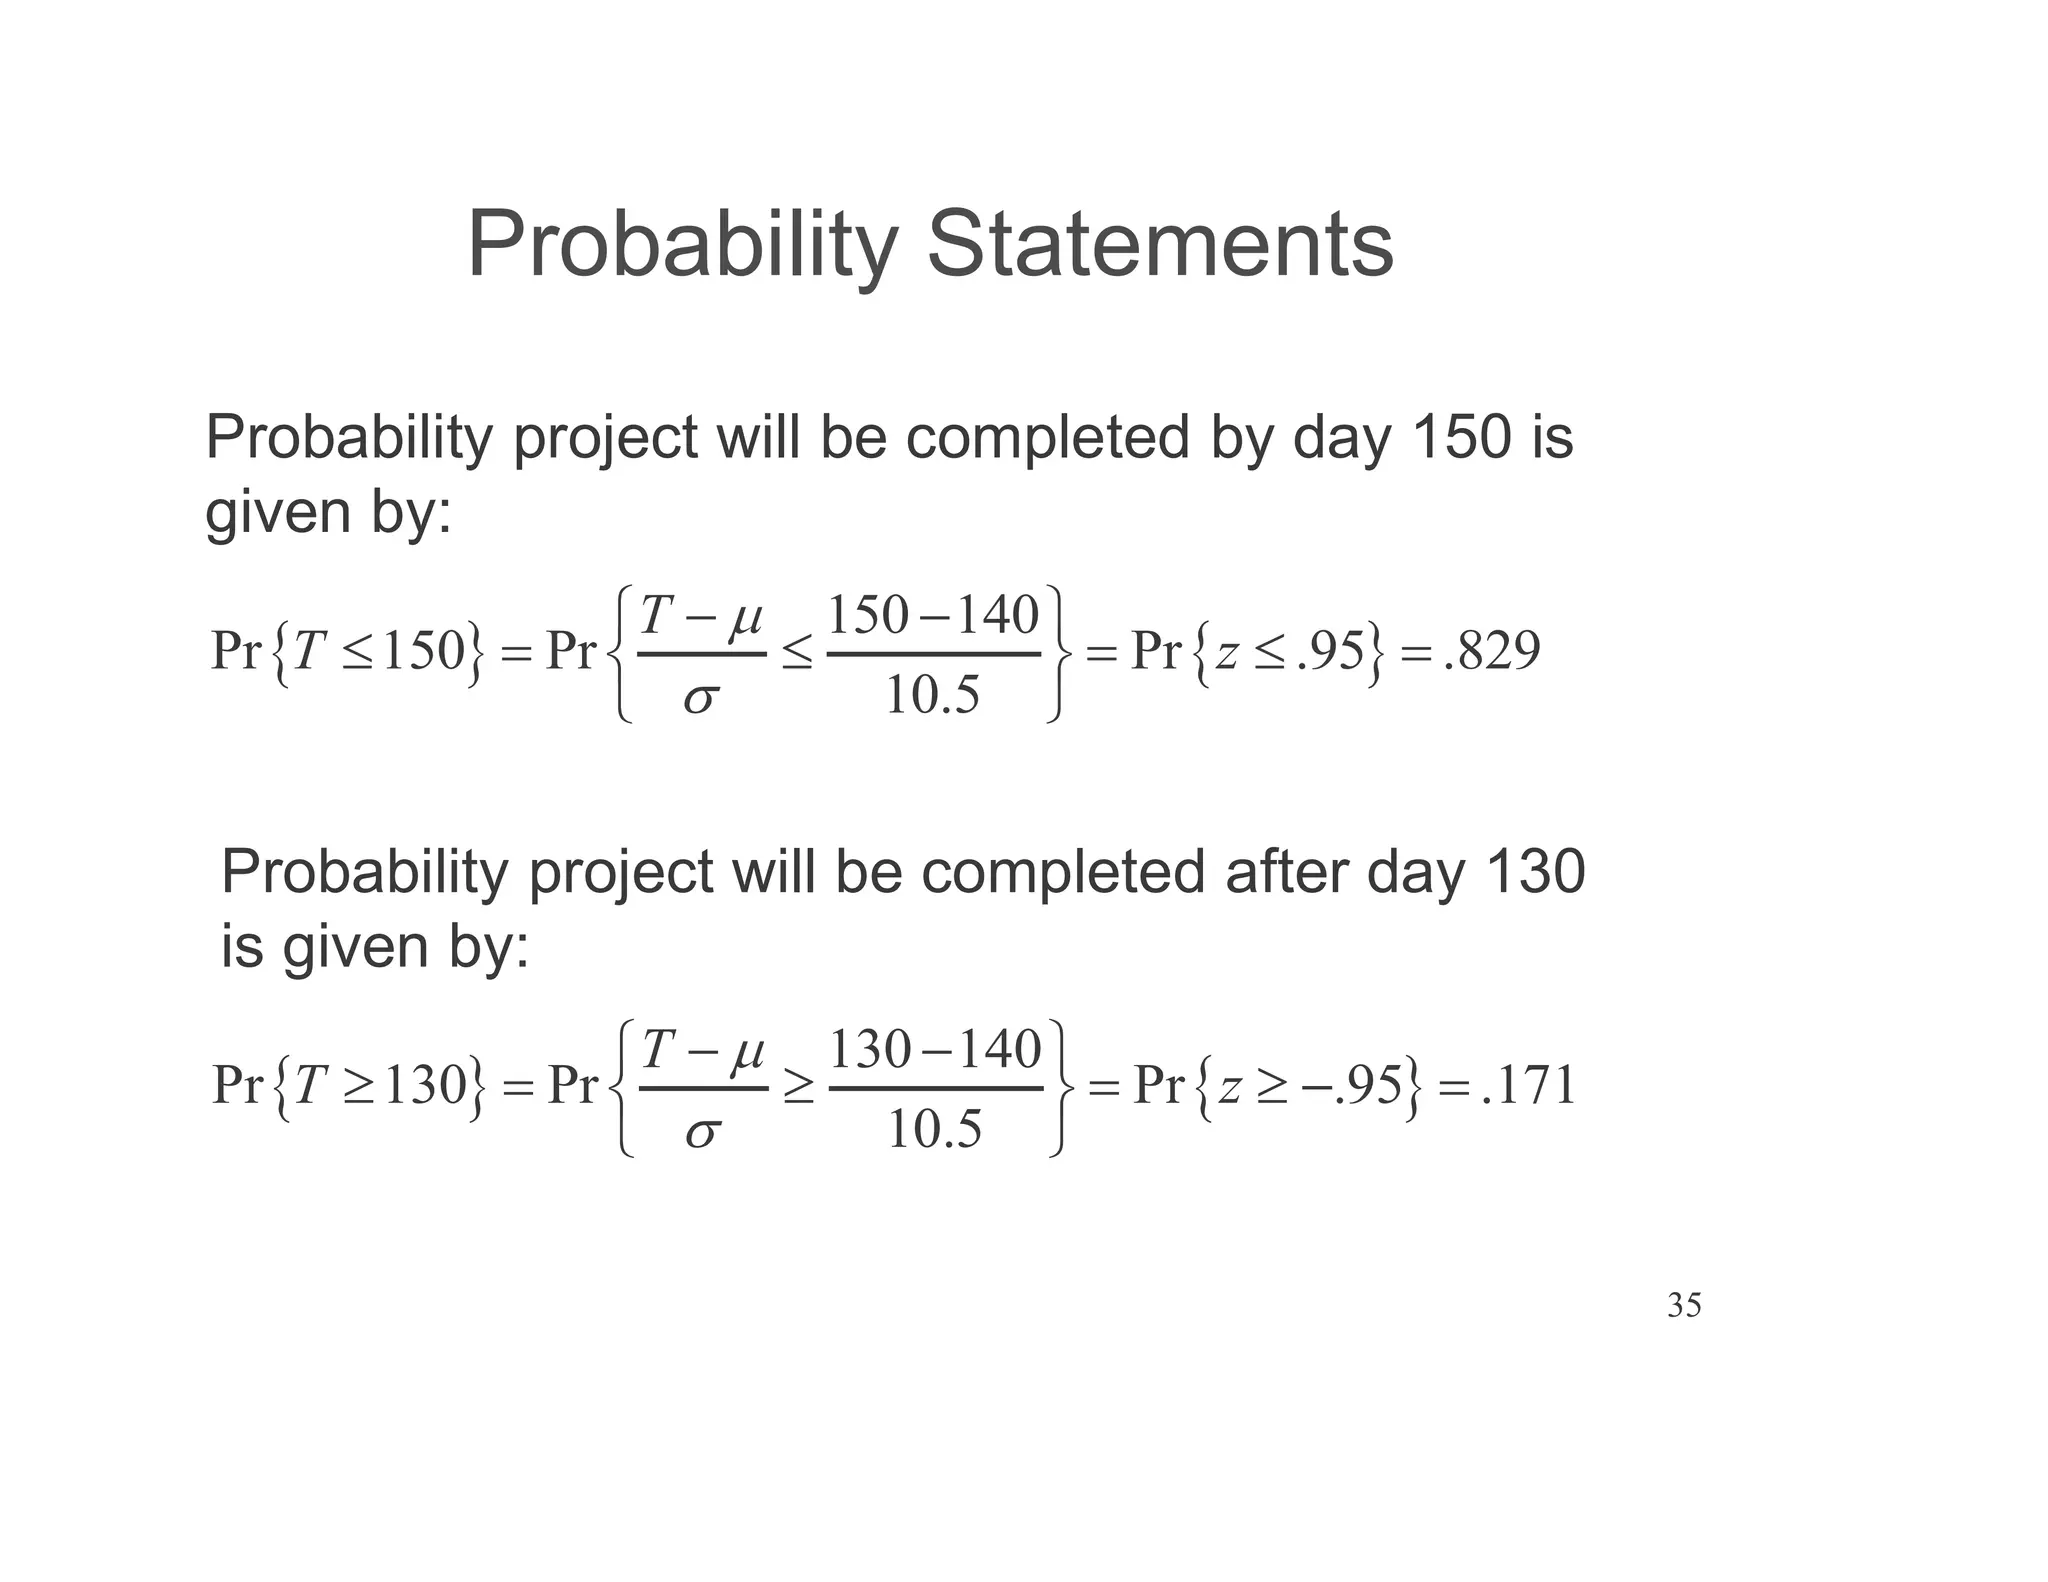
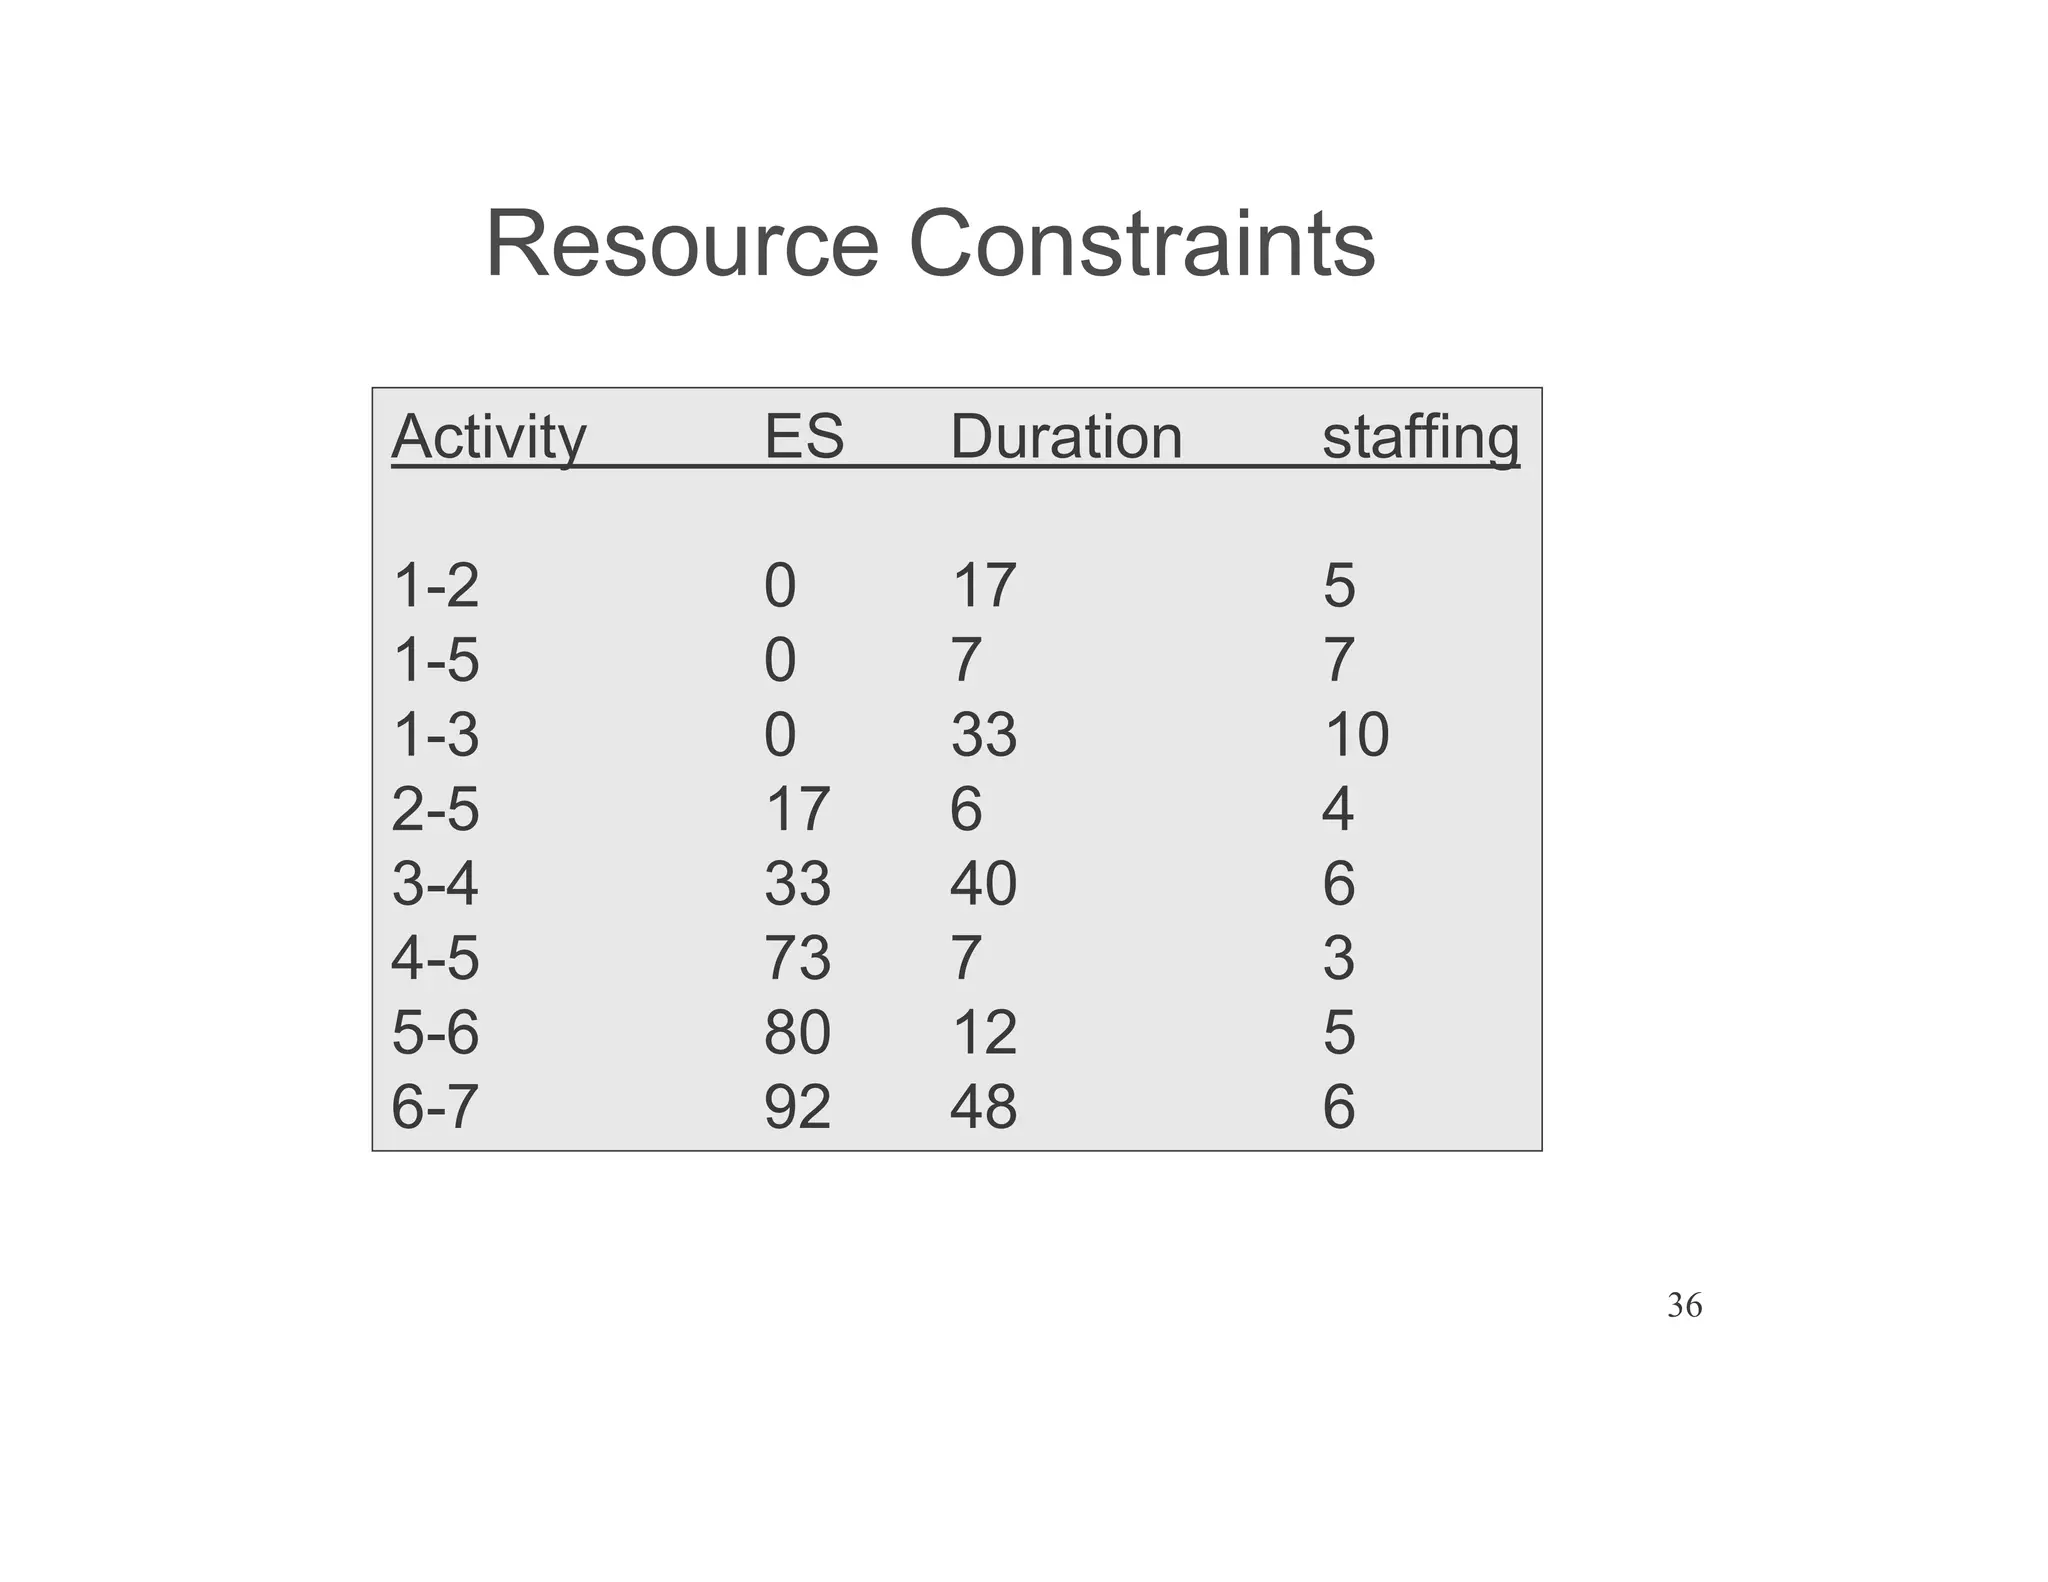
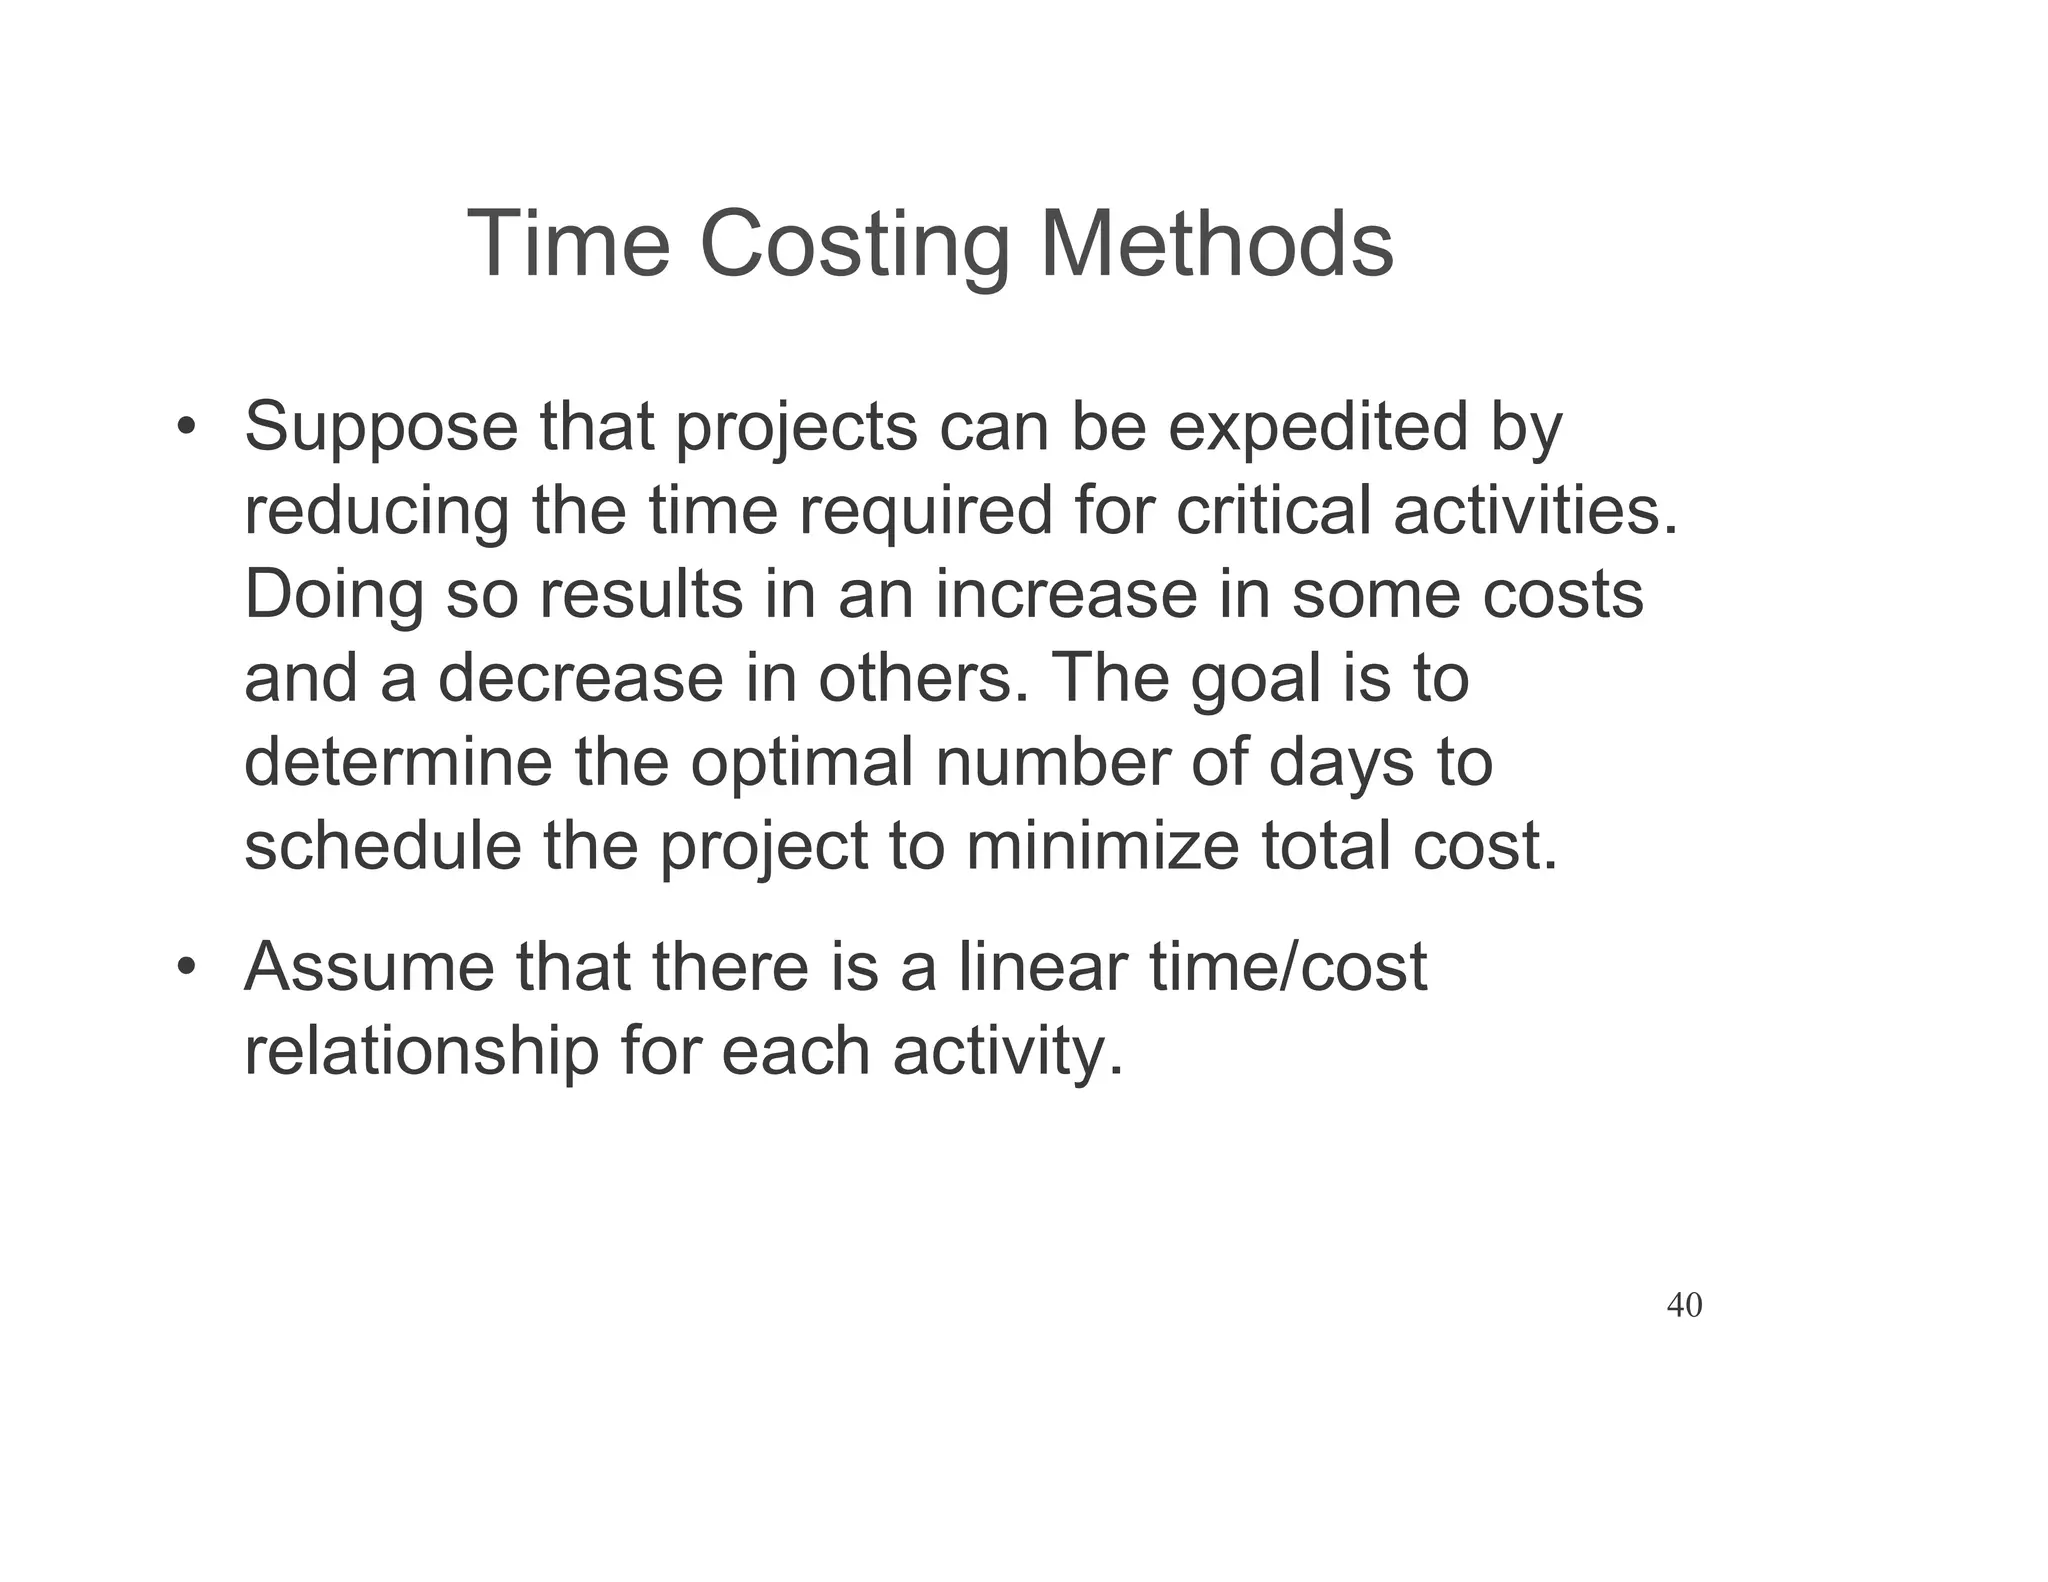
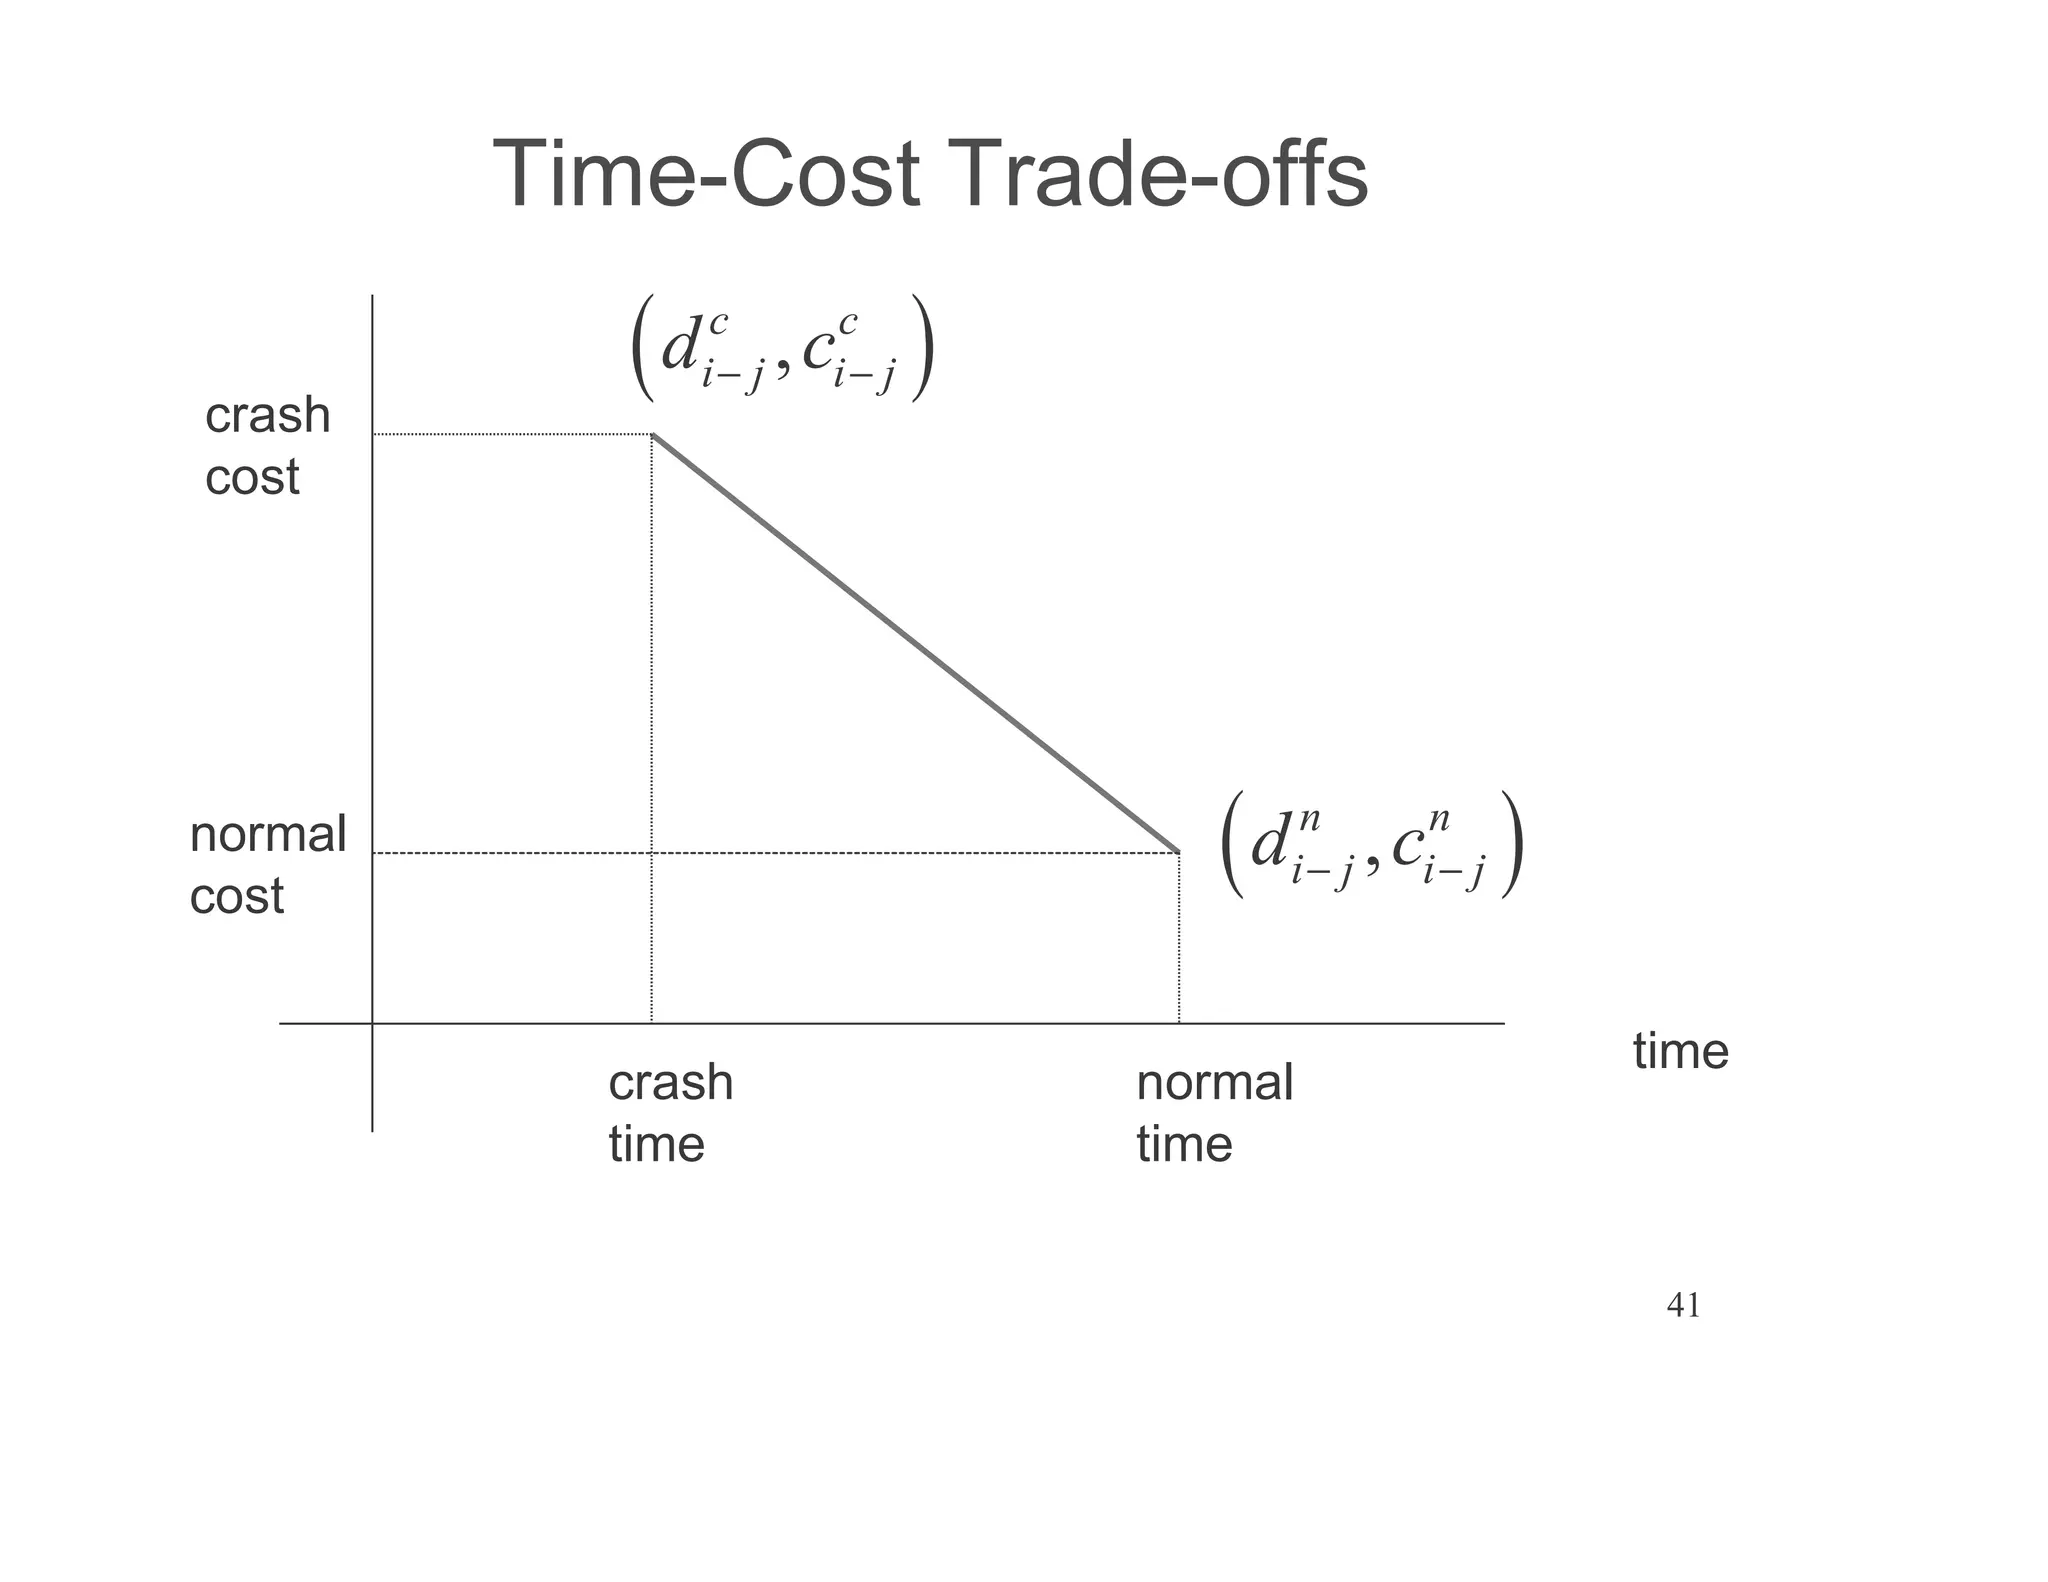
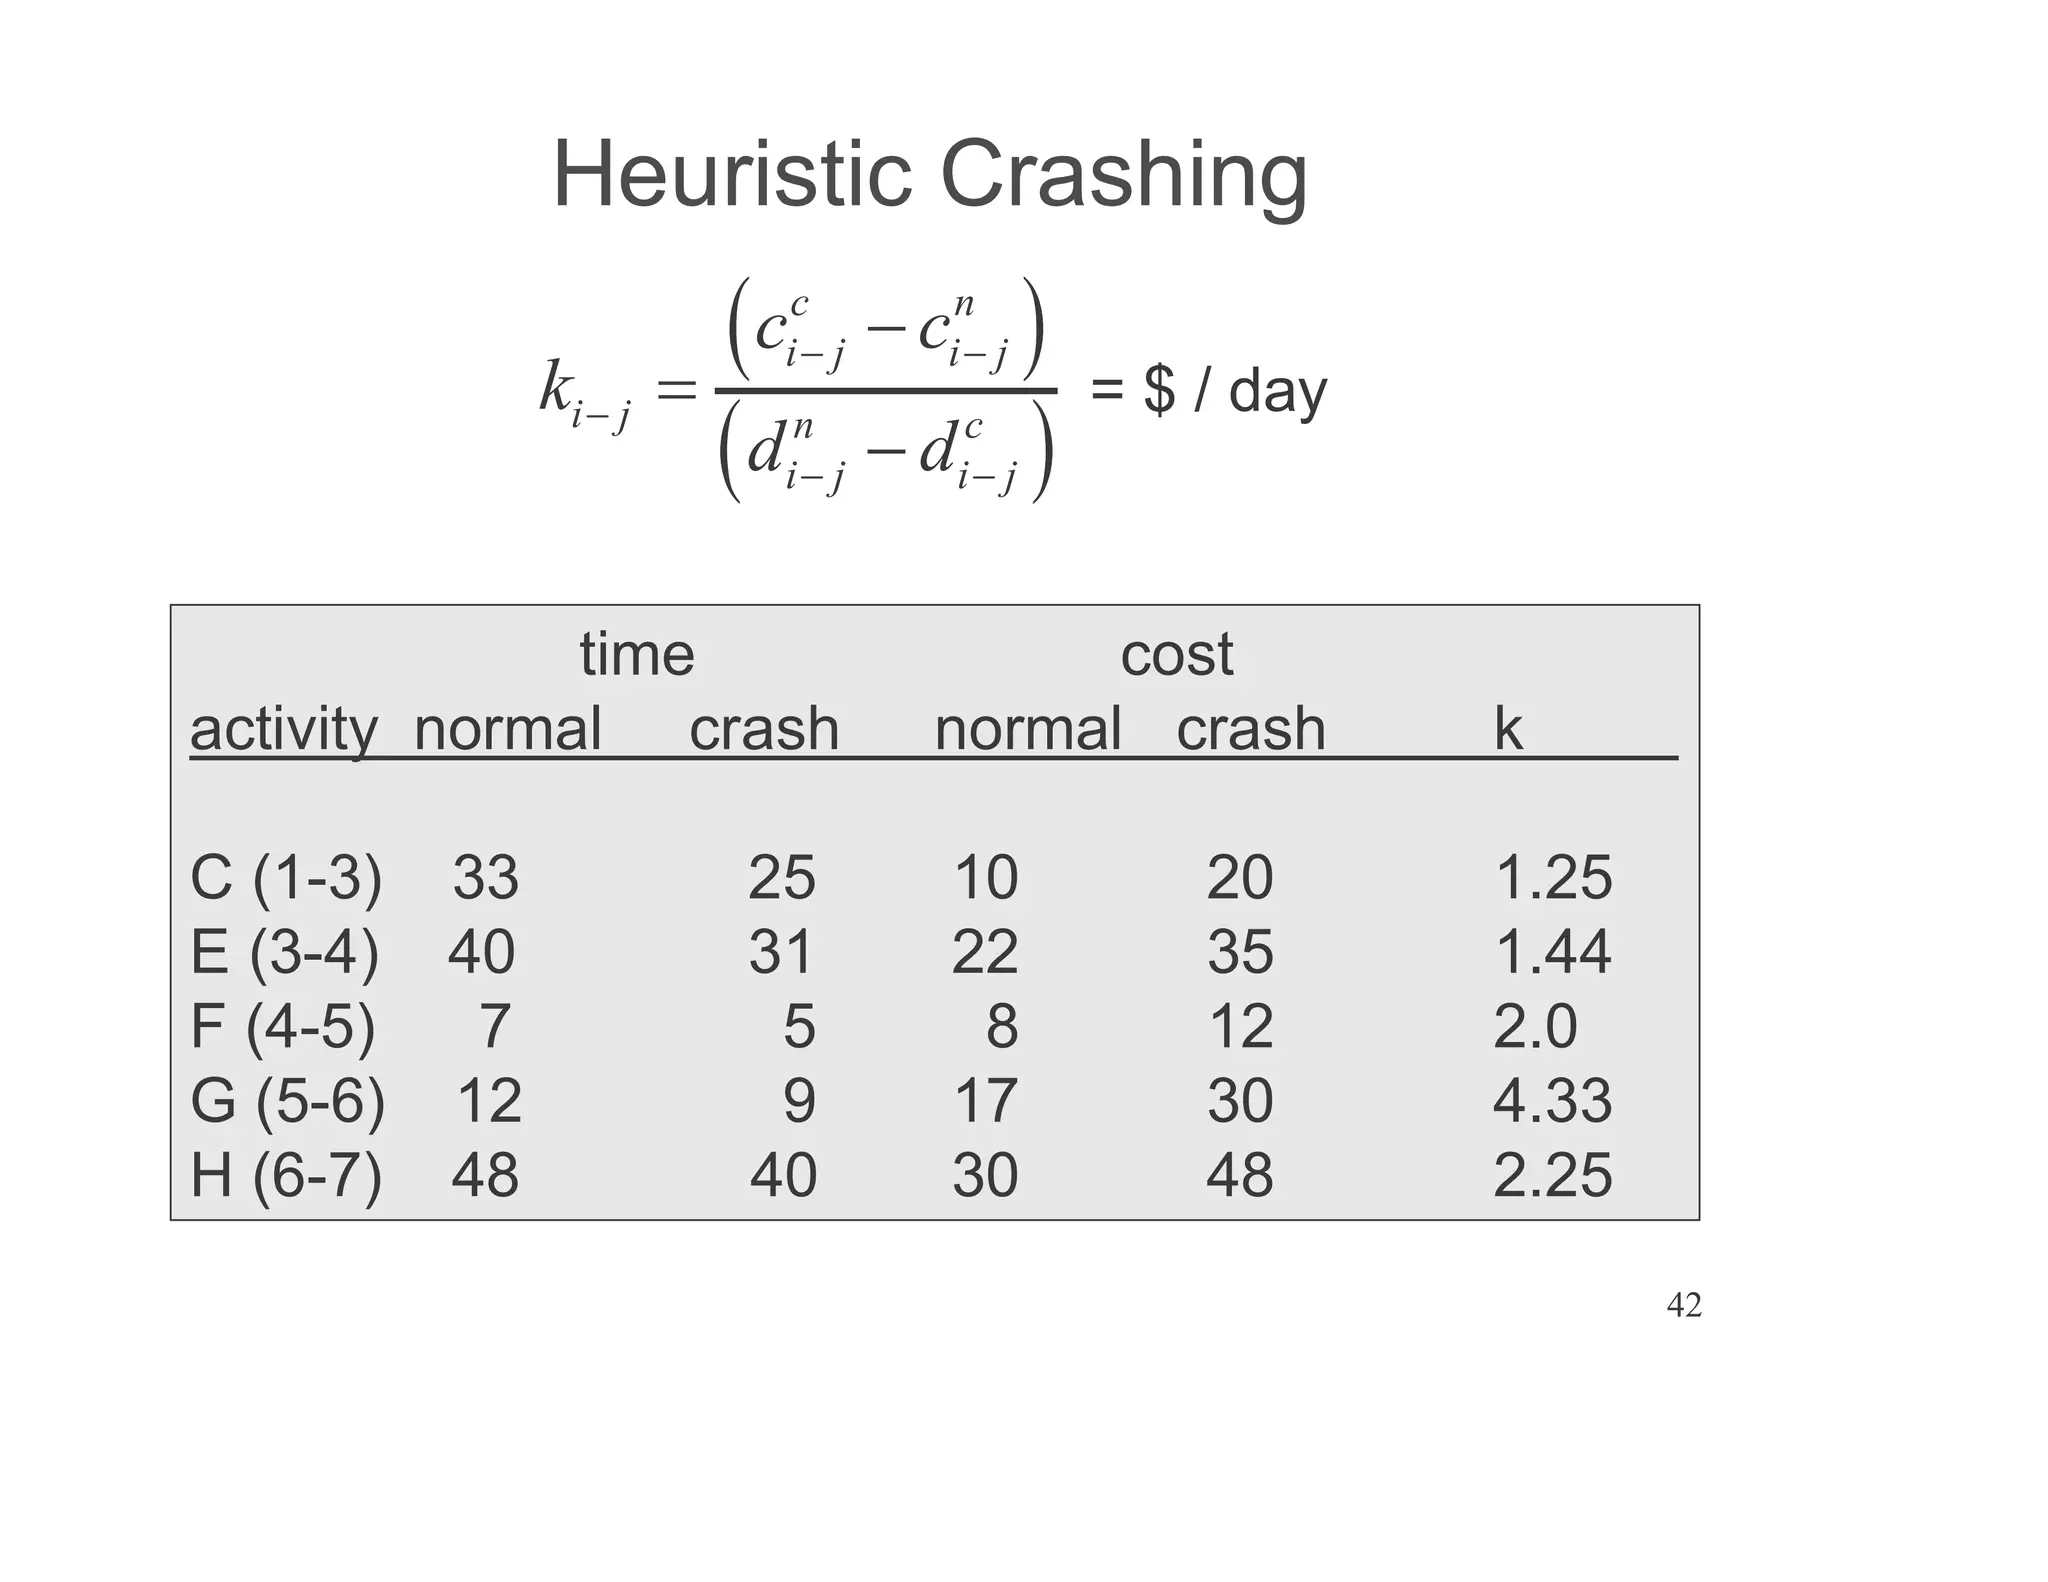
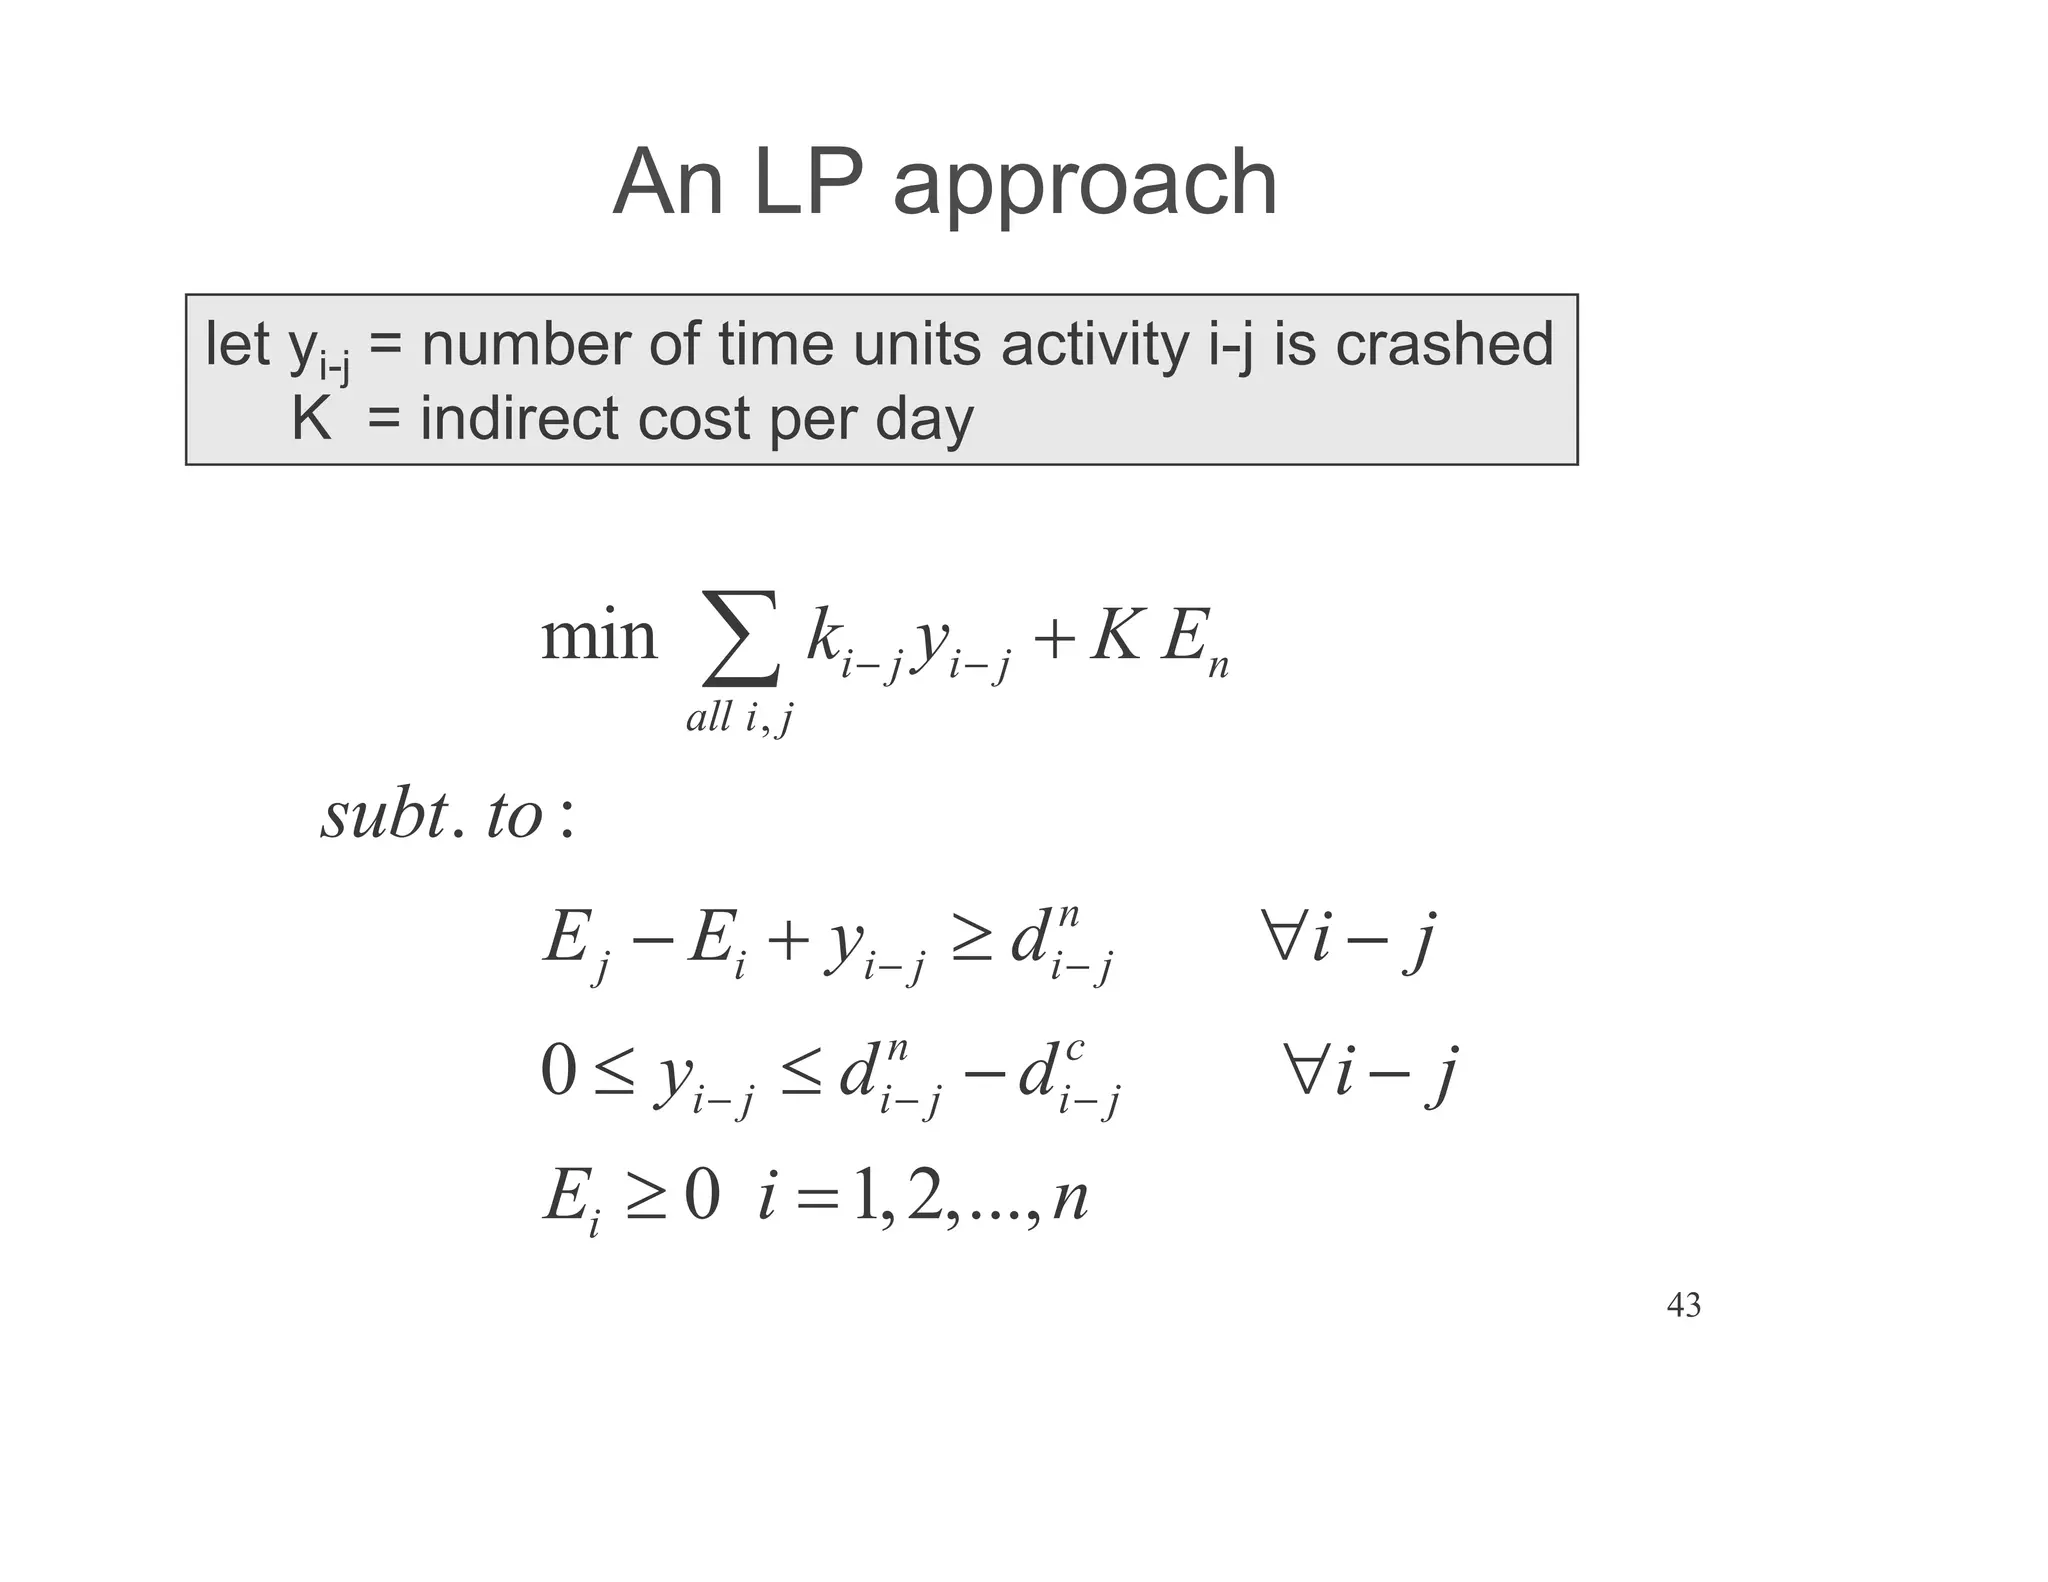
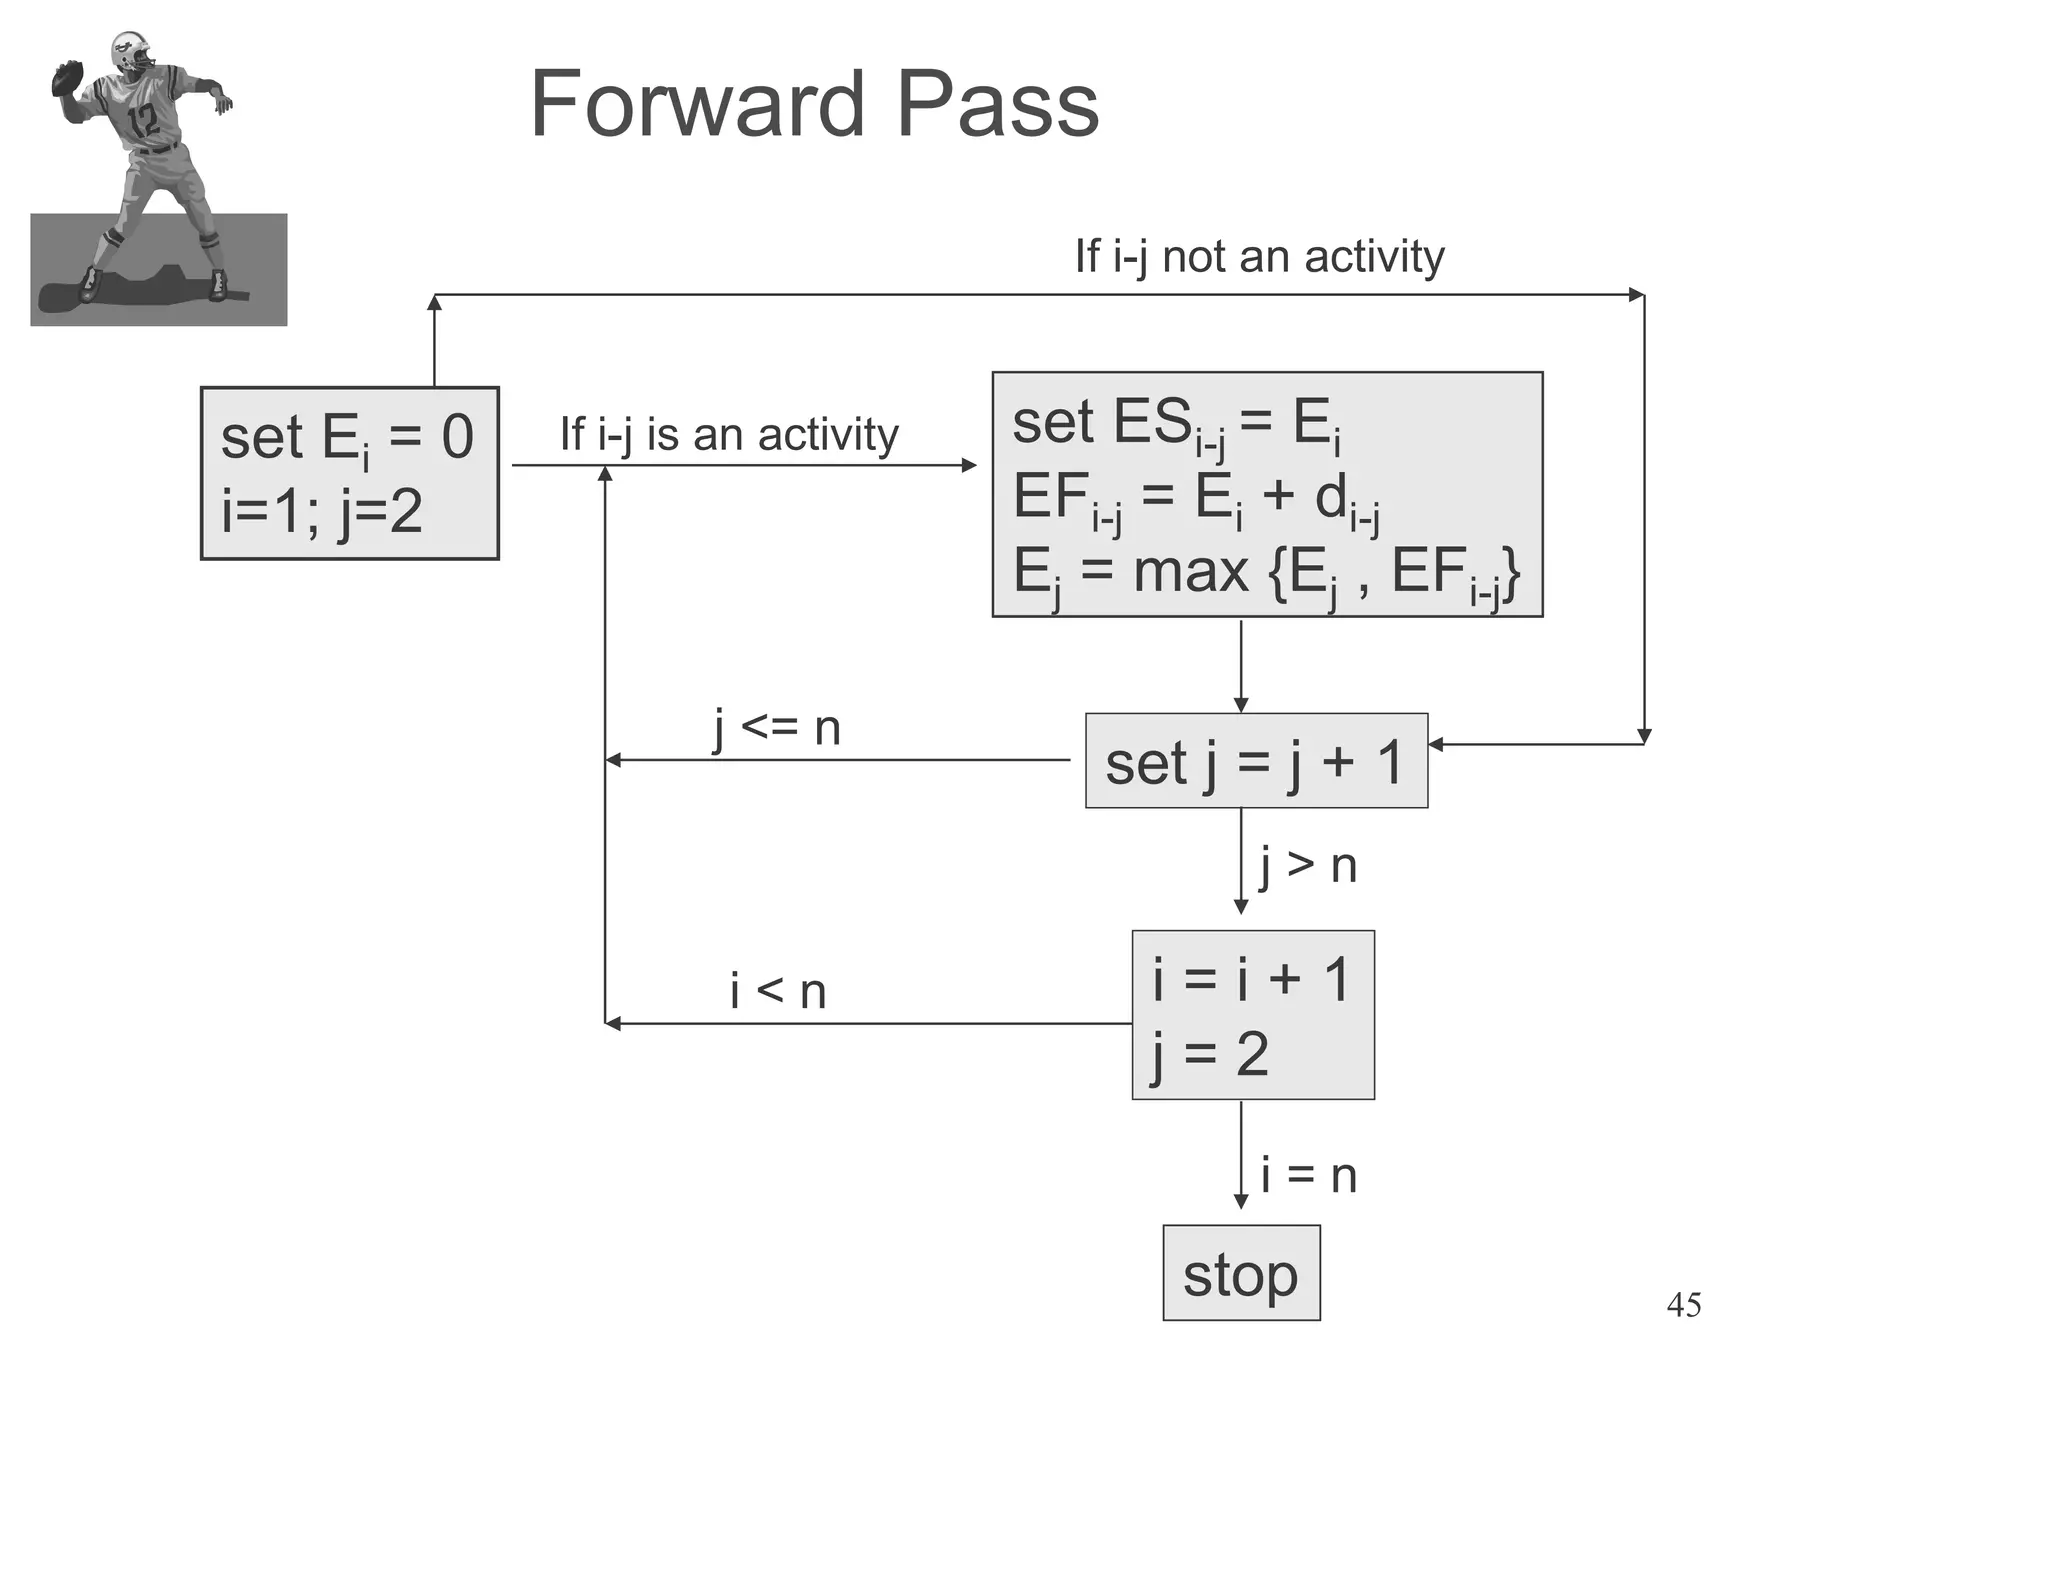
Geometric method impossible in higher dimensions
• Algebraical methods:
• Simplex method (George B. Dantzig 1949):
skim through the feasible solution polytope.
Similar to a "Gaussian elimination".
Very good in practice, but can take an
exponential time
Introduction 1
Network is a technique used for planning and scheduling of large projects in the fields of construction, maintenance, fabrication, purchasing, computer system instantiation, research and development planning etc. There is multitude of operations research situations that can be modeled and solved as network. Some recent surveys reports that as much as 70% of the real-world mathematical programming problems can be represented by network related models. Network analysis is known by many names _PERT (Programme Evaluation and Review Technique), CPM (Critical Path Method), PEP (Programme Evaluation Procedure), LCES (Least Cost Estimating and Scheduling), SCANS (Scheduling and Control by Automated Network System), etc
This chapter will present three of algorithms.
1. PERT & CPM
2. Shortest- route algorithms
3. Maximum-flow algorithms
A project consists of interconnected activities that are to be executed in a certain order before the entire task is completed. The activities are interrelated in a logical sequence which is known as precedence relationship. The project is represented in the form of a network for analytical treatment to get a solution for scheduling and controlling activities.
In this project, To schedule the activities, we have applied the "CPM " and "PERT" method.
My presentation slides for a technical dinner presentation I delivered for the PMI\'s Arabian Gulf Chapter in Al-Khobar, KSA, on June 21, 2010.
Yousef Abugosh, PMP
1LocationFixed CostsVariable Costs per unitA=BB=CC=DA$85,000260006.docxdrennanmicah
1LocationFixed CostsVariable Costs per unitA=BB=CC=DA$85,000260006666.66666666677500B$55,0007C$35,00010D$65,0006average weekly demand50unitsstandard deviation 8units95%1.645Safety Stock 13unitsTherefore Target inventory level= lead time demand + safety stockLead time2WeeksLead time demand100Target inventory level=113
2Activity a=Optimistic Time Estimate(weeks)m=Most likely Time Estimates (weeks)b=Pessimistic Time Estimates(weeks)Immediate predecessor(s)T€=(a+4m+b)/6Var=((b-a)/6)^2Std.devA369none611B357A50.44444444440.6666666667C4712A7.33333333331.77777777781.3333333333D4810B7.666666666711E51016C10.16666666673.36111111111.8333333333F345D,E40.11111111110.3333333333G369D.E611H5610F6.50.69444444440.8333333333I5811G811J333H,I300ABDFHJ32.17ABDGIJ35.67ACEFHJ37.00ACEGIJ40.50CriticalStd.dev6.17probability of completing the project in 44 weeks44Z0.57probability0.71
3Forecast Ft (given a)Abs. ErrorSquare Error2-period moving averageAbs. ErrorSquare ErrorActuals (At)0.2exponential smoothing a= 0.2a= 0.2115172416.51.52.2521816.601.41.96162431416.882.888.2944151141616.300.3040.09241614.51.52.2551316.243.243210.5183462414.51.52.2561615.590.405440.1643815936160010.2325.037.5011.75exponential smoothing a= 0.22-period moving averageMSE4.17161.9583MAD1.70541.2500
Project Management
(Chapter 16)
Production & Operations Management
INFO 335-71
Week 4
Learning Objectives
Describe project management objectives
Describe the project life cycle
Diagram networks of project activities
Estimate the completion time of a project
Compute the probability of completing a project
by a specific time
Determine how to reduce the length of a project
effectively
Describe the critical chain approach to proje.
Sachpazis:Terzaghi Bearing Capacity Estimation in simple terms with Calculati...Dr.Costas Sachpazis
Terzaghi's soil bearing capacity theory, developed by Karl Terzaghi, is a fundamental principle in geotechnical engineering used to determine the bearing capacity of shallow foundations. This theory provides a method to calculate the ultimate bearing capacity of soil, which is the maximum load per unit area that the soil can support without undergoing shear failure. The Calculation HTML Code included.
More Related Content
Similar to Lecture - Project, Planning and Control.pdf
Introduction 1
Network is a technique used for planning and scheduling of large projects in the fields of construction, maintenance, fabrication, purchasing, computer system instantiation, research and development planning etc. There is multitude of operations research situations that can be modeled and solved as network. Some recent surveys reports that as much as 70% of the real-world mathematical programming problems can be represented by network related models. Network analysis is known by many names _PERT (Programme Evaluation and Review Technique), CPM (Critical Path Method), PEP (Programme Evaluation Procedure), LCES (Least Cost Estimating and Scheduling), SCANS (Scheduling and Control by Automated Network System), etc
This chapter will present three of algorithms.
1. PERT & CPM
2. Shortest- route algorithms
3. Maximum-flow algorithms
A project consists of interconnected activities that are to be executed in a certain order before the entire task is completed. The activities are interrelated in a logical sequence which is known as precedence relationship. The project is represented in the form of a network for analytical treatment to get a solution for scheduling and controlling activities.
In this project, To schedule the activities, we have applied the "CPM " and "PERT" method.
My presentation slides for a technical dinner presentation I delivered for the PMI\'s Arabian Gulf Chapter in Al-Khobar, KSA, on June 21, 2010.
Yousef Abugosh, PMP
1LocationFixed CostsVariable Costs per unitA=BB=CC=DA$85,000260006.docxdrennanmicah
1LocationFixed CostsVariable Costs per unitA=BB=CC=DA$85,000260006666.66666666677500B$55,0007C$35,00010D$65,0006average weekly demand50unitsstandard deviation 8units95%1.645Safety Stock 13unitsTherefore Target inventory level= lead time demand + safety stockLead time2WeeksLead time demand100Target inventory level=113
2Activity a=Optimistic Time Estimate(weeks)m=Most likely Time Estimates (weeks)b=Pessimistic Time Estimates(weeks)Immediate predecessor(s)T€=(a+4m+b)/6Var=((b-a)/6)^2Std.devA369none611B357A50.44444444440.6666666667C4712A7.33333333331.77777777781.3333333333D4810B7.666666666711E51016C10.16666666673.36111111111.8333333333F345D,E40.11111111110.3333333333G369D.E611H5610F6.50.69444444440.8333333333I5811G811J333H,I300ABDFHJ32.17ABDGIJ35.67ACEFHJ37.00ACEGIJ40.50CriticalStd.dev6.17probability of completing the project in 44 weeks44Z0.57probability0.71
3Forecast Ft (given a)Abs. ErrorSquare Error2-period moving averageAbs. ErrorSquare ErrorActuals (At)0.2exponential smoothing a= 0.2a= 0.2115172416.51.52.2521816.601.41.96162431416.882.888.2944151141616.300.3040.09241614.51.52.2551316.243.243210.5183462414.51.52.2561615.590.405440.1643815936160010.2325.037.5011.75exponential smoothing a= 0.22-period moving averageMSE4.17161.9583MAD1.70541.2500
1LocationFixed CostsVariable Costs per unitA=BB=CC=DA$85,000260006666.66666666677500B$55,0007C$35,00010D$65,0006average weekly demand50unitsstandard deviation 8units95%1.645Safety Stock 13unitsTherefore Target inventory level= lead time demand + safety stockLead time2WeeksLead time demand100Target inventory level=113
2Activity a=Optimistic Time Estimate(weeks)m=Most likely Time Estimates (weeks)b=Pessimistic Time Estimates(weeks)Immediate predecessor(s)T€=(a+4m+b)/6Var=((b-a)/6)^2Std.devA369none611B357A50.44444444440.6666666667C4712A7.33333333331.77777777781.3333333333D4810B7.666666666711E51016C10.16666666673.36111111111.8333333333F345D,E40.11111111110.3333333333G369D.E611H5610F6.50.69444444440.8333333333I5811G811J333H,I300ABDFHJ32.17ABDGIJ35.67ACEFHJ37.00ACEGIJ40.50CriticalStd.dev6.17probability of completing the project in 44 weeks44Z0.57probability0.71
3Forecast Ft (given a)Abs. ErrorSquare Error2-period moving averageAbs. ErrorSquare ErrorActuals (At)0.2exponential smoothing a= 0.2a= 0.2115172416.51.52.2521816.601.41.96162431416.882.888.2944151141616.300.3040.09241614.51.52.2551316.243.243210.5183462414.51.52.2561615.590.405440.1643815936160010.2325.037.5011.75exponential smoothing a= 0.22-period moving averageMSE4.17161.9583MAD1.70541.2500
Project Management
(Chapter 16)
Production & Operations Management
INFO 335-71
Week 4
Learning Objectives
Describe project management objectives
Describe the project life cycle
Diagram networks of project activities
Estimate the completion time of a project
Compute the probability of completing a project
by a specific time
Determine how to reduce the length of a project
effectively
Describe the critical chain approach to proje.
Sachpazis:Terzaghi Bearing Capacity Estimation in simple terms with Calculati...Dr.Costas Sachpazis
Terzaghi's soil bearing capacity theory, developed by Karl Terzaghi, is a fundamental principle in geotechnical engineering used to determine the bearing capacity of shallow foundations. This theory provides a method to calculate the ultimate bearing capacity of soil, which is the maximum load per unit area that the soil can support without undergoing shear failure. The Calculation HTML Code included.
Cosmetic shop management system project report.pdfKamal Acharya
Buying new cosmetic products is difficult. It can even be scary for those who have sensitive skin and are prone to skin trouble. The information needed to alleviate this problem is on the back of each product, but it's thought to interpret those ingredient lists unless you have a background in chemistry.
Instead of buying and hoping for the best, we can use data science to help us predict which products may be good fits for us. It includes various function programs to do the above mentioned tasks.
Data file handling has been effectively used in the program.
The automated cosmetic shop management system should deal with the automation of general workflow and administration process of the shop. The main processes of the system focus on customer's request where the system is able to search the most appropriate products and deliver it to the customers. It should help the employees to quickly identify the list of cosmetic product that have reached the minimum quantity and also keep a track of expired date for each cosmetic product. It should help the employees to find the rack number in which the product is placed.It is also Faster and more efficient way.
Industrial Training at Shahjalal Fertilizer Company Limited (SFCL)MdTanvirMahtab2
This presentation is about the working procedure of Shahjalal Fertilizer Company Limited (SFCL). A Govt. owned Company of Bangladesh Chemical Industries Corporation under Ministry of Industries.
NO1 Uk best vashikaran specialist in delhi vashikaran baba near me online vas...Amil Baba Dawood bangali
Contact with Dawood Bhai Just call on +92322-6382012 and we'll help you. We'll solve all your problems within 12 to 24 hours and with 101% guarantee and with astrology systematic. If you want to take any personal or professional advice then also you can call us on +92322-6382012 , ONLINE LOVE PROBLEM & Other all types of Daily Life Problem's.Then CALL or WHATSAPP us on +92322-6382012 and Get all these problems solutions here by Amil Baba DAWOOD BANGALI
#vashikaranspecialist #astrologer #palmistry #amliyaat #taweez #manpasandshadi #horoscope #spiritual #lovelife #lovespell #marriagespell#aamilbabainpakistan #amilbabainkarachi #powerfullblackmagicspell #kalajadumantarspecialist #realamilbaba #AmilbabainPakistan #astrologerincanada #astrologerindubai #lovespellsmaster #kalajaduspecialist #lovespellsthatwork #aamilbabainlahore#blackmagicformarriage #aamilbaba #kalajadu #kalailam #taweez #wazifaexpert #jadumantar #vashikaranspecialist #astrologer #palmistry #amliyaat #taweez #manpasandshadi #horoscope #spiritual #lovelife #lovespell #marriagespell#aamilbabainpakistan #amilbabainkarachi #powerfullblackmagicspell #kalajadumantarspecialist #realamilbaba #AmilbabainPakistan #astrologerincanada #astrologerindubai #lovespellsmaster #kalajaduspecialist #lovespellsthatwork #aamilbabainlahore #blackmagicforlove #blackmagicformarriage #aamilbaba #kalajadu #kalailam #taweez #wazifaexpert #jadumantar #vashikaranspecialist #astrologer #palmistry #amliyaat #taweez #manpasandshadi #horoscope #spiritual #lovelife #lovespell #marriagespell#aamilbabainpakistan #amilbabainkarachi #powerfullblackmagicspell #kalajadumantarspecialist #realamilbaba #AmilbabainPakistan #astrologerincanada #astrologerindubai #lovespellsmaster #kalajaduspecialist #lovespellsthatwork #aamilbabainlahore #Amilbabainuk #amilbabainspain #amilbabaindubai #Amilbabainnorway #amilbabainkrachi #amilbabainlahore #amilbabaingujranwalan #amilbabainislamabad
Water scarcity is the lack of fresh water resources to meet the standard water demand. There are two type of water scarcity. One is physical. The other is economic water scarcity.
Hybrid optimization of pumped hydro system and solar- Engr. Abdul-Azeez.pdffxintegritypublishin
Advancements in technology unveil a myriad of electrical and electronic breakthroughs geared towards efficiently harnessing limited resources to meet human energy demands. The optimization of hybrid solar PV panels and pumped hydro energy supply systems plays a pivotal role in utilizing natural resources effectively. This initiative not only benefits humanity but also fosters environmental sustainability. The study investigated the design optimization of these hybrid systems, focusing on understanding solar radiation patterns, identifying geographical influences on solar radiation, formulating a mathematical model for system optimization, and determining the optimal configuration of PV panels and pumped hydro storage. Through a comparative analysis approach and eight weeks of data collection, the study addressed key research questions related to solar radiation patterns and optimal system design. The findings highlighted regions with heightened solar radiation levels, showcasing substantial potential for power generation and emphasizing the system's efficiency. Optimizing system design significantly boosted power generation, promoted renewable energy utilization, and enhanced energy storage capacity. The study underscored the benefits of optimizing hybrid solar PV panels and pumped hydro energy supply systems for sustainable energy usage. Optimizing the design of solar PV panels and pumped hydro energy supply systems as examined across diverse climatic conditions in a developing country, not only enhances power generation but also improves the integration of renewable energy sources and boosts energy storage capacities, particularly beneficial for less economically prosperous regions. Additionally, the study provides valuable insights for advancing energy research in economically viable areas. Recommendations included conducting site-specific assessments, utilizing advanced modeling tools, implementing regular maintenance protocols, and enhancing communication among system components.
Overview of the fundamental roles in Hydropower generation and the components involved in wider Electrical Engineering.
This paper presents the design and construction of hydroelectric dams from the hydrologist’s survey of the valley before construction, all aspects and involved disciplines, fluid dynamics, structural engineering, generation and mains frequency regulation to the very transmission of power through the network in the United Kingdom.
Author: Robbie Edward Sayers
Collaborators and co editors: Charlie Sims and Connor Healey.
(C) 2024 Robbie E. Sayers
Immunizing Image Classifiers Against Localized Adversary Attacksgerogepatton
This paper addresses the vulnerability of deep learning models, particularly convolutional neural networks
(CNN)s, to adversarial attacks and presents a proactive training technique designed to counter them. We
introduce a novel volumization algorithm, which transforms 2D images into 3D volumetric representations.
When combined with 3D convolution and deep curriculum learning optimization (CLO), itsignificantly improves
the immunity of models against localized universal attacks by up to 40%. We evaluate our proposed approach
using contemporary CNN architectures and the modified Canadian Institute for Advanced Research (CIFAR-10
and CIFAR-100) and ImageNet Large Scale Visual Recognition Challenge (ILSVRC12) datasets, showcasing
accuracy improvements over previous techniques. The results indicate that the combination of the volumetric
input and curriculum learning holds significant promise for mitigating adversarial attacks without necessitating
adversary training.
Student information management system project report ii.pdfKamal Acharya
Our project explains about the student management. This project mainly explains the various actions related to student details. This project shows some ease in adding, editing and deleting the student details. It also provides a less time consuming process for viewing, adding, editing and deleting the marks of the students.
Student information management system project report ii.pdf
Lecture - Project, Planning and Control.pdf
1. UNIT 4
System Schedule
ME 342 A
System Design and Analysis
Dr. Kailash Chaudhary
Ph.D. (Mechanical Design), M.E. (P & I), B.E. (Mechanical Engg)
Assistant Professor
Department of Mechanical Engineering
MBM University Jodhpur
2. 2
Project Planning, Scheduling and Control
Project a set of partially ordered,
interrelated activities that must be
completed to achieve a goal.
3. 3
Network Models
PERT Program Evaluation and Review
Technique
probabilistic features
CPM Critical Path Method
cost/time trade-offs
project scheduler
4. 4
Objectives
Planning, scheduling, and control of complex
projects
Find critical activities to manage resources
(management by exception)
Determine flexibility of non-critical activities
(slack)
Estimate earliest completion time of project
Determine time cost trade-offs
6. 6
Production Systems
Job shops
Flow shops
Batch production
Mass production
Cellular manufacturing
Project Shop
Continuous Processing
Gosh. Can you
tell us more
about these?
7. 7
Project Shop
single product in fixed location
material and labor brought to the site
usually job shop/flow shop associated
functionalized production system
examples include construction and
shipbuilding
8. 8
The Elements of Project Scheduling
Project Definition. Statement of project, goals, and
resources required.
Activity Definitions. Content and requirements of
each activity.
Project Scheduling. Specification of starting and
ending times of all activities.
Project Monitoring. Keeping track of the progress of
the project.
9. 9
Definitions
Activity an effort (task) that requires resources and
takes a certain amount of time.
Event a specific accomplishment or milestone (the
start or finish of an activity).
Project a collection of activities and events leading
to a definable goal.
Network a graphical representation of a project
depicting the precedence relationships among the
activities and events.
Critical Activity an activity that if delayed will hold
up the scheduled completion of a project.
Critical Path the sequence of critical activities that
forms a continuous path from the start of a project to
its completion.
10. 10
Framework for Analysis
Analyze project in terms of activities and
events
Determine sequence (precedence) of
activities (develop network)
Assign estimates of time, cost, and resources
to all activities
Identify the critical path
monitor, evaluate, and control progress of
project
11. 11
Network Representation
Projects may be represented as networks with:
Arrows representing activities.
Nodes representing completion of a set of activities
(milestones).
Pseudo activities may be required to satisfy
precedence relationships.
12. 12
Network Development
1 2 3
events
(nodes)
activities
(arcs)
Activities have duration
and may have precedence.
Define activities in terms of
their beginning and ending events.
e.g. Activity 1-2 must precede Activity 2-3
18. 18
Dummy activity
A C
A D
B D
W R O N G
7
5
6
9
10
A
B
C
D
7
5
6
9
10
A
B D
C
8
dummy has no resources and no duration
19. 19
Project Networks
Collection of nodes and arcs
Depicted graphically
Events are uniquely numbered
Arcs are labeled according to their beginning and
ending events
Ending events always have higher numbers than beginning
events
Two activities cannot have the same beginning and
ending events
Activity lengths have no significance
20. 20
Our Very Own Example
product development
activity description precedence
A design promotion campaign -
B initial pricing -
C product design -
D promotion cost analysis A
E manufacture prototype C
F test and redesign E
G final pricing B,D,F
H market test G
22. 22
Notation
i-j = an activity of a project
di-j = the duration of activity i-j
Ei = the earliest time event i can occur
ESi-j = the earliest start time of activity i-j
EFi-j = the earliest finish time of activity i-j
LSi-j = the latest start time of activity i-j
LFi-j = the latest finish time of activity i-j
Li = the latest time event i can occur
23. 23
Our Very Own Example
product development
activity precedence duration (days)
A (1-2) - 17
B (1-5) - 7
C (1-3) - 33
D (2-5) A 6
E (3-4) C 40
F (4-5) E 7
G (5-6) B,D,F 12
H (6-7) G 48
27. 27
Critical Path Method
An analytical tool that provides a schedule that
completes the project in minimum time subject to the
precedence constraints. In addition, CPM provides:
Starting and ending times for each activity
Identification of the critical activities (i.e., the ones
whose delay necessarily delay the project).
Identification of the non-critical activities, and the
amount of slack time available when scheduling
these activities.
30. 30
Critical Path by LP
1
Min
. :
, pairs
n
n
i
j i ij
E
subj to
E E d i j
earliest start times
1
1
Min
. :
, pairs
n
n i
i
j i ij
nL L
subj to
L L d i j
latest start times
32. 32
More Activity Durations
let a = optimistic time
b = pessimistic time
m = most likely time
2
2
2 12
a b b a
2 2 2
2
3 18
a m b a b m ab am bm
2
2
4
6 18
a m b b a
uniform:
triangular:
beta:
33. 33
activity durations
product development
activity a m b
A (1-2) 6 18 24 17 9 3
B (1-5) 6 6 12 7 1 1
C (1-3) 24 30 54 33 25 5
D (2-5) 6 6 6 6 0 0
E (3-4) 24 36 72 40 64 8
F (4-5) 6 6 12 7 1 1
G (5-6) 6 12 18 12 4 2
H (6-7) 36 48 60 48 16 4
2
beta
note: based upon a 6 day workweek
34. 34
critical path analysis
product development
activity a m b
C (1-3) 24 30 54 33 25 5
E (3-4) 24 36 72 40 64 8
F (4-5) 6 6 12 7 1 1
G (5-6) 6 12 18 12 4 2
H (6-7) 36 48 60 48 16 4
sum 140 110
2
beta
From the Central Limit Theorem, project completion
time is normally distributed with a mean of 140 days
and a standard deviation of = 10.5 days.
110
35. 35
Probability Statements
Probability project will be completed by day 150 is
given by:
150 140
Pr 150 Pr Pr .95 .829
10.5
T
T z
Probability project will be completed after day 130
is given by:
130 140
Pr 130 Pr Pr .95 .171
10.5
T
T z
37. 37
Resource Profile early start schedule
0 10 20 30 40 50 60 70 80
30
25
20
15
10
5
1-2
1-5
1-3
3-4
2-5
4-5 5-6
We need too many
people at the start
of the project!
39. 39
Resource Profile late start schedule
0 10 20 30 40 50 60 70 80
30
25
20
15
10
5
1-2
1-5
1-3
3-4
2-5
4-5 5-6
the late start schedule.
Then we can layoff
some folks.
40. 40
Time Costing Methods
Suppose that projects can be expedited by
reducing the time required for critical activities.
Doing so results in an increase in some costs
and a decrease in others. The goal is to
determine the optimal number of days to
schedule the project to minimize total cost.
Assume that there is a linear time/cost
relationship for each activity.
42. 42
Heuristic Crashing
c n
i j i j
i j n c
i j i j
c c
k
d d
= $ / day
time cost
activity normal crash normal crash k
C (1-3) 33 25 10 20 1.25
E (3-4) 40 31 22 35 1.44
F (4-5) 7 5 8 12 2.0
G (5-6) 12 9 17 30 4.33
H (6-7) 48 40 30 48 2.25
43. 43
An LP approach
let yi-j = number of time units activity i-j is crashed
K = indirect cost per day
,
min
. :
0
0 1,2,...,
i j i j n
all i j
n
j i i j i j
n c
i j i j i j
i
k y K E
subt to
E E y d i j
y d d i j
E i n
45. 45
Forward Pass
set Ei = 0
i=1; j=2
set ESi-j = Ei
EFi-j = Ei + di-j
Ej = max {Ej , EFi-j}
If i-j is an activity
set j = j + 1
j <= n
i = i + 1
j = 2
j > n
i < n
stop
i = n
If i-j not an activity
46. 46
Backward Pass
set Li = En
i=1; j=n
set LFi-j = Li
LSi-j = Li - di-j
Lj = min {Lj , LFi-j}
If i-j is an activity
set i = i + 1
i < n
j = j - 1
i = 1
i = n
j > 0
stop
j = 0
If i-j not an activity