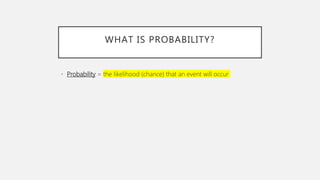
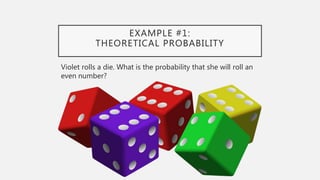
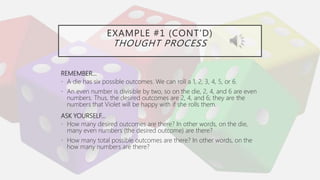
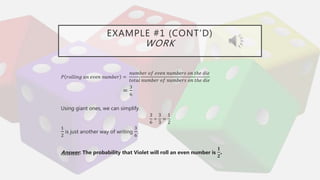
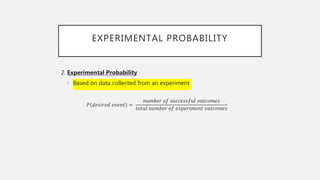
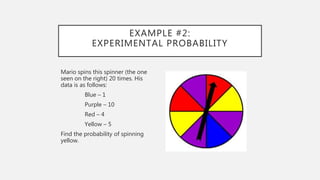
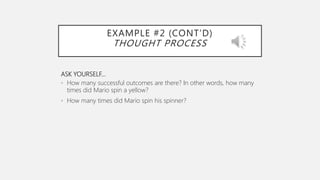
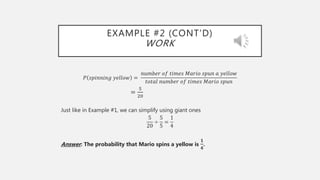
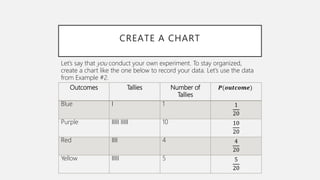
EXPERIMENTAL
AND
THEORETICAL PROBABILITY
Essential Question: How can theoretical probabilities be
used to predict experimental probabilities?
WHAT IS PROBABILITY?
• Probability = the likelihood (chance) that an event will occur
THEORETICAL PROBABILITY
• Probability can be calculated. There are two types of calculated probabilities:
1. Theoretical Probability
• Probability based on known information
• Calculated on the possible outcomes, when they are equally likely
• Outcomes = the possible results of an event
• Ex.: When you flip a coin, the possible outcomes are heads and tails.
𝑃 𝑑𝑒𝑠𝑖𝑟𝑒𝑑 𝑒𝑣𝑒𝑛𝑡 =
𝑛𝑢𝑚𝑏𝑒𝑟 𝑜𝑓 𝑑𝑒𝑠𝑖𝑟𝑒𝑑 𝑝𝑜𝑠𝑠𝑖𝑏𝑖𝑙𝑖𝑡𝑖𝑒𝑠
𝑛𝑢𝑚𝑏𝑒𝑟 𝑜𝑓 𝑡𝑜𝑡𝑎𝑙 𝑝𝑜𝑠𝑠𝑖𝑏𝑖𝑙𝑖𝑡𝑒𝑠
EXAMPLE #1:
THEORETICAL PROBABILITY
Violet rolls a die. What is the probability that she will roll an
even number?
EXAMPLE #1 (CONT’D)
THOUGHT PROCESS
REMEMBER…
• A die has six possible outcomes. We can roll a 1, 2, 3, 4, 5, or 6.
• An even number is divisible by two, so on the die, 2, 4, and 6 are even
numbers. Thus, the desired outcomes are 2, 4, and 6; they are the
numbers that Violet will be happy with if she rolls them.
ASK YOURSELF…
• How many desired outcomes are there? In other words, on the die,
many even numbers (the desired outcome) are there?
• How many total possible outcomes are there? In other words, on the
how many numbers are there?
EXAMPLE #1 (CONT’D)
WORK
𝑃 𝑟𝑜𝑙𝑙𝑖𝑛𝑔 𝑎𝑛 𝑒𝑣𝑒𝑛 𝑛𝑢𝑚𝑏𝑒𝑟 =
𝑛𝑢𝑚𝑏𝑒𝑟 𝑜𝑓 𝑒𝑣𝑒𝑛 𝑛𝑢𝑚𝑏𝑒𝑟𝑠 𝑜𝑛 𝑡ℎ𝑒 𝑑𝑖𝑒
𝑡𝑜𝑡𝑎𝑙 𝑛𝑢𝑚𝑏𝑒𝑟 𝑜𝑓 𝑛𝑢𝑚𝑏𝑒𝑟𝑠 𝑜𝑛 𝑡ℎ𝑒 𝑑𝑖𝑒
=
3
6
Using giant ones, we can simplify.
3
6
÷
3
3
=
1
2
1
2
is just another way of writing
3
6
.
Answer: The probability that Violet will roll an even number is
𝟏
𝟐
.
EXPERIMENTAL PROBABILITY
2. Experimental Probability
• Based on data collected from an experiment
𝑃 𝑑𝑒𝑠𝑖𝑟𝑒𝑑 𝑒𝑣𝑒𝑛𝑡 =
𝑛𝑢𝑚𝑏𝑒𝑟 𝑜𝑓 𝑠𝑢𝑐𝑐𝑒𝑠𝑠𝑓𝑢𝑙 𝑜𝑢𝑡𝑐𝑜𝑚𝑒𝑠
𝑡𝑜𝑡𝑎𝑙 𝑛𝑢𝑚𝑏𝑒𝑟 𝑜𝑓 𝑒𝑥𝑝𝑒𝑟𝑖𝑚𝑒𝑛𝑡 𝑜𝑢𝑡𝑐𝑜𝑚𝑒𝑠
EXAMPLE #2:
EXPERIMENTAL PROBABILITY
Mario spins this spinner (the one
seen on the right) 20 times. His
data is as follows:
Blue – 1
Purple – 10
Red – 4
Yellow – 5
Find the probability of spinning
yellow.
EXAMPLE #2 (CONT’D)
THOUGHT PROCESS
ASK YOURSELF…
• How many successful outcomes are there? In other words, how many
times did Mario spin a yellow?
• How many times did Mario spin his spinner?
EXAMPLE #2 (CONT’D)
WORK
𝑃 𝑠𝑝𝑖𝑛𝑛𝑖𝑛𝑔 𝑦𝑒𝑙𝑙𝑜𝑤 =
𝑛𝑢𝑚𝑏𝑒𝑟 𝑜𝑓 𝑡𝑖𝑚𝑒𝑠 𝑀𝑎𝑟𝑖𝑜 𝑠𝑝𝑢𝑛 𝑎 𝑦𝑒𝑙𝑙𝑜𝑤
𝑡𝑜𝑡𝑎𝑙 𝑛𝑢𝑚𝑏𝑒𝑟 𝑜𝑓 𝑡𝑖𝑚𝑒𝑠 𝑀𝑎𝑟𝑖𝑜 𝑠𝑝𝑢𝑛
=
5
20
Just like in Example #1, we can simplify using giant ones
5
20
÷
5
5
=
1
4
Answer: The probability that Mario spins a yellow is
𝟏
𝟒
.
CREATE A CHART
Outcomes Tallies Number of
Tallies
𝑷(𝒐𝒖𝒕𝒄𝒐𝒎𝒆)
Blue I 1 1
20
Purple IIIII IIIII 10 10
20
Red IIII 4 4
20
Yellow IIIII 5 5
20
Let’s say that you conduct your own experiment. To stay organized,
create a chart like the one below to record your data. Let’s use the data
from Example #2.
HOW CAN PROBABILITIES BE
REPRESENTED?
• Probabilities can be represented as a fraction, decimal, and percent.
• Refer to Example #2:
• The answer is
1
4
.
• 𝐹𝑟𝑎𝑐𝑡𝑖𝑜𝑛 → 𝑃𝑒𝑟𝑐𝑒𝑛𝑡: Remember that percents are ratios out of 100
1
4
×
25
25
=
25
100
𝑜𝑟 25%
• 𝐹𝑟𝑎𝑐𝑡𝑖𝑜𝑛 → 𝐷𝑒𝑐𝑖𝑚𝑎𝑙: Remember that fractions are the same as division
problems
1 ÷ 4 = 0.25
• Answer: The probability that Mario spins a yellow is
𝟏
𝟒
, 𝟐𝟓%, or 𝟎. 𝟐𝟓.

Lecture: Experimental and Theoretical Probability

  • 1.
    EXPERIMENTAL AND THEORETICAL PROBABILITY Essential Question:How can theoretical probabilities be used to predict experimental probabilities?
  • 2.
    WHAT IS PROBABILITY? •Probability = the likelihood (chance) that an event will occur
  • 3.
    THEORETICAL PROBABILITY • Probabilitycan be calculated. There are two types of calculated probabilities: 1. Theoretical Probability • Probability based on known information • Calculated on the possible outcomes, when they are equally likely • Outcomes = the possible results of an event • Ex.: When you flip a coin, the possible outcomes are heads and tails. 𝑃 𝑑𝑒𝑠𝑖𝑟𝑒𝑑 𝑒𝑣𝑒𝑛𝑡 = 𝑛𝑢𝑚𝑏𝑒𝑟 𝑜𝑓 𝑑𝑒𝑠𝑖𝑟𝑒𝑑 𝑝𝑜𝑠𝑠𝑖𝑏𝑖𝑙𝑖𝑡𝑖𝑒𝑠 𝑛𝑢𝑚𝑏𝑒𝑟 𝑜𝑓 𝑡𝑜𝑡𝑎𝑙 𝑝𝑜𝑠𝑠𝑖𝑏𝑖𝑙𝑖𝑡𝑒𝑠
  • 4.
    EXAMPLE #1: THEORETICAL PROBABILITY Violetrolls a die. What is the probability that she will roll an even number?
  • 5.
    EXAMPLE #1 (CONT’D) THOUGHTPROCESS REMEMBER… • A die has six possible outcomes. We can roll a 1, 2, 3, 4, 5, or 6. • An even number is divisible by two, so on the die, 2, 4, and 6 are even numbers. Thus, the desired outcomes are 2, 4, and 6; they are the numbers that Violet will be happy with if she rolls them. ASK YOURSELF… • How many desired outcomes are there? In other words, on the die, many even numbers (the desired outcome) are there? • How many total possible outcomes are there? In other words, on the how many numbers are there?
  • 6.
    EXAMPLE #1 (CONT’D) WORK 𝑃𝑟𝑜𝑙𝑙𝑖𝑛𝑔 𝑎𝑛 𝑒𝑣𝑒𝑛 𝑛𝑢𝑚𝑏𝑒𝑟 = 𝑛𝑢𝑚𝑏𝑒𝑟 𝑜𝑓 𝑒𝑣𝑒𝑛 𝑛𝑢𝑚𝑏𝑒𝑟𝑠 𝑜𝑛 𝑡ℎ𝑒 𝑑𝑖𝑒 𝑡𝑜𝑡𝑎𝑙 𝑛𝑢𝑚𝑏𝑒𝑟 𝑜𝑓 𝑛𝑢𝑚𝑏𝑒𝑟𝑠 𝑜𝑛 𝑡ℎ𝑒 𝑑𝑖𝑒 = 3 6 Using giant ones, we can simplify. 3 6 ÷ 3 3 = 1 2 1 2 is just another way of writing 3 6 . Answer: The probability that Violet will roll an even number is 𝟏 𝟐 .
  • 7.
    EXPERIMENTAL PROBABILITY 2. ExperimentalProbability • Based on data collected from an experiment 𝑃 𝑑𝑒𝑠𝑖𝑟𝑒𝑑 𝑒𝑣𝑒𝑛𝑡 = 𝑛𝑢𝑚𝑏𝑒𝑟 𝑜𝑓 𝑠𝑢𝑐𝑐𝑒𝑠𝑠𝑓𝑢𝑙 𝑜𝑢𝑡𝑐𝑜𝑚𝑒𝑠 𝑡𝑜𝑡𝑎𝑙 𝑛𝑢𝑚𝑏𝑒𝑟 𝑜𝑓 𝑒𝑥𝑝𝑒𝑟𝑖𝑚𝑒𝑛𝑡 𝑜𝑢𝑡𝑐𝑜𝑚𝑒𝑠
  • 8.
    EXAMPLE #2: EXPERIMENTAL PROBABILITY Mariospins this spinner (the one seen on the right) 20 times. His data is as follows: Blue – 1 Purple – 10 Red – 4 Yellow – 5 Find the probability of spinning yellow.
  • 9.
    EXAMPLE #2 (CONT’D) THOUGHTPROCESS ASK YOURSELF… • How many successful outcomes are there? In other words, how many times did Mario spin a yellow? • How many times did Mario spin his spinner?
  • 10.
    EXAMPLE #2 (CONT’D) WORK 𝑃𝑠𝑝𝑖𝑛𝑛𝑖𝑛𝑔 𝑦𝑒𝑙𝑙𝑜𝑤 = 𝑛𝑢𝑚𝑏𝑒𝑟 𝑜𝑓 𝑡𝑖𝑚𝑒𝑠 𝑀𝑎𝑟𝑖𝑜 𝑠𝑝𝑢𝑛 𝑎 𝑦𝑒𝑙𝑙𝑜𝑤 𝑡𝑜𝑡𝑎𝑙 𝑛𝑢𝑚𝑏𝑒𝑟 𝑜𝑓 𝑡𝑖𝑚𝑒𝑠 𝑀𝑎𝑟𝑖𝑜 𝑠𝑝𝑢𝑛 = 5 20 Just like in Example #1, we can simplify using giant ones 5 20 ÷ 5 5 = 1 4 Answer: The probability that Mario spins a yellow is 𝟏 𝟒 .
  • 11.
    CREATE A CHART OutcomesTallies Number of Tallies 𝑷(𝒐𝒖𝒕𝒄𝒐𝒎𝒆) Blue I 1 1 20 Purple IIIII IIIII 10 10 20 Red IIII 4 4 20 Yellow IIIII 5 5 20 Let’s say that you conduct your own experiment. To stay organized, create a chart like the one below to record your data. Let’s use the data from Example #2.
  • 12.
    HOW CAN PROBABILITIESBE REPRESENTED? • Probabilities can be represented as a fraction, decimal, and percent. • Refer to Example #2: • The answer is 1 4 . • 𝐹𝑟𝑎𝑐𝑡𝑖𝑜𝑛 → 𝑃𝑒𝑟𝑐𝑒𝑛𝑡: Remember that percents are ratios out of 100 1 4 × 25 25 = 25 100 𝑜𝑟 25% • 𝐹𝑟𝑎𝑐𝑡𝑖𝑜𝑛 → 𝐷𝑒𝑐𝑖𝑚𝑎𝑙: Remember that fractions are the same as division problems 1 ÷ 4 = 0.25 • Answer: The probability that Mario spins a yellow is 𝟏 𝟒 , 𝟐𝟓%, or 𝟎. 𝟐𝟓.