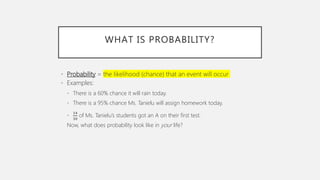
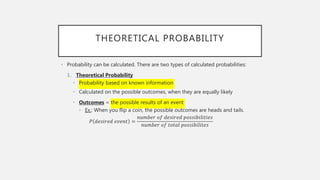
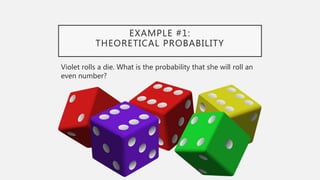
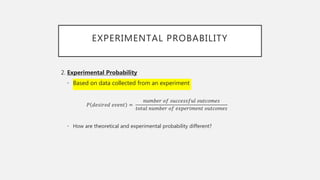
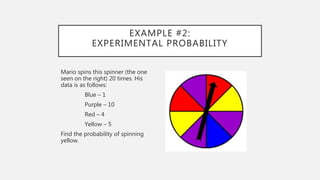
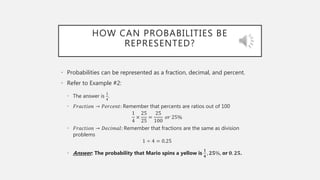
2. WHAT IS PROBABILITY?
• Probability = the likelihood (chance) that an event will occur
• Examples:
• There is a 60% chance it will rain today.
• There is a 95% chance Ms. Tanielu will assign homework today.
•
14
30
of Ms. Tanielu’s students got an A on their first test.
Now, what does probability look like in your life?
3. THEORETICAL PROBABILITY
• Probability can be calculated. There are two types of calculated probabilities:
1. Theoretical Probability
• Probability based on known information
• Calculated on the possible outcomes, when they are equally likely
• Outcomes = the possible results of an event
• Ex.: When you flip a coin, the possible outcomes are heads and tails.
𝑃 𝑑𝑒𝑠𝑖𝑟𝑒𝑑 𝑒𝑣𝑒𝑛𝑡 =
𝑛𝑢𝑚𝑏𝑒𝑟 𝑜𝑓 𝑑𝑒𝑠𝑖𝑟𝑒𝑑 𝑝𝑜𝑠𝑠𝑖𝑏𝑖𝑙𝑖𝑡𝑖𝑒𝑠
𝑛𝑢𝑚𝑏𝑒𝑟 𝑜𝑓 𝑡𝑜𝑡𝑎𝑙 𝑝𝑜𝑠𝑠𝑖𝑏𝑖𝑙𝑖𝑡𝑒𝑠
5. EXAMPLE #1 (CONT’D)
THOUGHT PROCESS
REMEMBER…
• A die has six possible outcomes. We can roll a 1, 2, 3, 4, 5, or 6.
• An even number is divisible by two, so on the die, 2, 4, and 6 are even
numbers. Thus, the desired outcomes are 2, 4, and 6; they are the
numbers that Violet will be happy with if she rolls them.
ASK YOURSELF…
• How many desired outcomes are there? In other words, on the die,
many even numbers (the desired outcome) are there?
• How many total possible outcomes are there? In other words, on the
how many numbers are there?
6. EXAMPLE #1 (CONT’D)
WORK
𝑃 𝑟𝑜𝑙𝑙𝑖𝑛𝑔 𝑎𝑛 𝑒𝑣𝑒𝑛 𝑛𝑢𝑚𝑏𝑒𝑟 =
𝑛𝑢𝑚𝑏𝑒𝑟 𝑜𝑓 𝑒𝑣𝑒𝑛 𝑛𝑢𝑚𝑏𝑒𝑟𝑠 𝑜𝑛 𝑡ℎ𝑒 𝑑𝑖𝑒
𝑡𝑜𝑡𝑎𝑙 𝑛𝑢𝑚𝑏𝑒𝑟 𝑜𝑓 𝑛𝑢𝑚𝑏𝑒𝑟𝑠 𝑜𝑛 𝑡ℎ𝑒 𝑑𝑖𝑒
=
3
6
Using giant ones, we can simplify.
3
6
÷
3
3
=
1
2
1
2
is just another way of writing
3
6
.
Answer: The probability that Violet will roll an even number is
𝟏
𝟐
.
7. EXPERIMENTAL PROBABILITY
2. Experimental Probability
• Based on data collected from an experiment
𝑃 𝑑𝑒𝑠𝑖𝑟𝑒𝑑 𝑒𝑣𝑒𝑛𝑡 =
𝑛𝑢𝑚𝑏𝑒𝑟 𝑜𝑓 𝑠𝑢𝑐𝑐𝑒𝑠𝑠𝑓𝑢𝑙 𝑜𝑢𝑡𝑐𝑜𝑚𝑒𝑠
𝑡𝑜𝑡𝑎𝑙 𝑛𝑢𝑚𝑏𝑒𝑟 𝑜𝑓 𝑒𝑥𝑝𝑒𝑟𝑖𝑚𝑒𝑛𝑡 𝑜𝑢𝑡𝑐𝑜𝑚𝑒𝑠
• How are theoretical and experimental probability different?
8. EXAMPLE #2:
EXPERIMENTAL PROBABILITY
Mario spins this spinner (the one
seen on the right) 20 times. His
data is as follows:
Blue – 1
Purple – 10
Red – 4
Yellow – 5
Find the probability of spinning
yellow.
9. EXAMPLE #2 (CONT’D)
THOUGHT PROCESS
ASK YOURSELF…
• How many successful outcomes are there? In other words, how many
times did Mario spin a yellow?
• How many times did Mario spin his spinner?
10. EXAMPLE #2 (CONT’D)
WORK
𝑃 𝑠𝑝𝑖𝑛𝑛𝑖𝑛𝑔 𝑦𝑒𝑙𝑙𝑜𝑤 =
𝑛𝑢𝑚𝑏𝑒𝑟 𝑜𝑓 𝑡𝑖𝑚𝑒𝑠 𝑀𝑎𝑟𝑖𝑜 𝑠𝑝𝑢𝑛 𝑎 𝑦𝑒𝑙𝑙𝑜𝑤
𝑡𝑜𝑡𝑎𝑙 𝑛𝑢𝑚𝑏𝑒𝑟 𝑜𝑓 𝑡𝑖𝑚𝑒𝑠 𝑀𝑎𝑟𝑖𝑜 𝑠𝑝𝑢𝑛
=
5
20
Just like in Example #1, we can simplify using giant ones
5
20
÷
5
5
=
1
4
Answer: The probability that Mario spins a yellow is
𝟏
𝟒
.
11. CREATE A CHART
Outcomes Tallies Number of
Tallies
𝑷(𝒐𝒖𝒕𝒄𝒐𝒎𝒆)
Blue I 1 1
20
Purple IIIII IIIII 10 10
20
Red IIII 4 4
20
Yellow IIIII 5 5
20
Let’s say that you conduct your own experiment. To stay organized,
create a chart like the one below to record your data. Let’s use the data
from Example #2.
12. HOW CAN PROBABILITIES BE
REPRESENTED?
• Probabilities can be represented as a fraction, decimal, and percent.
• Refer to Example #2:
• The answer is
1
4
.
• 𝐹𝑟𝑎𝑐𝑡𝑖𝑜𝑛 → 𝑃𝑒𝑟𝑐𝑒𝑛𝑡: Remember that percents are ratios out of 100
1
4
×
25
25
=
25
100
𝑜𝑟 25%
• 𝐹𝑟𝑎𝑐𝑡𝑖𝑜𝑛 → 𝐷𝑒𝑐𝑖𝑚𝑎𝑙: Remember that fractions are the same as division
problems
1 ÷ 4 = 0.25
• Answer: The probability that Mario spins a yellow is
𝟏
𝟒
, 𝟐𝟓%, or 𝟎. 𝟐𝟓.
13. CHECKING FOR UNDERSTANDING
• What is theoretical probability? What is experimental probability?
Differentiate between theoretical probability and experimental probability.
• Name an example of how probability affects your decision-making.
• In an experimental probability chart, all the probabilities must add up to
what? Do you know why?
• Try creating your own problem with a spinner: use three colors and make
five wedges (pieces). First, find the theoretical probabilities. Then conduct an
experiment by spinning your spinner 20 times and find the experimental
probabilities. How do the theoretical probabilities and the experimental
probabilities compare?