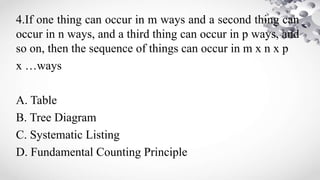
The document outlines various statistical and probability concepts, focusing on different counting techniques such as grid tables, tree diagrams, and systematic listing to analyze outcomes of experiments. It includes activities that require students to apply these techniques to identify sample spaces and probabilities based on given scenarios. The document also emphasizes the importance of these counting methods in organizing and determining possible outcomes effectively.


![Counting Techniques-Systematic Listing
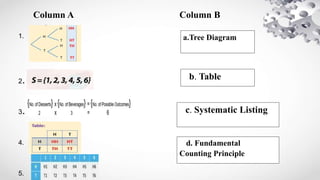
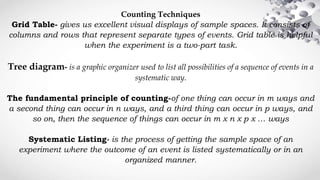
Systematic Listing- is the process of getting the sample space of an experiment
where the outcome of an event is listed systematically or in an organized manner.
Example 1: Consider a Club N with five members:
N= [ Andy, Bill, Cathy, David, Evelyn] or as a shortcut,
N= [ A, B,C,D,E]
In how many ways can this group select a president (assuming all members are
eligible)?
The task in this case is to select one of the five members as president. It is a One-part
task.](https://image.slidesharecdn.com/cheyeneppt-230814180515-ddcbb574/85/cheyene-ppt-pptx-15-320.jpg)