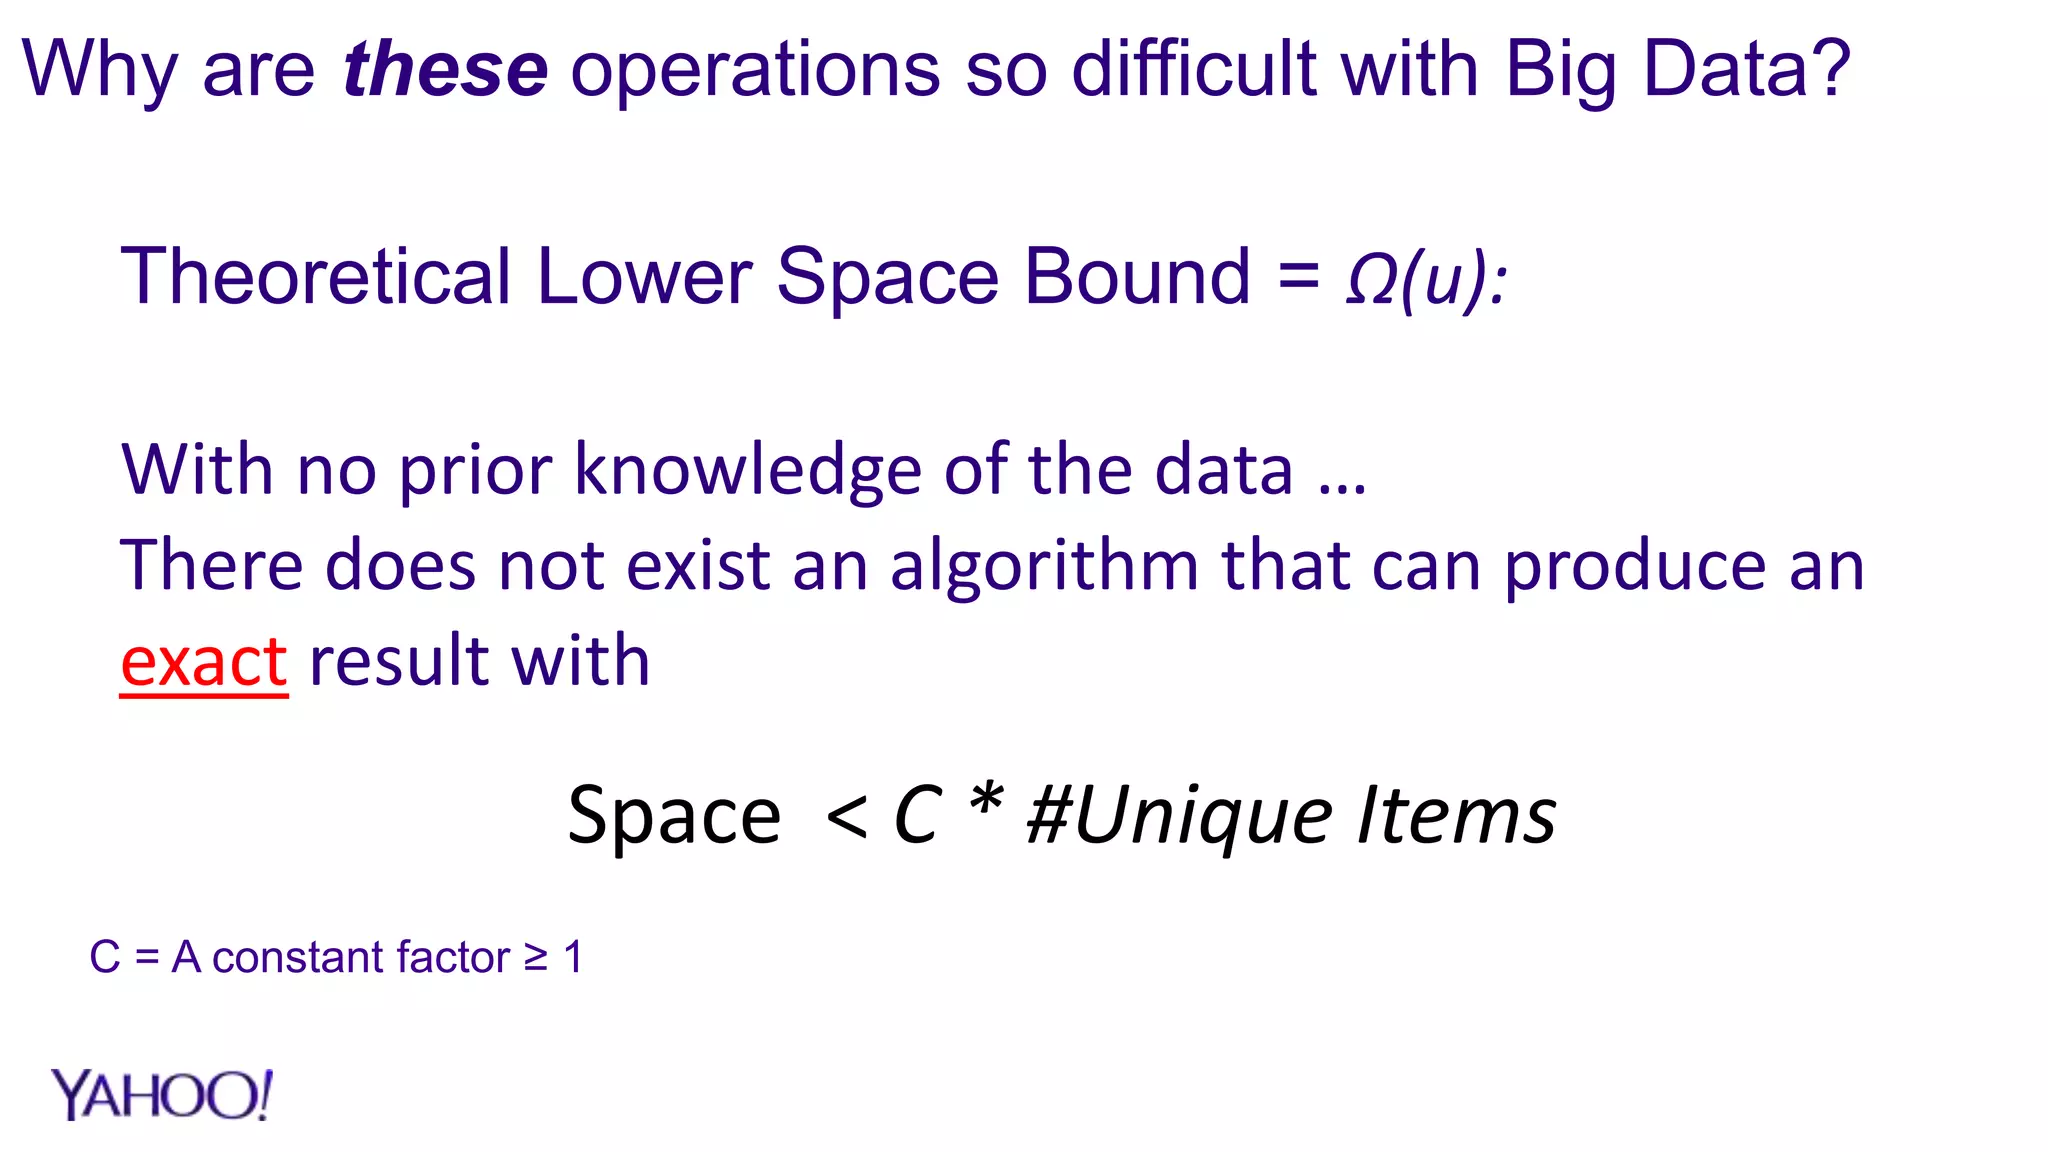
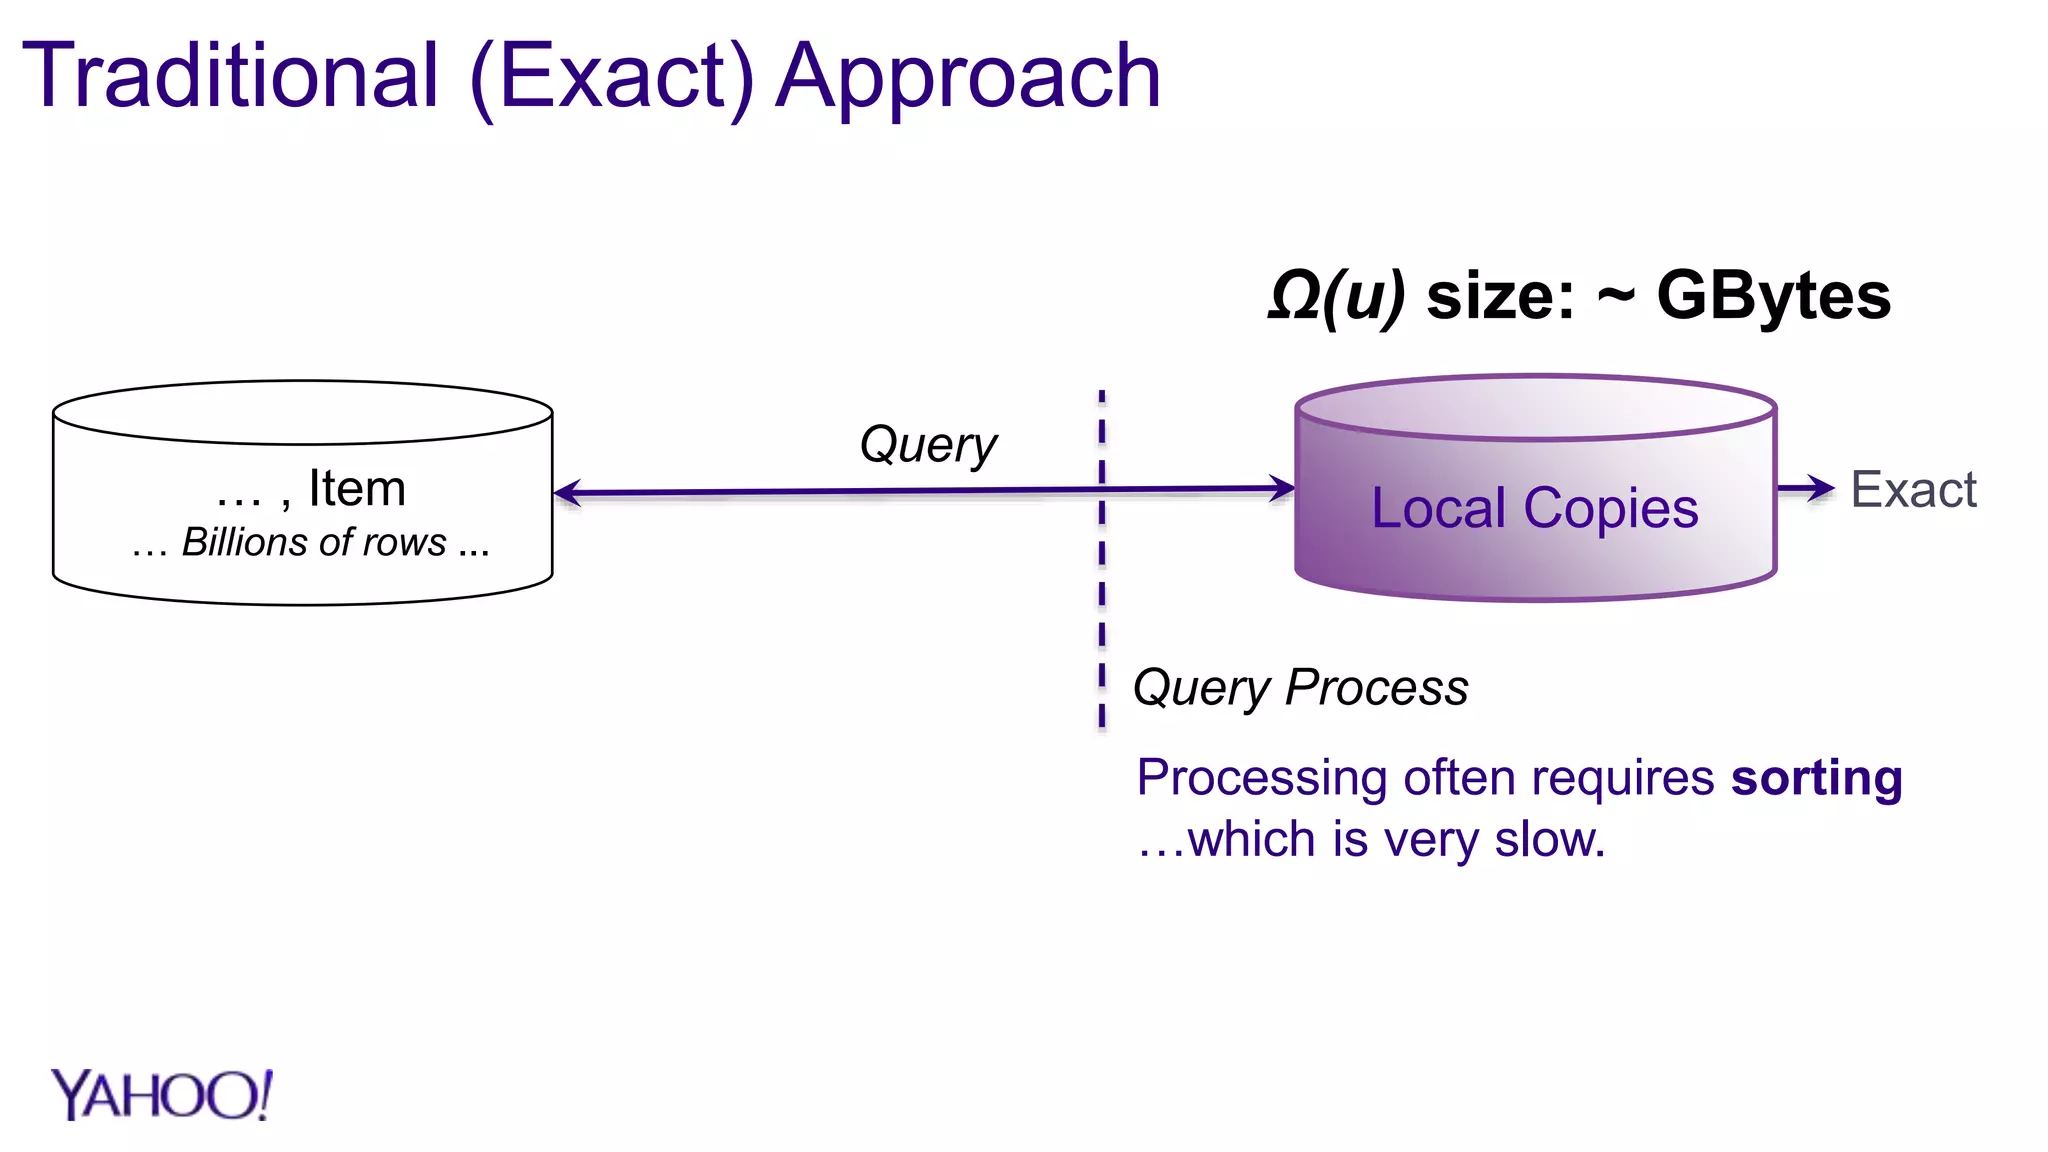
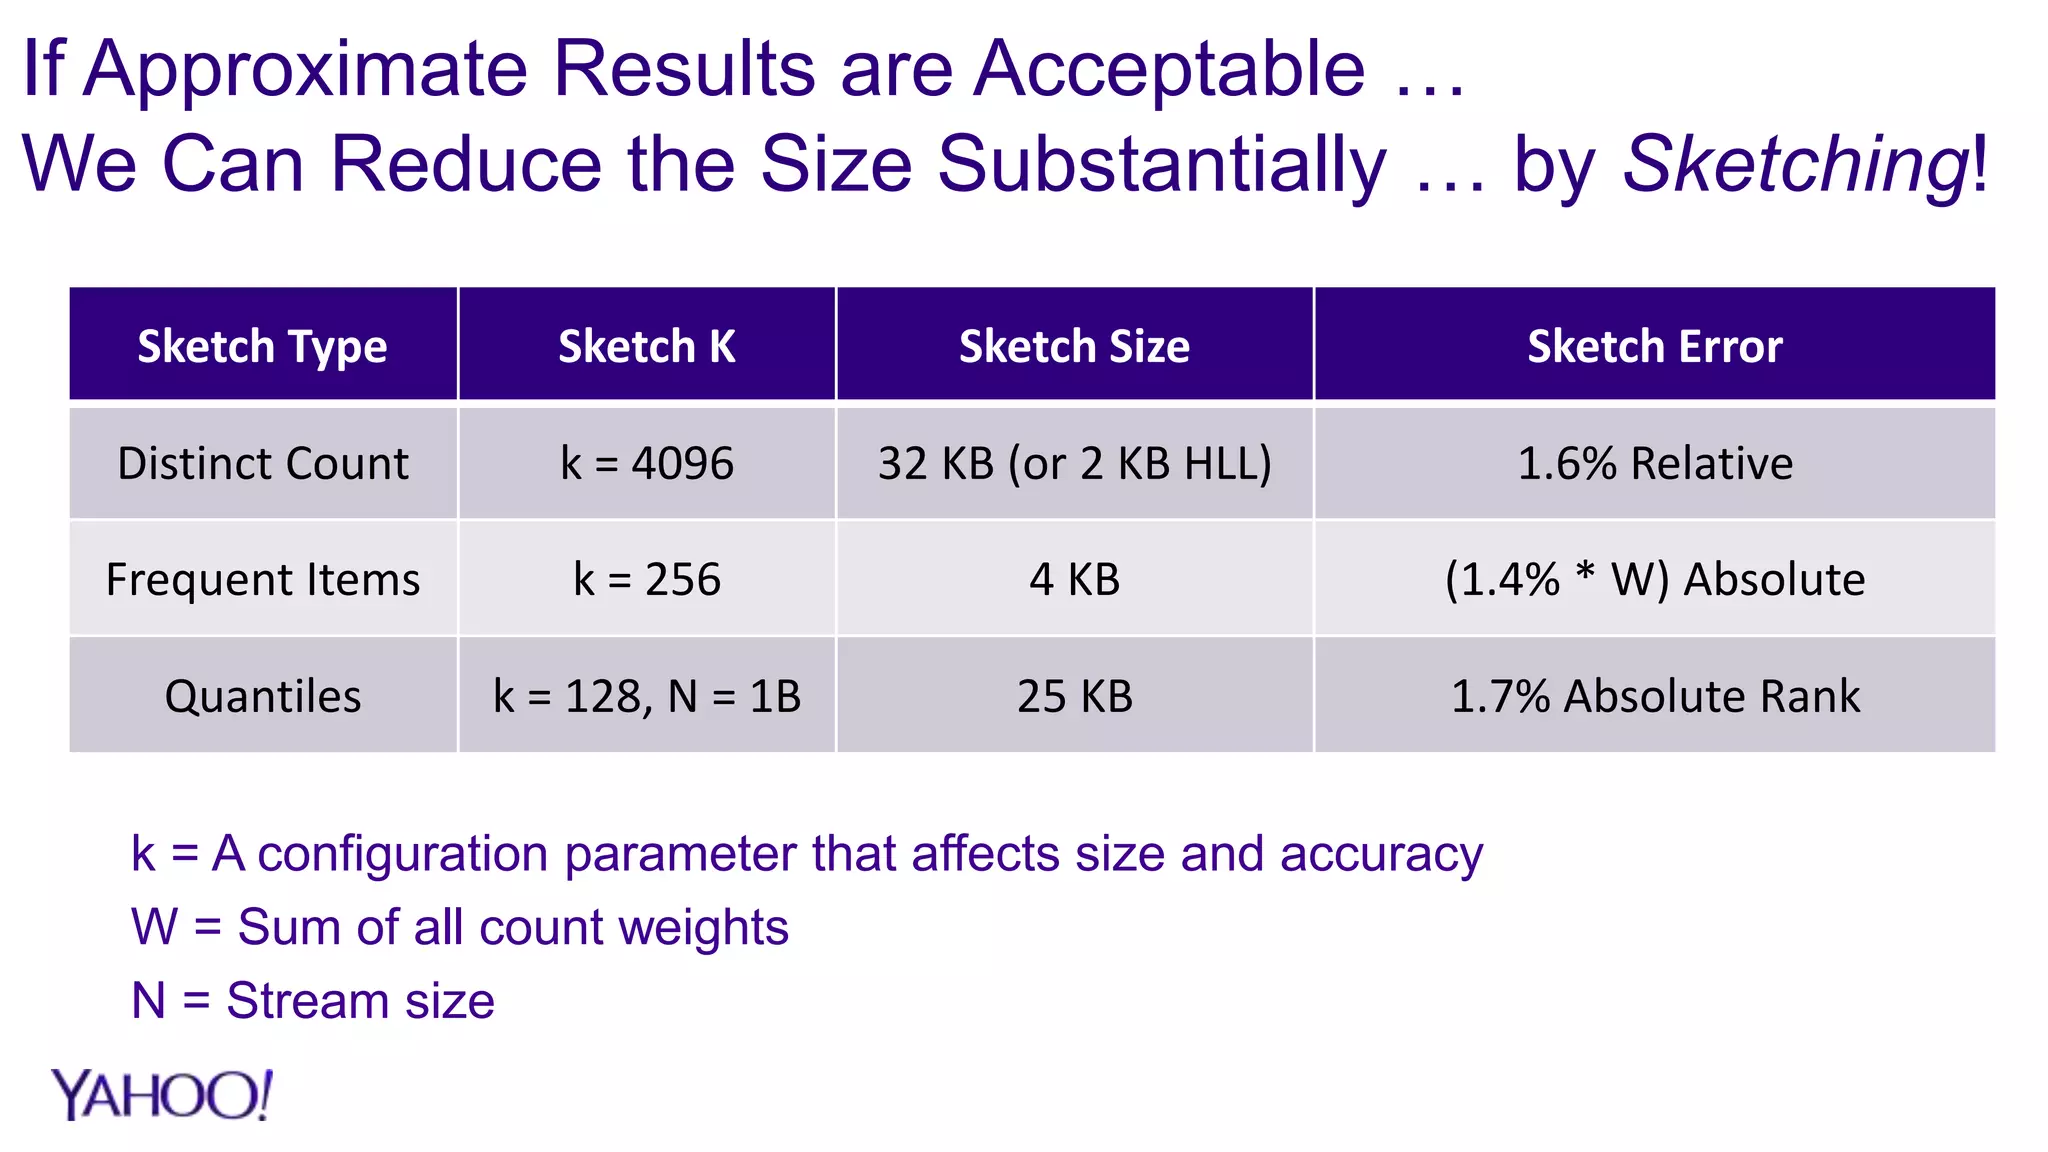
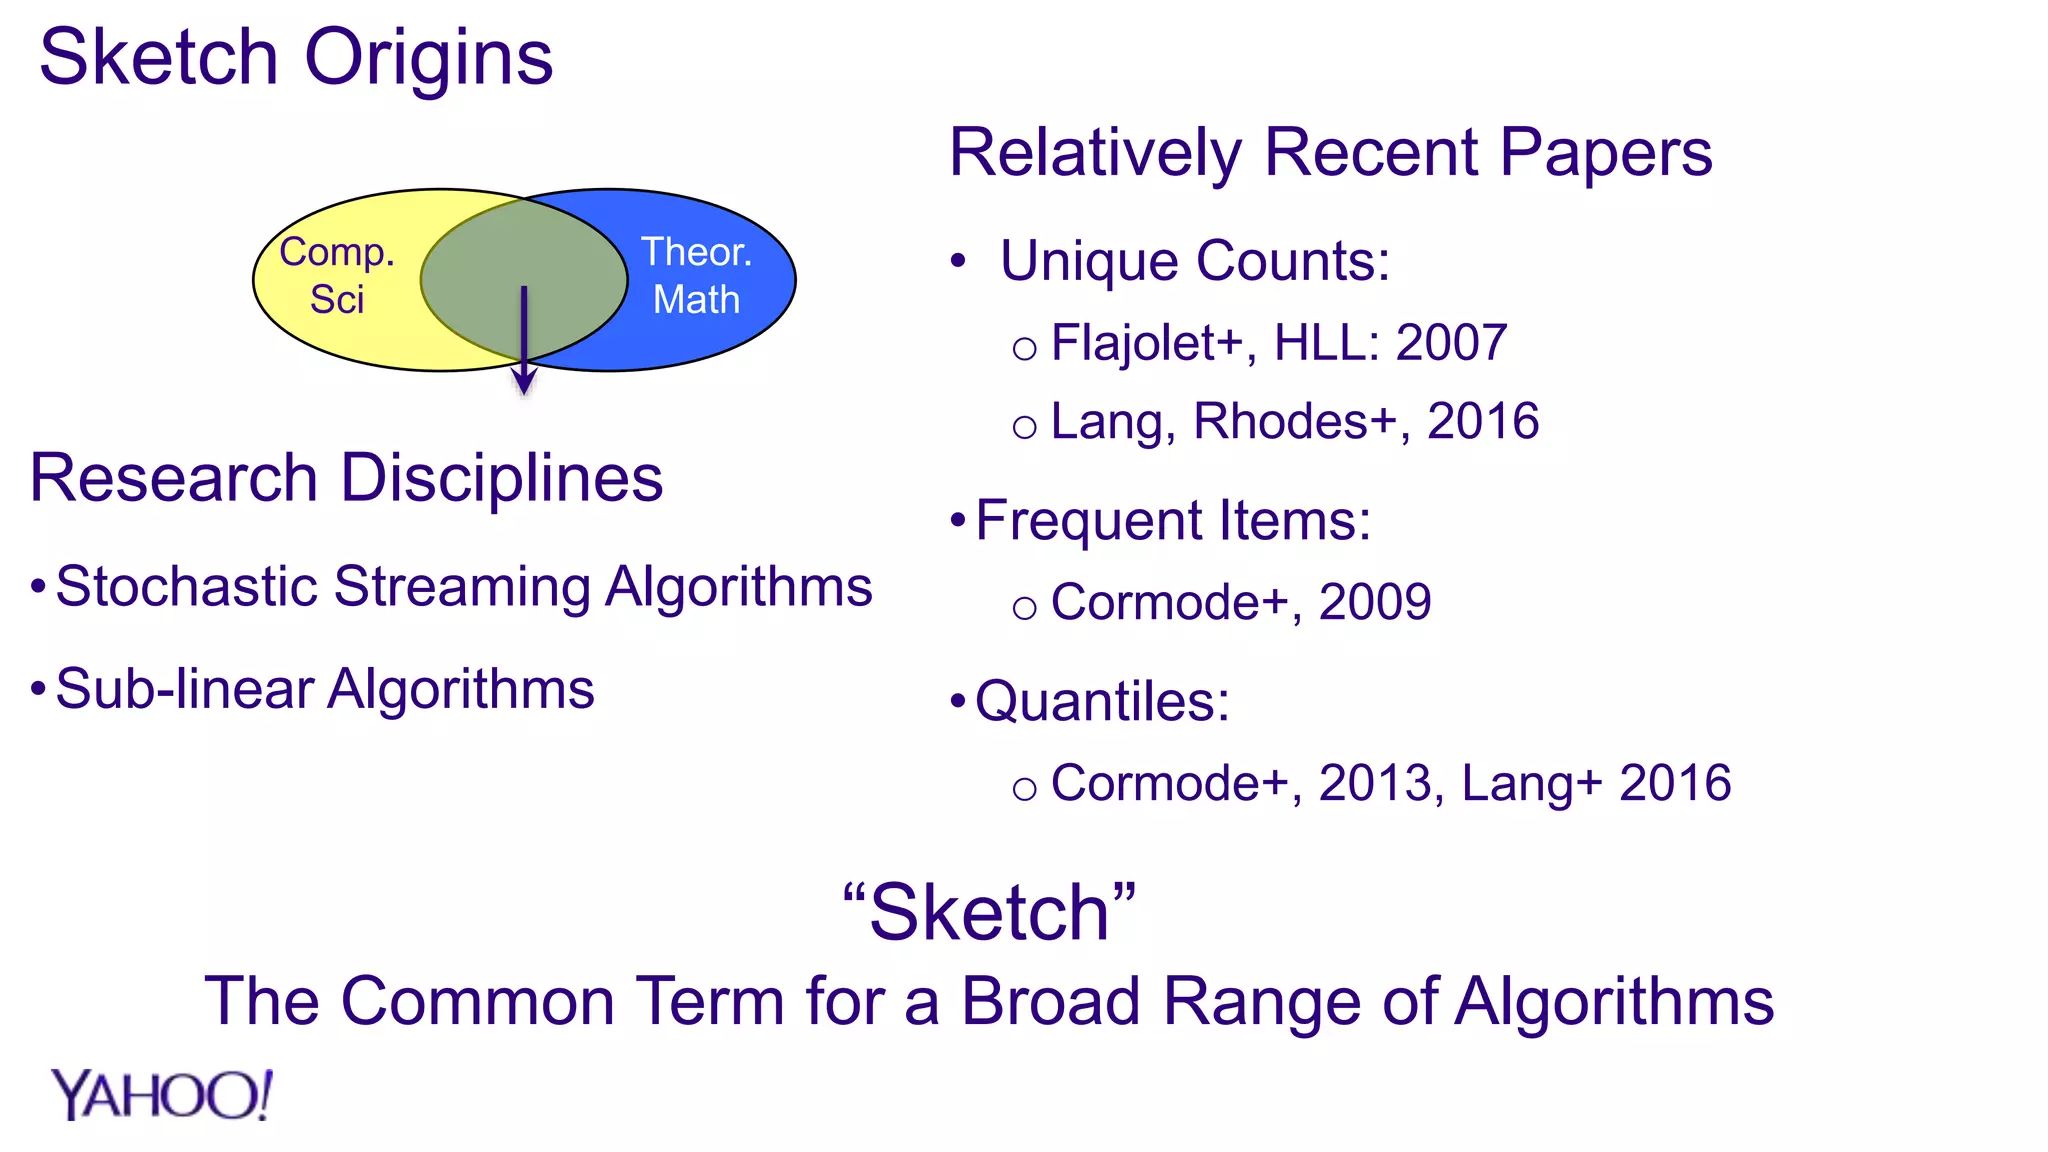
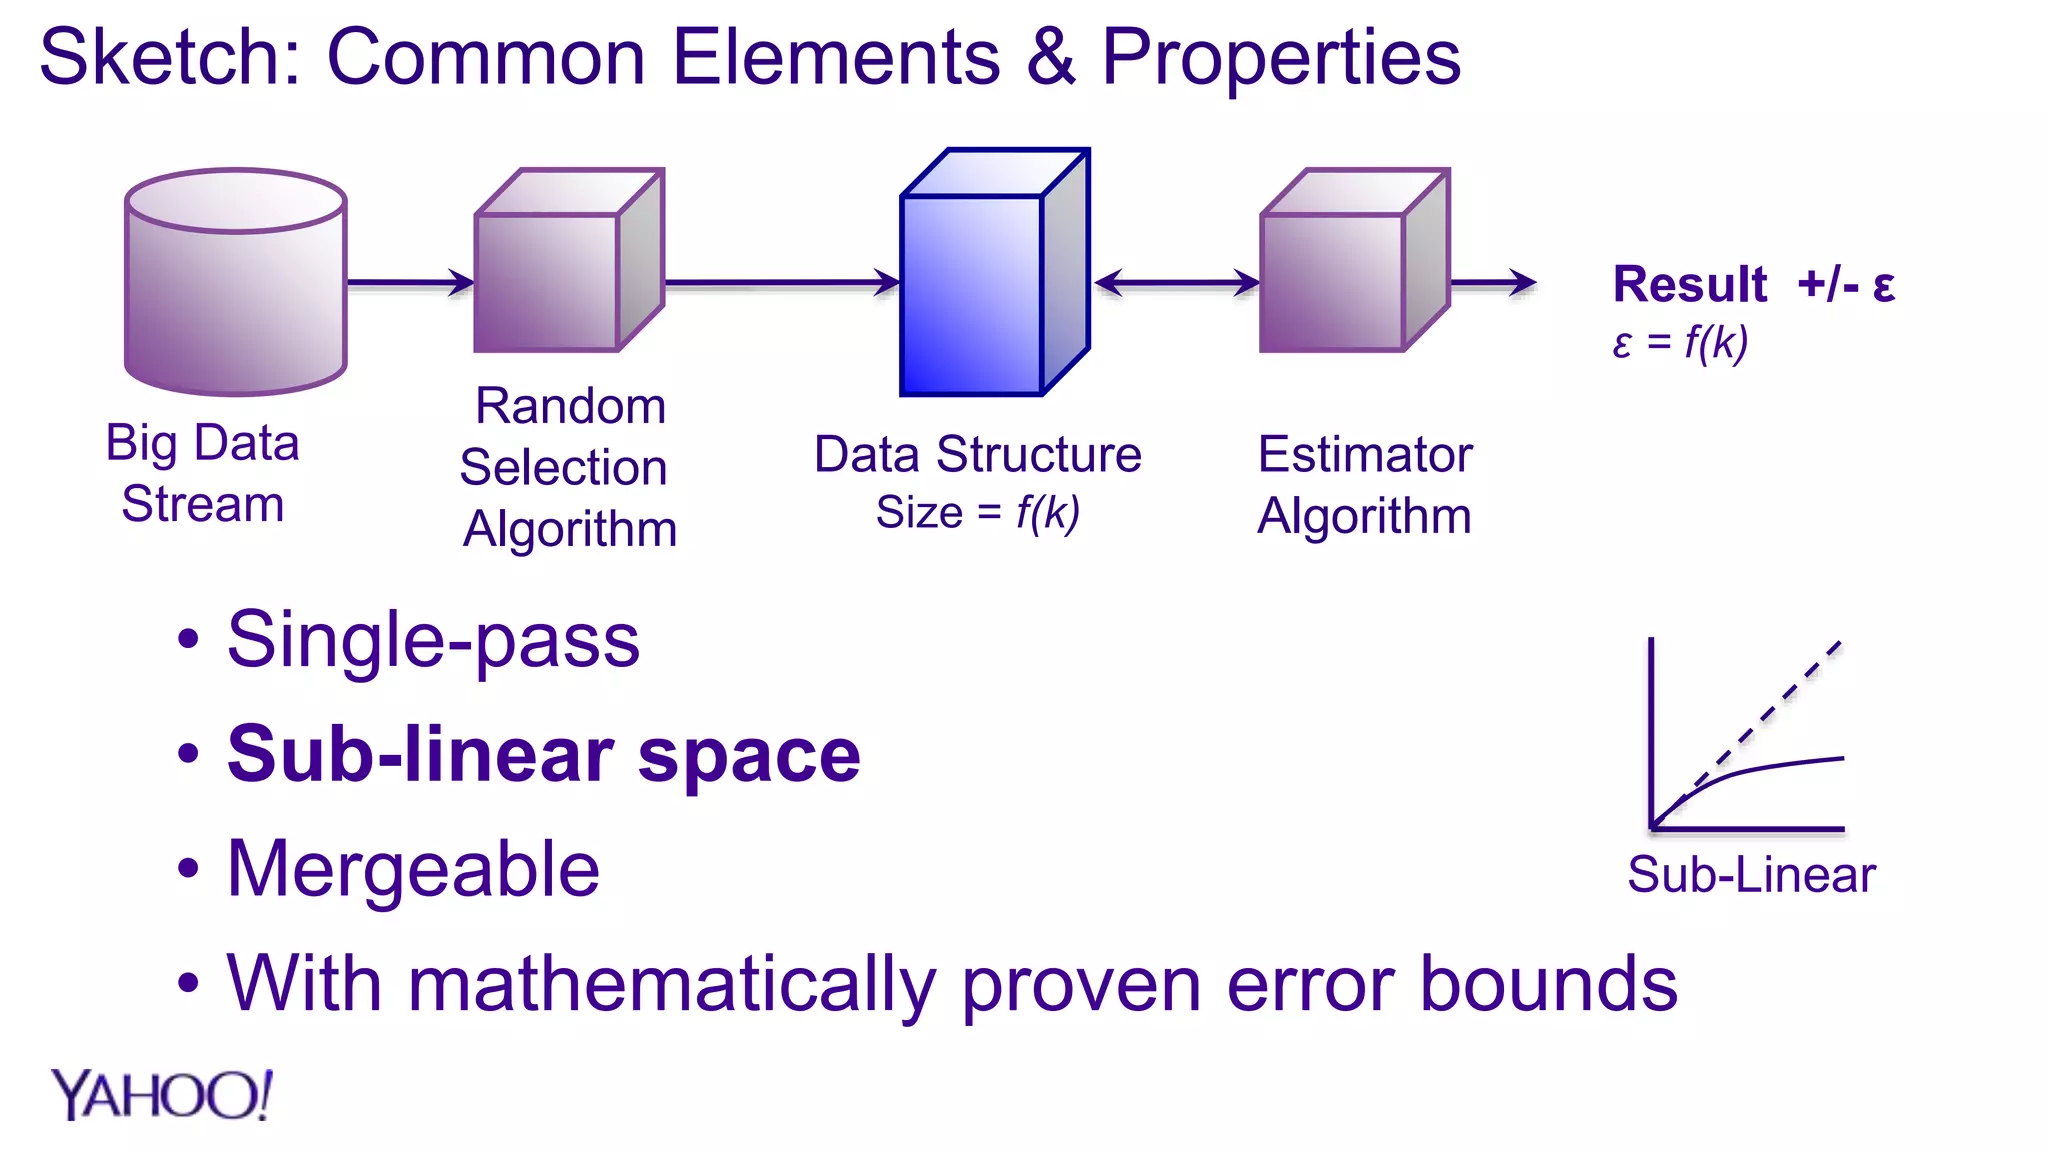
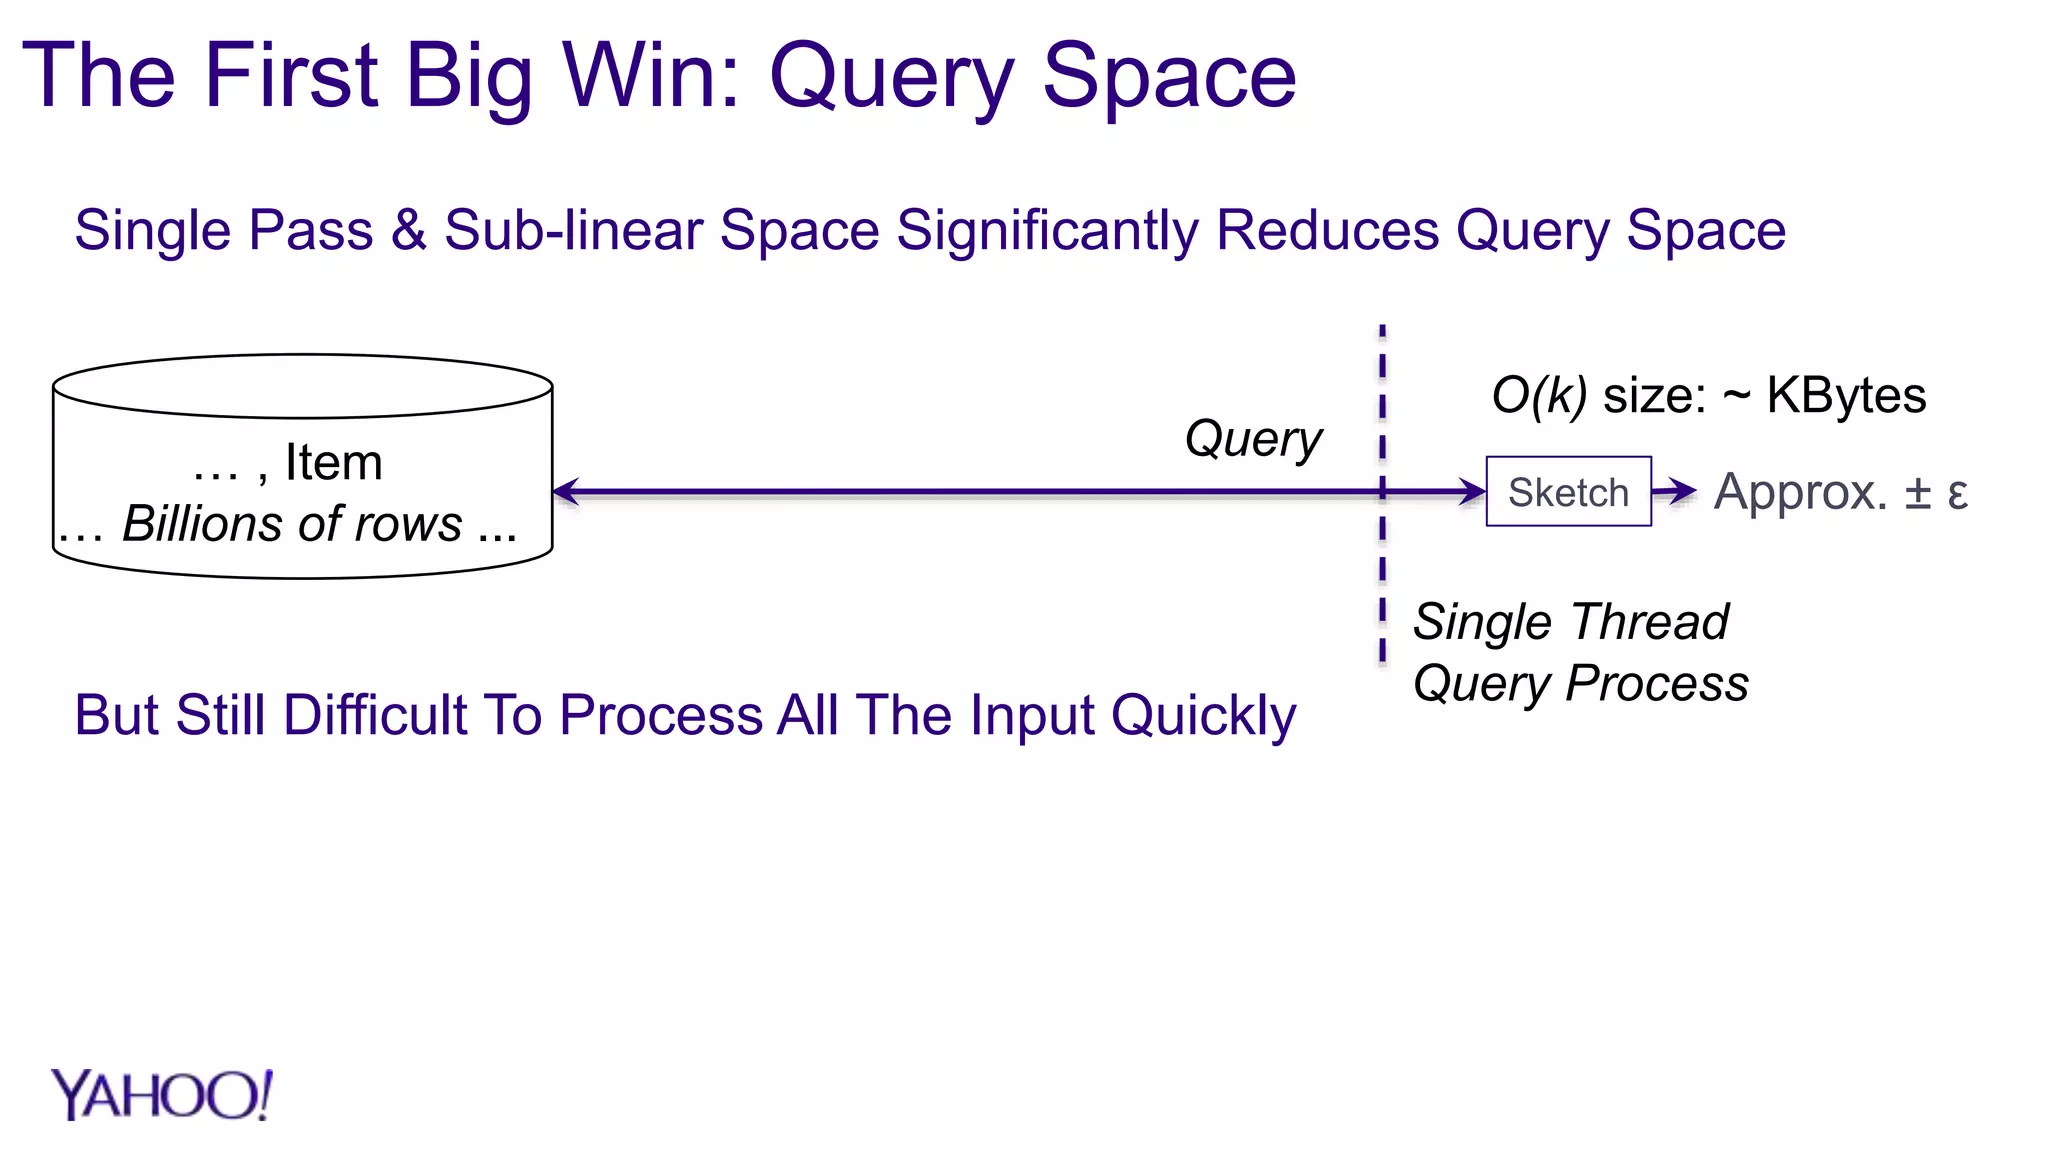
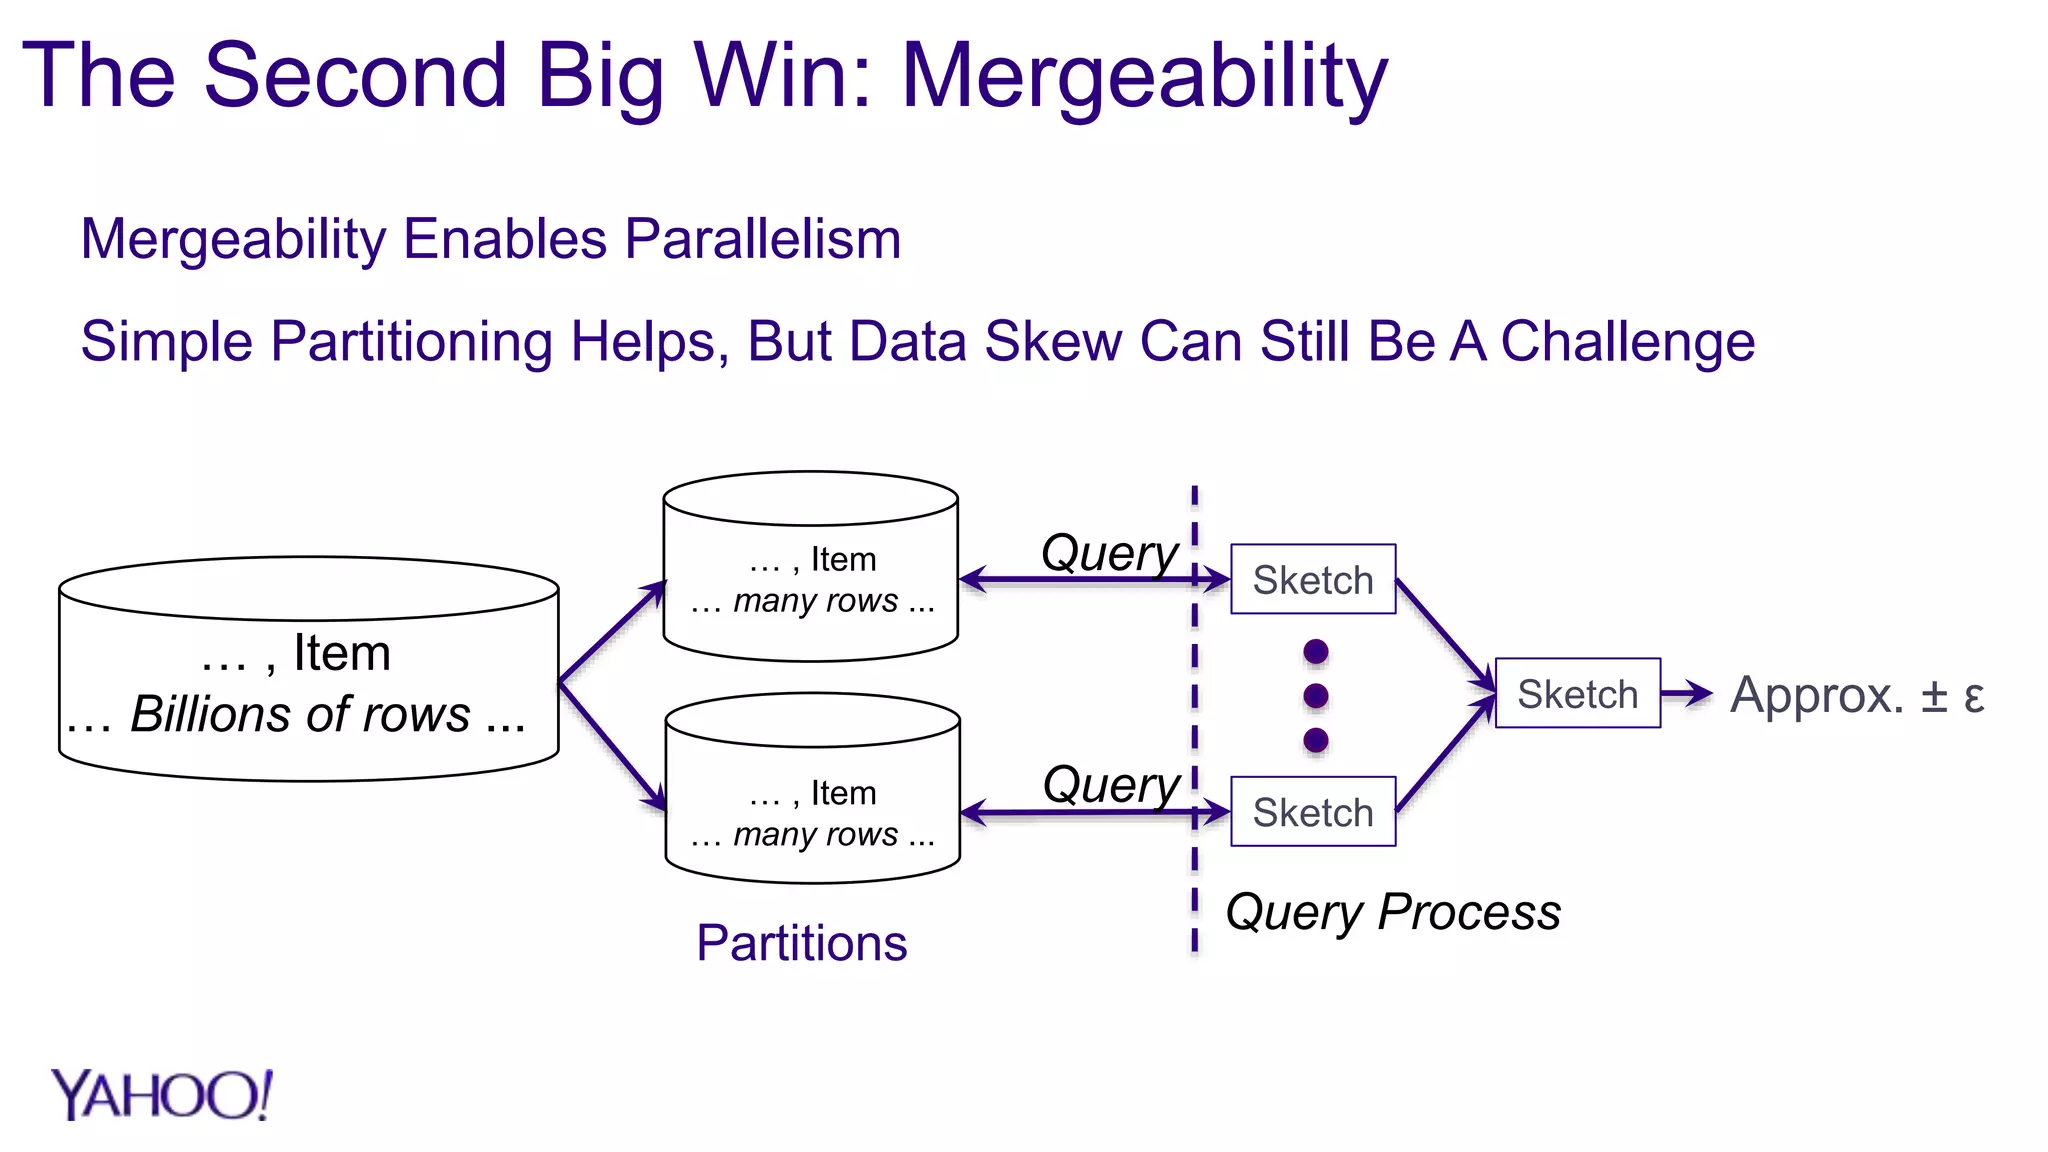
1. Sketch algorithms provide approximate query results with sub-linear space and processing time, enabling analysis of big data that would otherwise require prohibitive resources.
2. Case studies show sketches reduce storage by over 90% and processing time by over 95% compared to exact algorithms, enabling real-time querying and rollups across multiple dimensions that were previously infeasible.
3. The DataSketches library provides open-source implementations of popular sketch algorithms like Theta, HLL, and quantiles sketches, with code samples and adapters for systems like Hive, Pig, and Druid.
February 2017 HUG: Data Sketches: A required toolkit for Big Data Analytics
1. 1
DataSketches
A Required Toolkit for the
Analysis of Big Data
Lee Rhodes, Architect, Distinguished
Jon Malkin, Research Scientist, Sr.
Alexander Saydakov, Software Engineer
2. The Challenge
Time
Stamp
User
ID
Device
ID
Site Time Spent
Sec
Items
Viewed
9:00 AM U1 D1 Apps 59 5
9:30 AM U2 D2 Apps 179 15
10:00 AM U3 D3 Music 29 3
1:00 PM U1 D4 Music 89 10
Billions of rows …
Web Site Logs
4. Why are these operations so difficult with Big Data?
C = A constant factor ≥ 1
Theoretical Lower Space Bound = Ω(u):
With no prior knowledge of the data …
There does not exist an algorithm that can produce an
exact result with
Space < C * #Unique Items
5. Traditional (Exact) Approach
… , Item
… Billions of rows ...
Ω(u) size: ~ GBytes
Exact
Query
Local Copies
Processing often requires sorting
…which is very slow.
Query Process
6. Sketch Type Sketch K Sketch Size Sketch Error
Distinct Count k = 4096 32 KB (or 2 KB HLL) 1.6% Relative
Frequent Items k = 256 4 KB (1.4% * W) Absolute
Quantiles k = 128, N = 1B 25 KB 1.7% Absolute Rank
If Approximate Results are Acceptable …
We Can Reduce the Size Substantially … by Sketching!
k = A configuration parameter that affects size and accuracy
W = Sum of all count weights
N = Stream size
7. Sketch Origins
Theor.
Math
Comp.
Sci
“Sketch”
The Common Term for a Broad Range of Algorithms
Research Disciplines
•Stochastic Streaming Algorithms
•Sub-linear Algorithms
Relatively Recent Papers
• Unique Counts:
o Flajolet+, HLL: 2007
o Lang, Rhodes+, 2016
•Frequent Items:
o Cormode+, 2009
•Quantiles:
o Cormode+, 2013, Lang+ 2016
8. Sketch: Common Elements & Properties
Result +/- ε
ε = f(k)
Big Data
Stream
• Single-pass
• Sub-linear space
• Mergeable
• With mathematically proven error bounds
Data Structure
Size = f(k)
Random
Selection
Algorithm
Estimator
Algorithm
Sub-Linear
9. … , Item
… Billions of rows ...
The First Big Win: Query Space
Sketch Approx. ± ε
But Still Difficult To Process All The Input Quickly
Query
O(k) size: ~ KBytes
Single Thread
Query Process
Single Pass & Sub-linear Space Significantly Reduces Query Space
10. The Second Big Win: Mergeability
Mergeability Enables Parallelism
Simple Partitioning Helps, But Data Skew Can Still Be A Challenge
… , Item
… Billions of rows ... Sketch Approx. ± ε
Sketch
Sketch
… , Item
… many rows ...
… , Item
… many rows ...
Query
Query
Partitions
Query Process
11. Big Wins 3, 4: Speed, Simpler Architecture
Intermediate Sketch Staging Enables Query Speed & Simpler Architecture
Sketch Approx. ± ε
Query
Query
Query only the
rows required!
… , Item
… Billions of rows ...
d1,d2,… , Sketch
d1,d2,… , Sketch
Row
Row
Data Mart
Query Process
Stored Sketches Can Be Merged
By Any Dimensions, Including Time!
12. Advantages of Sketch-based Design
• Architectural simplicity
– Fewer processing steps: Multiple sketches in parallel in one pass
– Fewer intermediate tables: Store sketches vs. reprocessing raw data
– Results stored in “additive” data cube instead of static reports
• Enables reporting on arbitrary dimension combinations
– Fast merging: Recombine sketches as needed
• Exact counting is not “additive”: Lots of tables, not a data cube
– Rolling day, week or month
– Simple time zone adjustments
• Set operations are cheap
– Intersections, e.g. for user retention
– Set differences, e.g. for filtering
13. Case Study 1: Simple Distinct Counting
• Task: Count id1 and id2 visiting a few high-volume websites
• Data: Avg. ~245GB web logs daily; 7.6TB monthly
• Goal: Unique counts hourly, daily, weekly, and monthly
Hourly process, using Pig (similar to Hive and Spark results):
Exact Data Stored CPU Time (s), Storage
Stage 1 {site, hour, id1}, {site, hour, id2} 1.39M sec
33.4 GBStage 2 {site, hour, count(id1), count(id2)}
Sketches Data Stored (Sketch k = 32K) CPU Time (s), Storage
Stage 1 {site, hour, count(id1), count(id2), sketch(id1), sketch(id2)}
1.06M sec
1.1 GB
14. Case Study 1: Daily Rollups
Exact Data Stored CPU sec, Storage
Stage 1 {site, hour, id1}, {site, hour, id2} 96,300 sec
16.0 GBStage 2 {site, hour, count(id1), count(id2)}
Sketches Data Stored CPU sec, Storage
Stage 1 {site, hour, count(id1), count(id2)}
709 sec
Reports only
Times summed across all days in one month.
15. Case Study 1: Weekly, Monthly Rollups
Exact Counting CPU Time (s)
Week 43,500
Month (via daily) 46,500
Month (via hourly) 70,900
Sketches CPU Time (s)
Week 424
Month 466
16. Case Study 1: Perspectives
• Only a few dimensions and metrics
– Favorable to exact counting
– Still shows substantial benefits from using sketches
• Batch process (Pig)
– Substantial job overhead compared to real time reporting engines (e.g., Druid)
– Penalized the relative sketch compute time
• Real time rollups can be computed in seconds from the hourly data cube with sketches
• As the number of dimensions grows, the benefit of using sketches
becomes even more dramatic
17. Big Wins 5, 6: Real-time, Late Data Updates
Case Study 2: Flurry/Druid Sketch Flow Architecture
Hadoop (Hive, Pig)
Druid
Storm
S
B
B Sketch
Sketch
Dim1, … , Dimm, Item
… Billions of rows ...
Sketch Approx. ± ε
Dim1, … , Dimm,
Dim1, … , Dimm,
Query
Query
Sketch
Sketch
Sketch
Sketch
Continuous stream from
edge web servers
Sketch
Sketch
Sketch
Sketch
Approx. ± ε
Approx. ± ε
(Batch)
(Continuous)
Update queries
every 15 Sec.1 Min
Resolution
1 Hour
Resolution
48 Hour
History
Query Process
18. Case Study 2: Flurry, Before and After
• Customers: >250K Mobile App Developers
• Data: 40-50 TB per day
• Platform: 2 clusters X 80 Nodes = 160 Nodes
– Node: 24 CPUs, 250GB RAM
Before Sketches After Sketches
VCS* / Mo. ~80B ~20B
Result Freshness
Daily: 2 to 8 hours; Weekly: ~3 days
Real-time Not Feasible
15 seconds!
Big Win 7:
Lower System $
* VCS: Virtual Core Seconds
19. Major Sketch Families in DataSketches Library
Cardinality: Theta & HLL Sketches
– Theta: Includes Set Expressions (e.g., Union, Intersection, Difference)
– HLL & HLL Map: Highly compact
– Sample code for Java, Hive, Pig, Druid, Spark
– Adaptors for Hive, Pig, Druid
Quantiles Sketches
– Quantiles, PMF’s and CDF’s of streams of comparable values.
– Sample code for Java, Hive, Pig
– Adaptors for Hive, Pig, Druid
20. Major Sketch Families in DataSketches Library
Frequent Items Sketches
– Heavy Hitters of arbitrary objects from a stream of objects
– Sample code for Java, Hive, Pig
– Adaptors for Hive, Pig
Associative: Tuple Sketches
– Theta Sketches with attributes
– Sample code for Java, Hive, Pig
– Adaptors for Hive, Pig
Sampling: Reservoir Sketches
– Uniform sampling to fixed-k sized buckets
– Sample code for Java, Pig
– Adaptors for Pig
Once upon a time there was this little Fruit company that sells Mobile Apps and Songs.
Let’s look at some of their data.
They have some very simple queries:
How many unique users are visiting their sites?
What is the median and 95%ile of Time Spent?
What are the most frequent Songs purchased?
But this little company has become wildly successful and now they have a big problem:
The stream of data coming into their servers is many billions of rows per day.
What do you do when given the task of extracting information from truly massive data?
Do you do what probably what many of us have done in the past … throw more iron at the problem?
And with reduced size, will come increased speed of processing.
How that is realized will require some architectural insights, which we will discuss shortly.