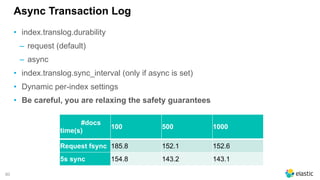
Downloaded 48 times


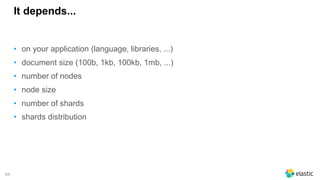
![66
Test it ;)
DATE=`date +%Y.%m.%d`
LOG=logs/logs.txt
exec_test () {
curl -s -XDELETE "http://USER:PASS@HOST:9200/logstash-$DATE"
sleep 10
export SIZE=$1
time cat $LOG | ./bin/logstash -f logstash.conf
}
for SIZE in 100 500 1000 3000 5000 10000; do
for i in {1..20}; do
exec_test $SIZE
done; done;
input { stdin{} }
filter {}
output {
elasticsearch {
hosts => ["10.12.145.189"]
flush_size => "${SIZE}"
} }
In Beats set "bulk_max_size"
in the output.elasticsearch](https://image.slidesharecdn.com/2017-11capitoledulibre-managingblackfridaylog-180212105215/85/Black-friday-logs-Scaling-Elasticsearch-63-320.jpg)

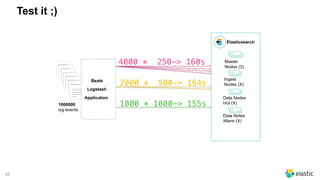
![70
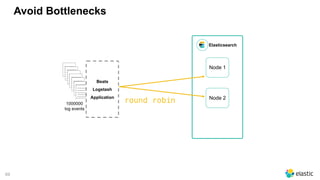
Clients
• Most clients implement round robin
‒ you specify a seed list
‒ the client sniffs the cluster
‒ the client implement different selectors
• Logstash allows an array (no sniffing)
• Beats allows an array (no sniffing)
• Kibana only connects to one single node
output {
elasticsearch {
hosts => ["node1","node2","node3"]
} }](https://image.slidesharecdn.com/2017-11capitoledulibre-managingblackfridaylog-180212105215/85/Black-friday-logs-Scaling-Elasticsearch-68-320.jpg)
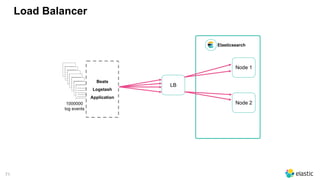
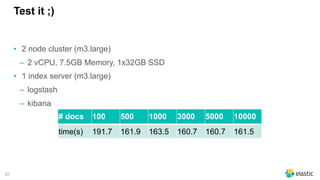
![73
Test it ;)
#docs
time(s)
100 500 1000
NO Round Robin 191.7 161.9 163.5
Round Robin 189.7 159.7 159.0
• 2 node cluster (m3.large)
‒ 2 vCPU, 7.5GB Memory, 1x32GB SSD
• 1 index server (m3.large)
‒ logstash (round robin configured)
‒ hosts => ["10.12.145.189", "10.121.140.167"]
‒ kibana](https://image.slidesharecdn.com/2017-11capitoledulibre-managingblackfridaylog-180212105215/85/Black-friday-logs-Scaling-Elasticsearch-71-320.jpg)


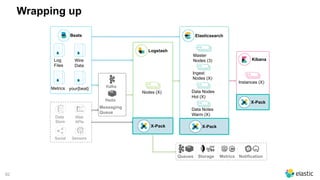
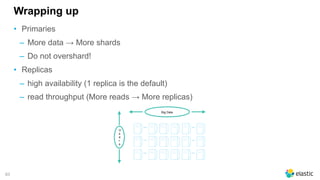
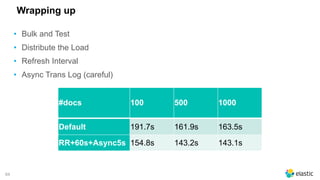


The document presents a comprehensive discussion on managing Black Friday logs using the Elastic Stack 6.0, emphasizing various platform architectures and Elasticsearch cluster sizing. It highlights strategies for optimizing data handling, including shard sizing, the use of indices and aliases, and the implementation of automation via rollover and shrink APIs. Key considerations are provided for ensuring optimal performance in big data environments, including bulk sizes, load distribution, and enhancing write throughput.