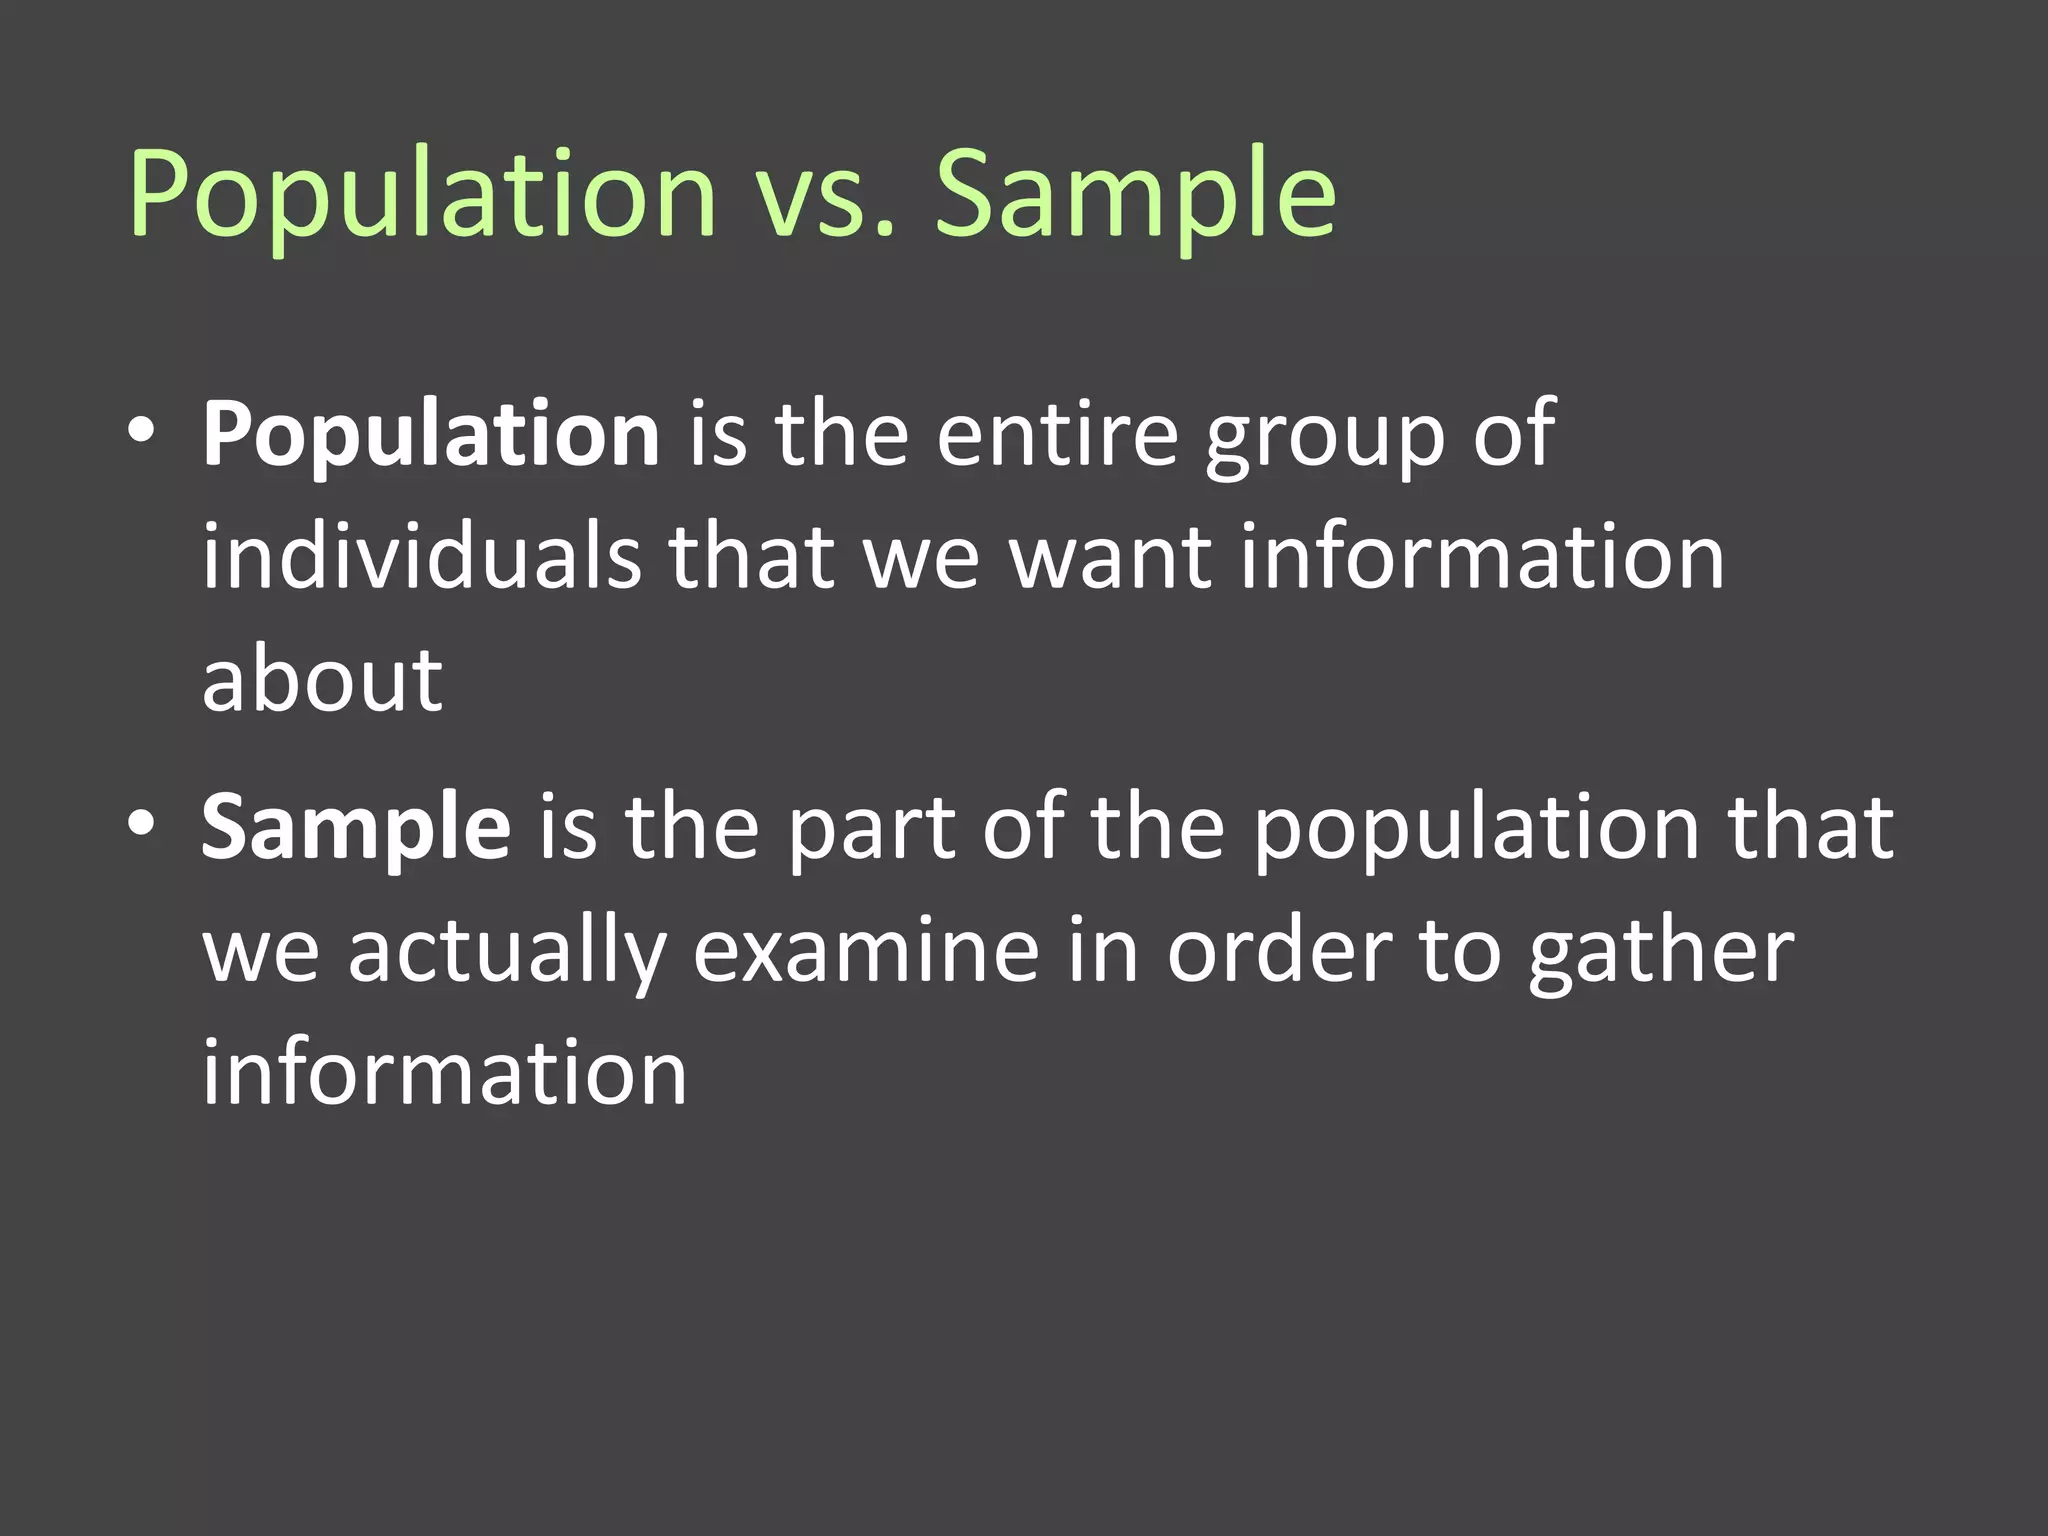
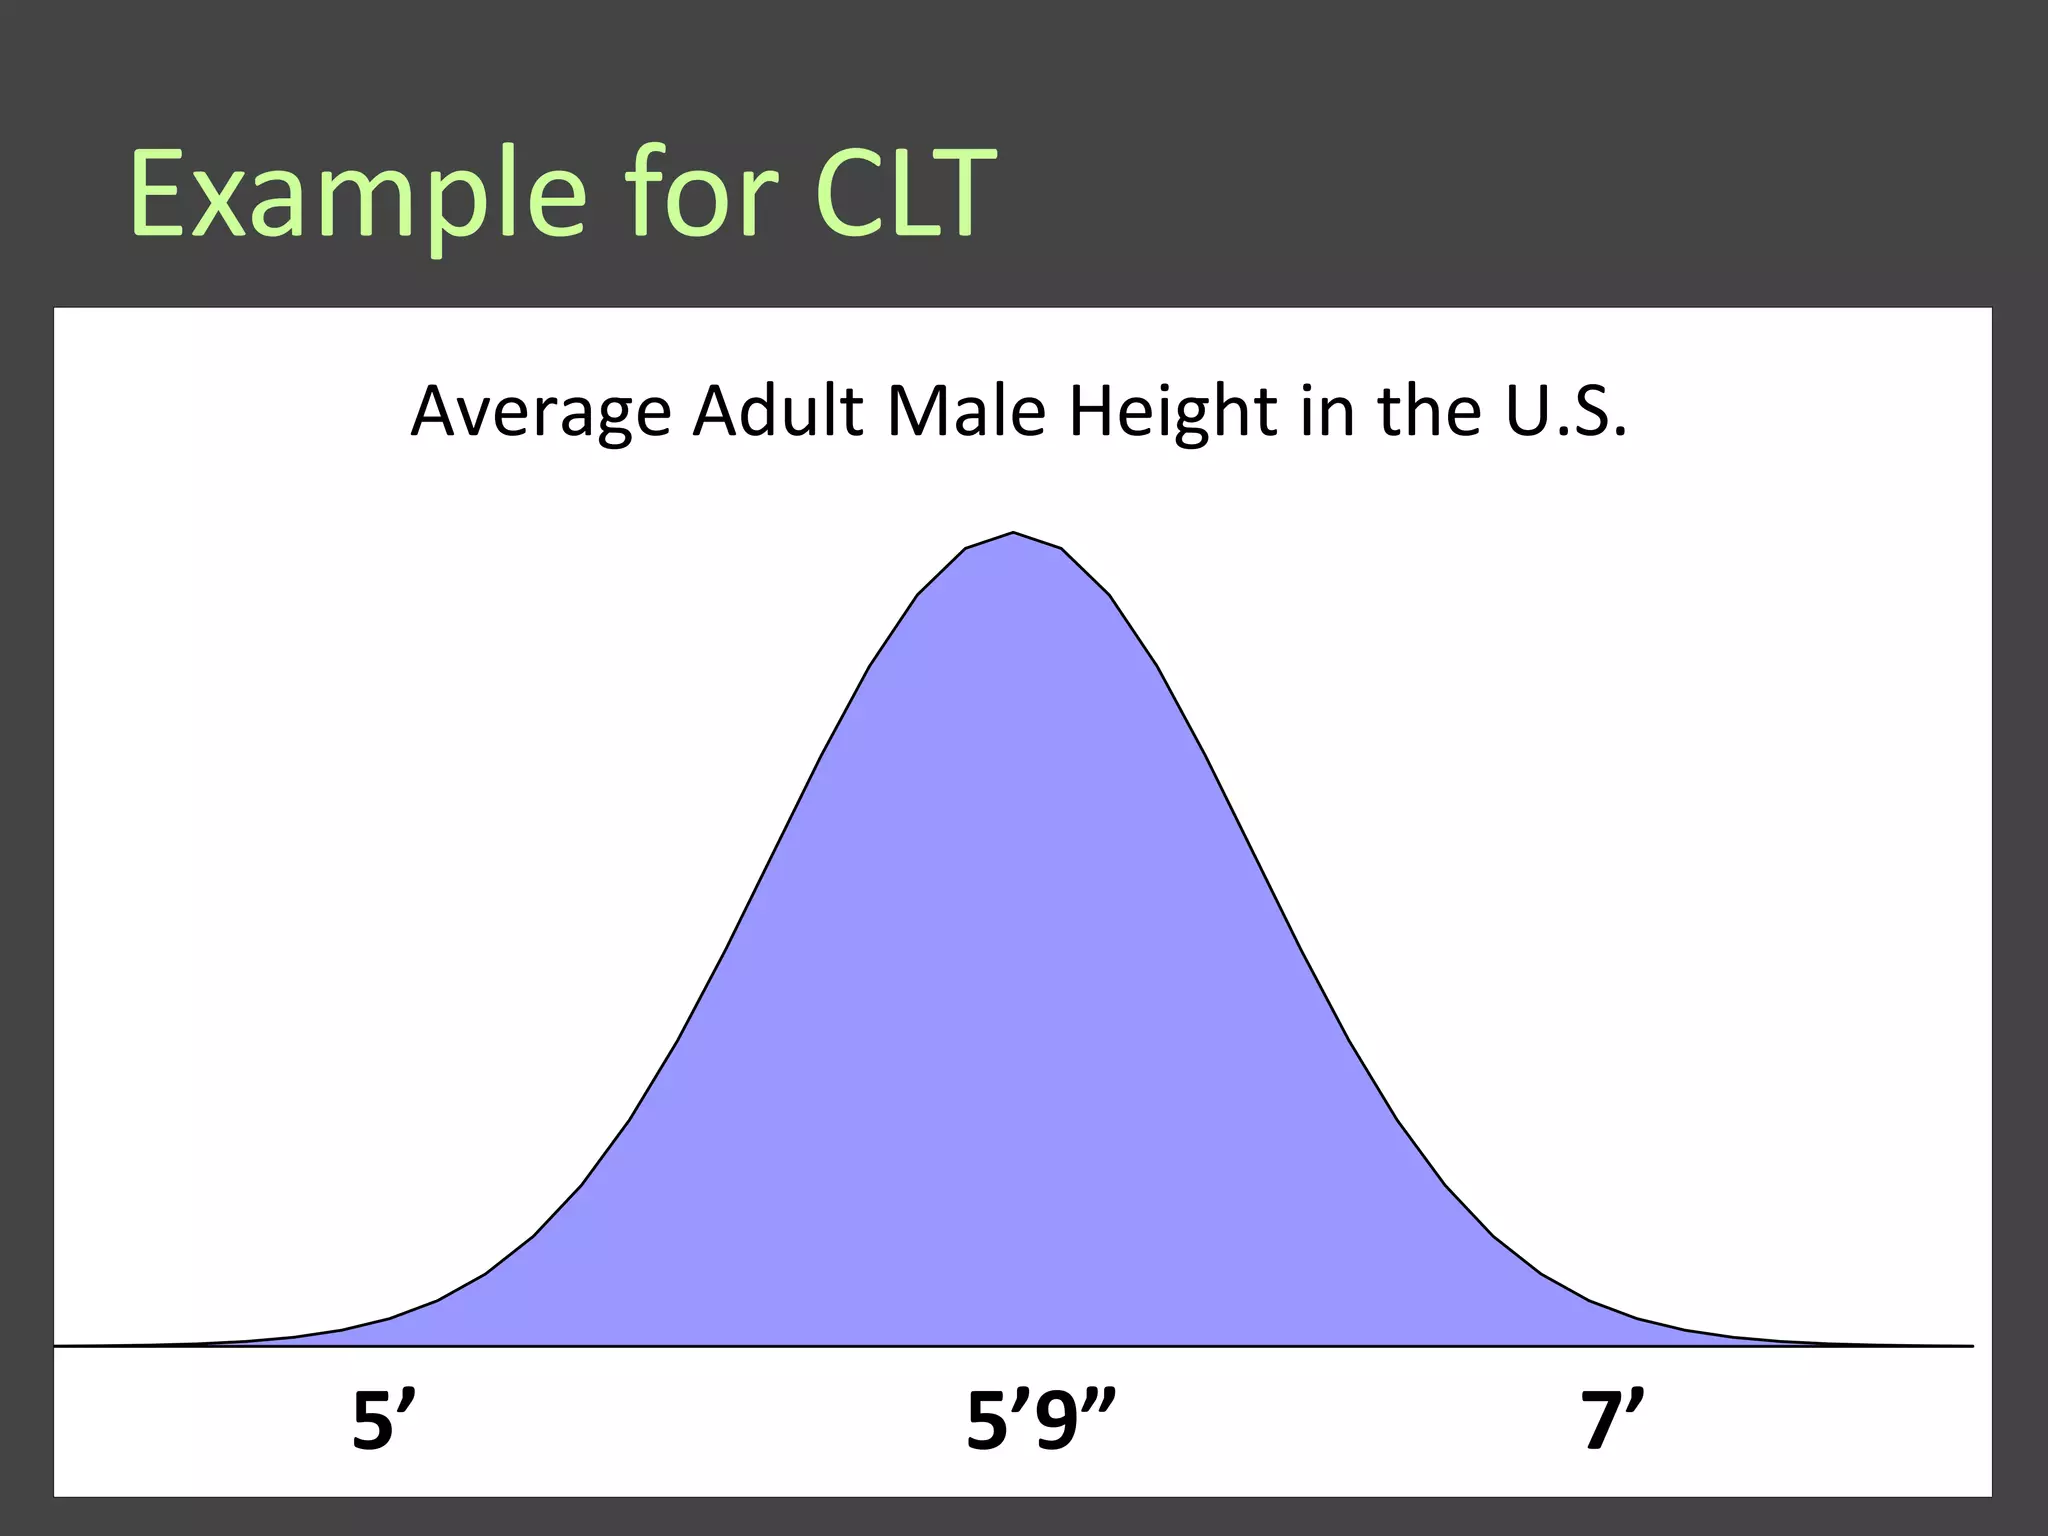
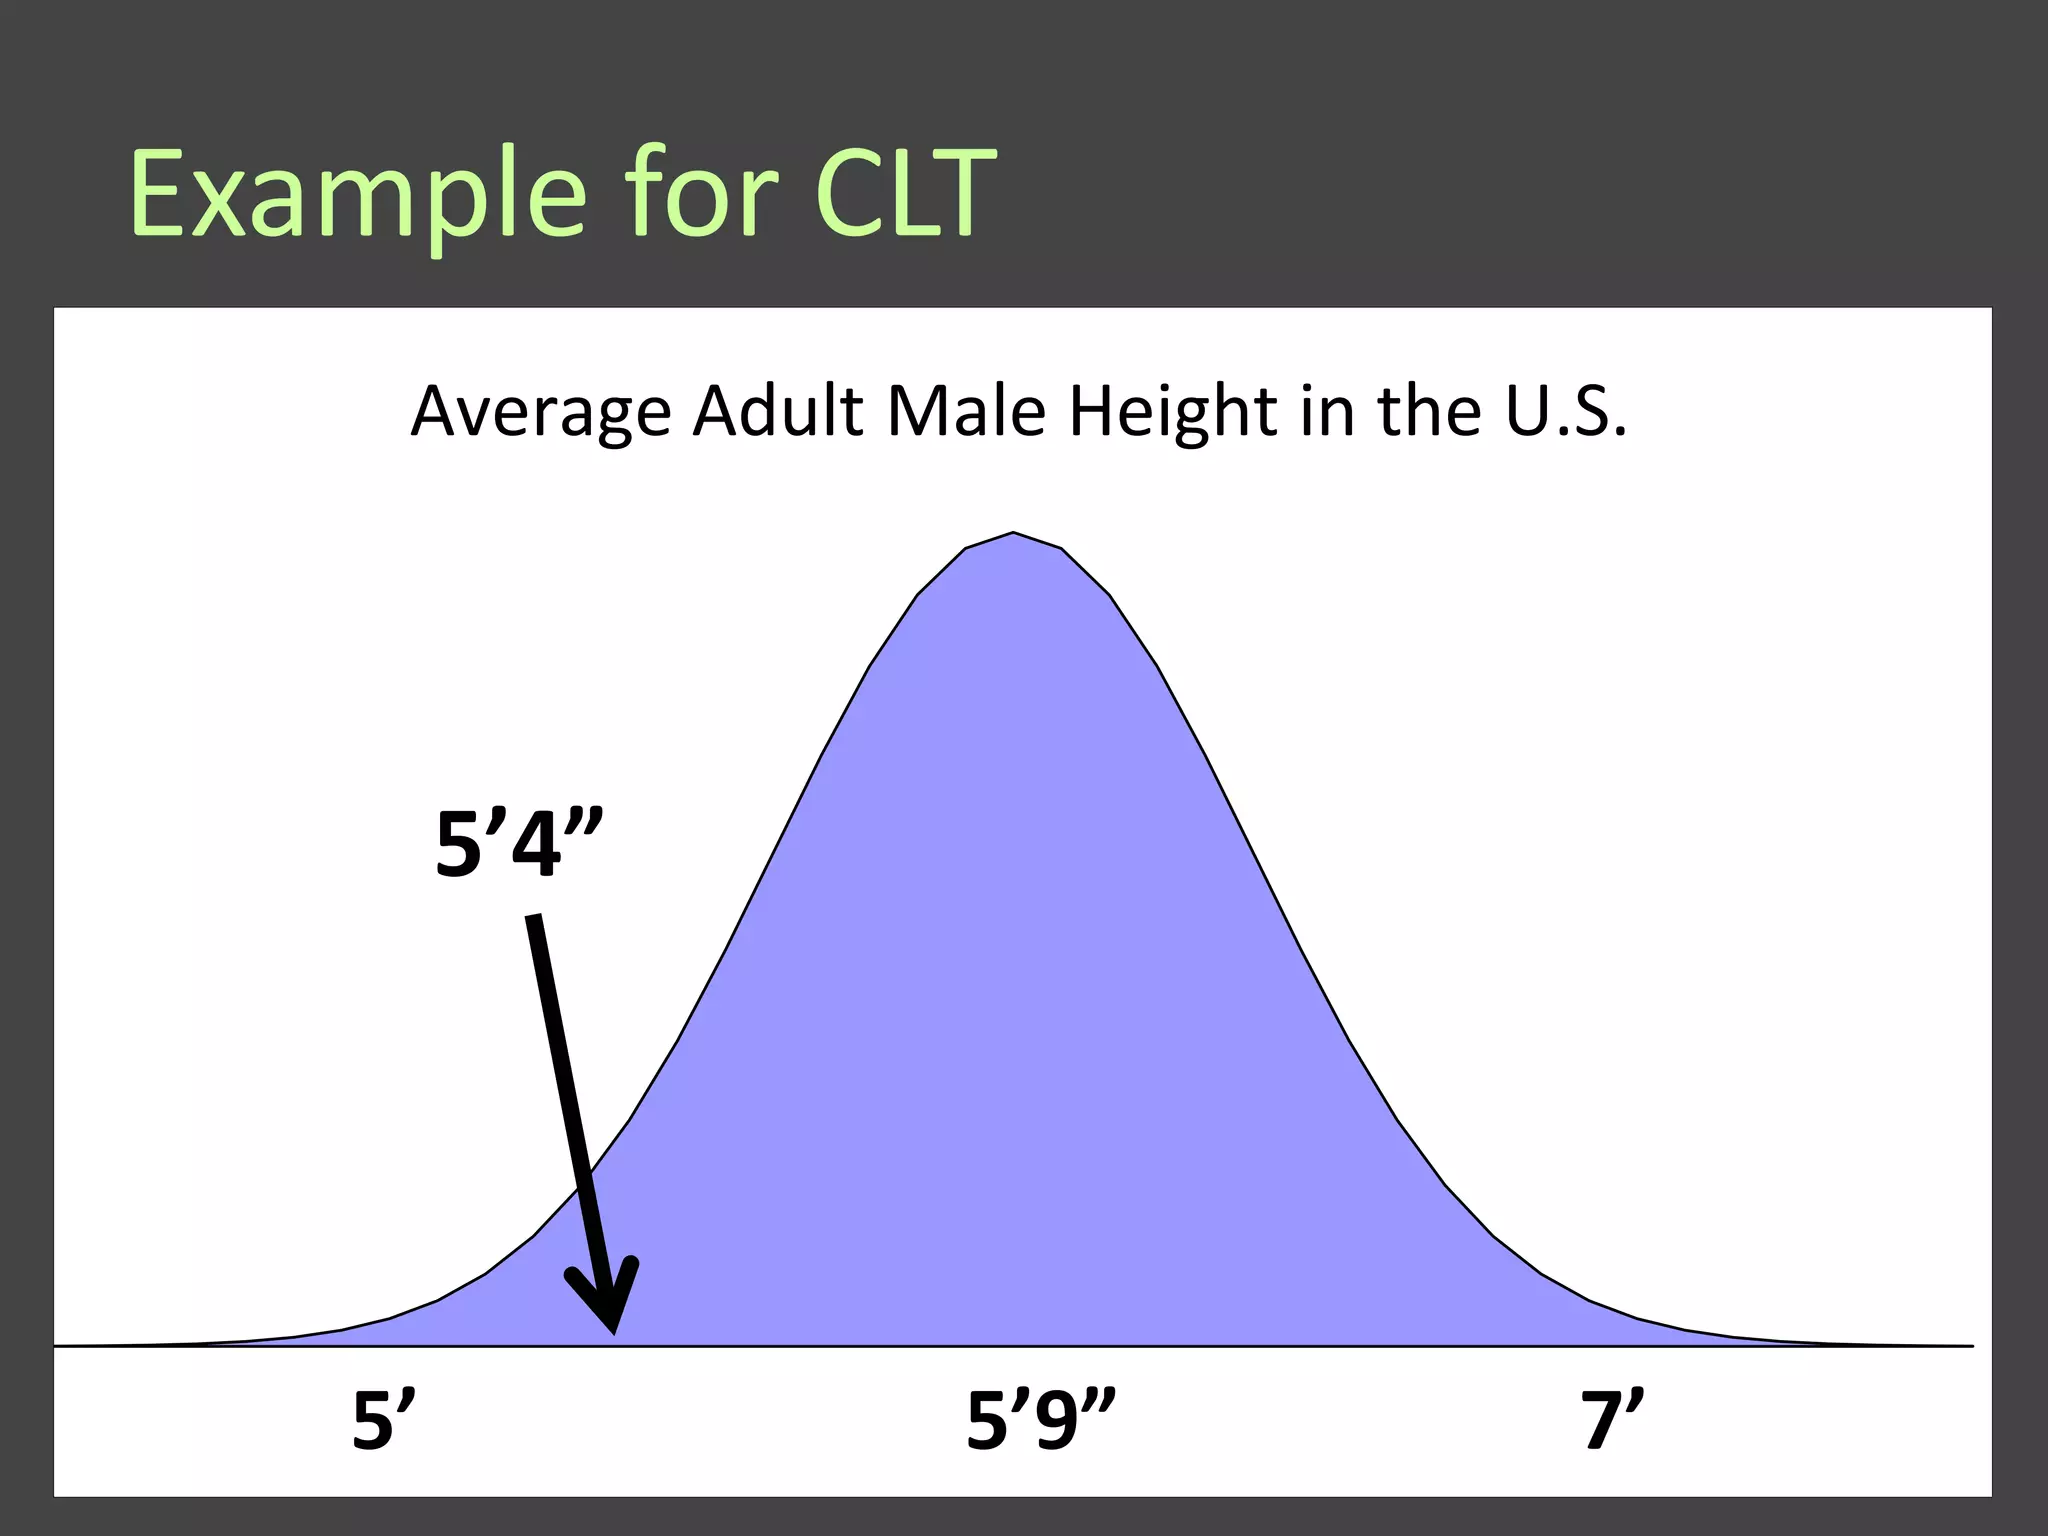
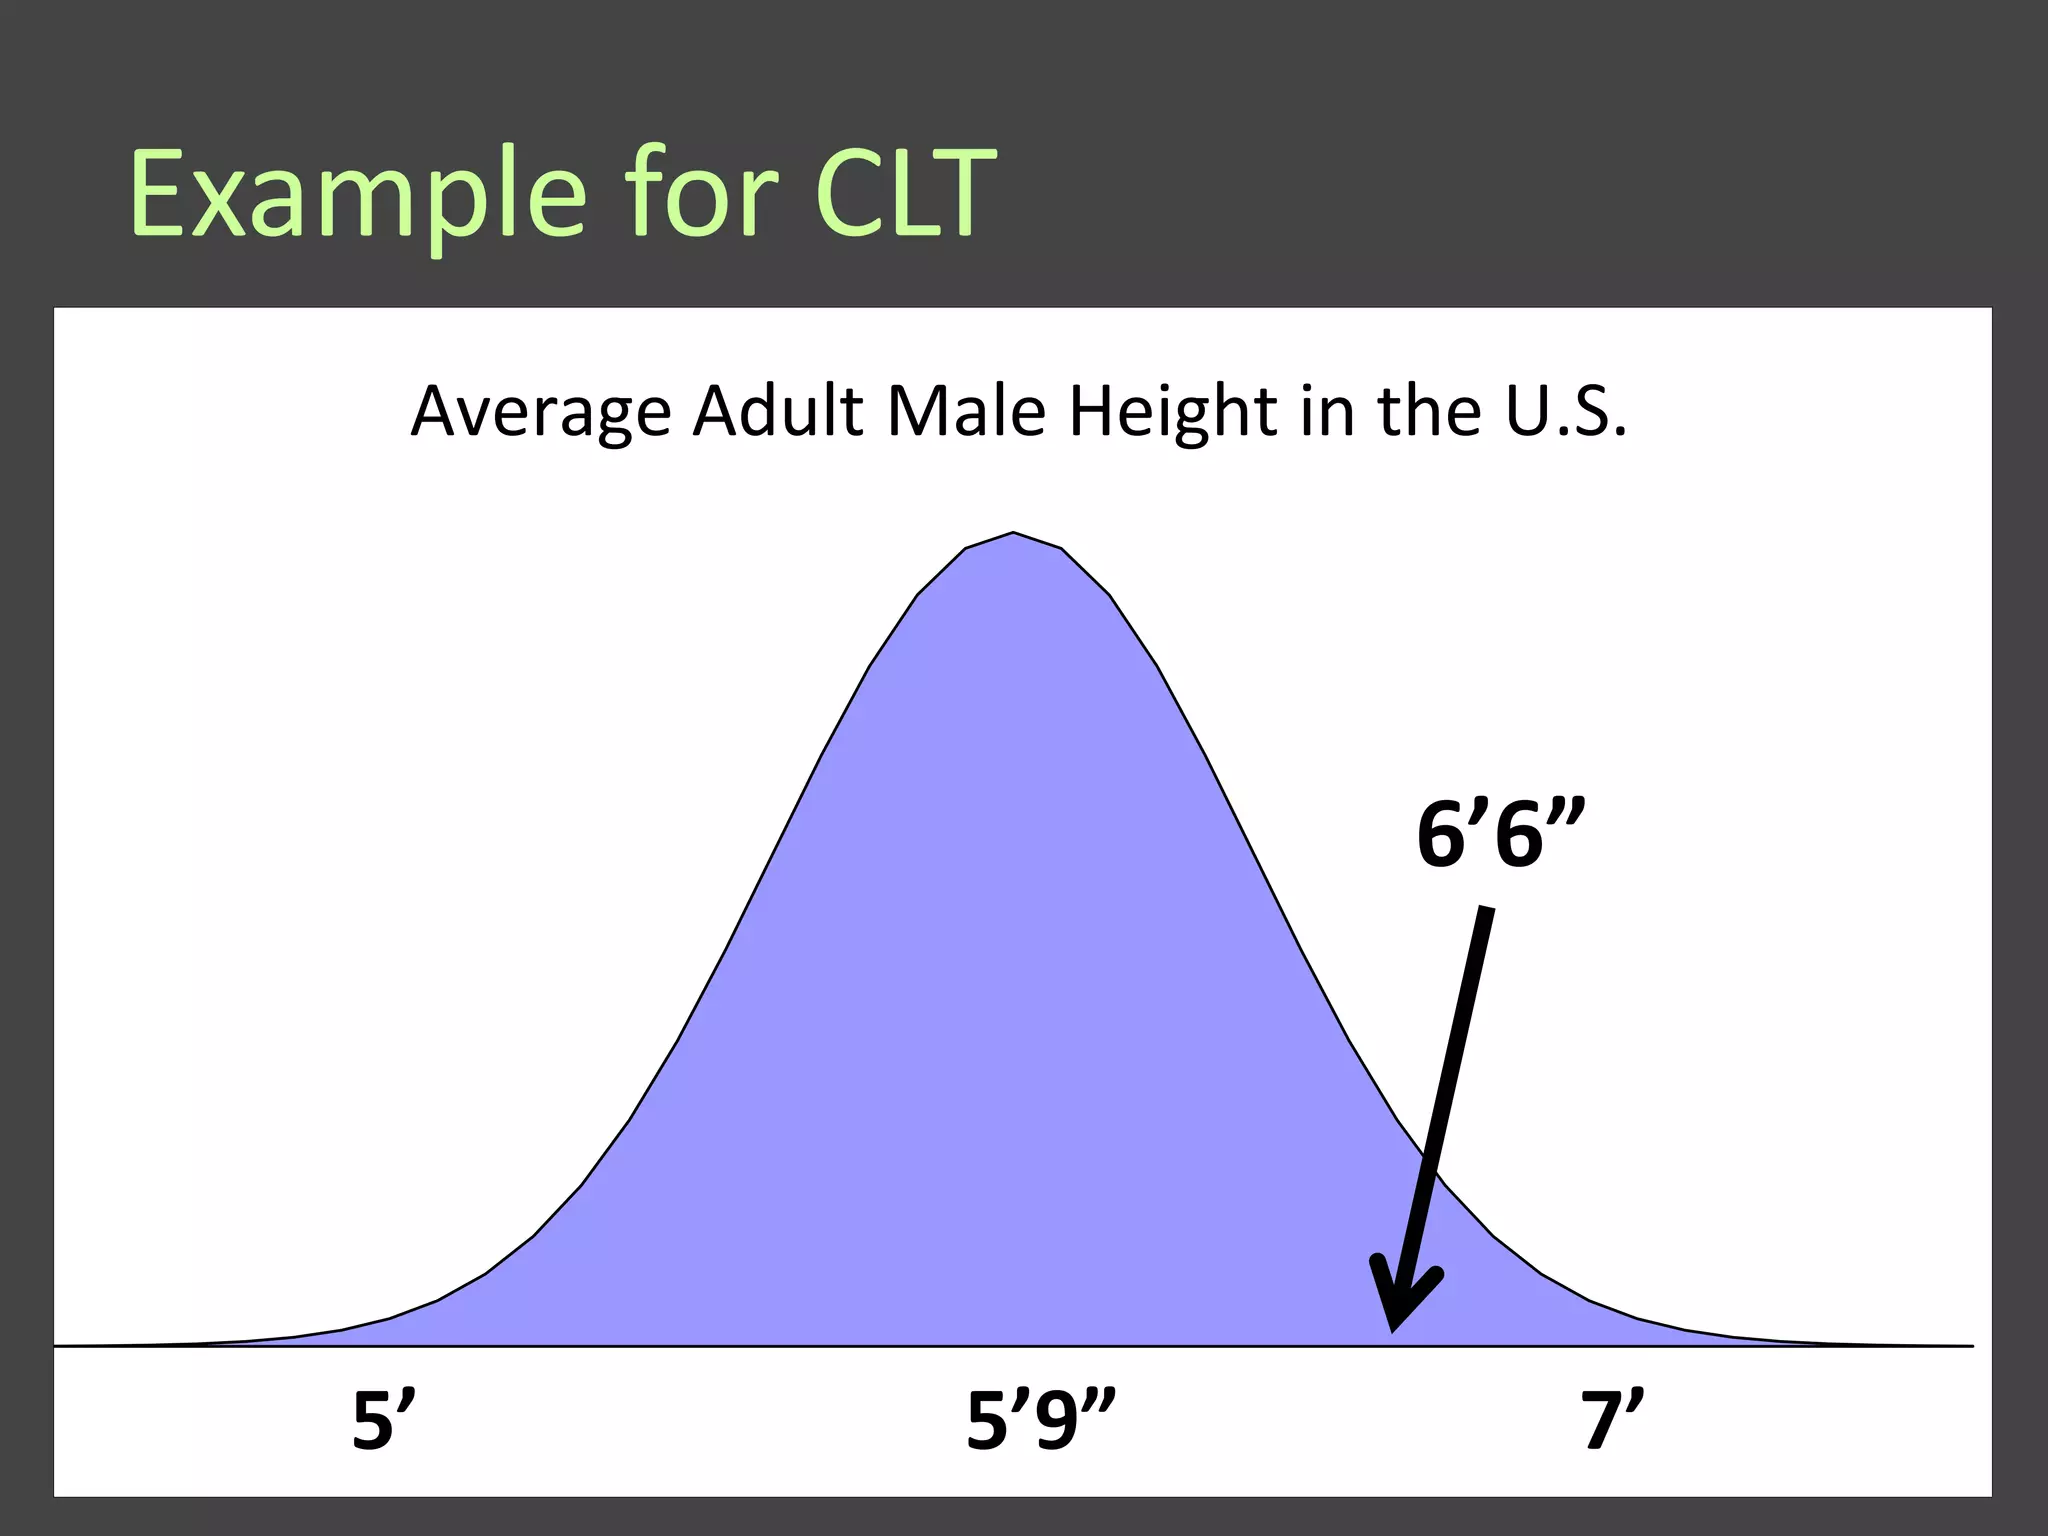
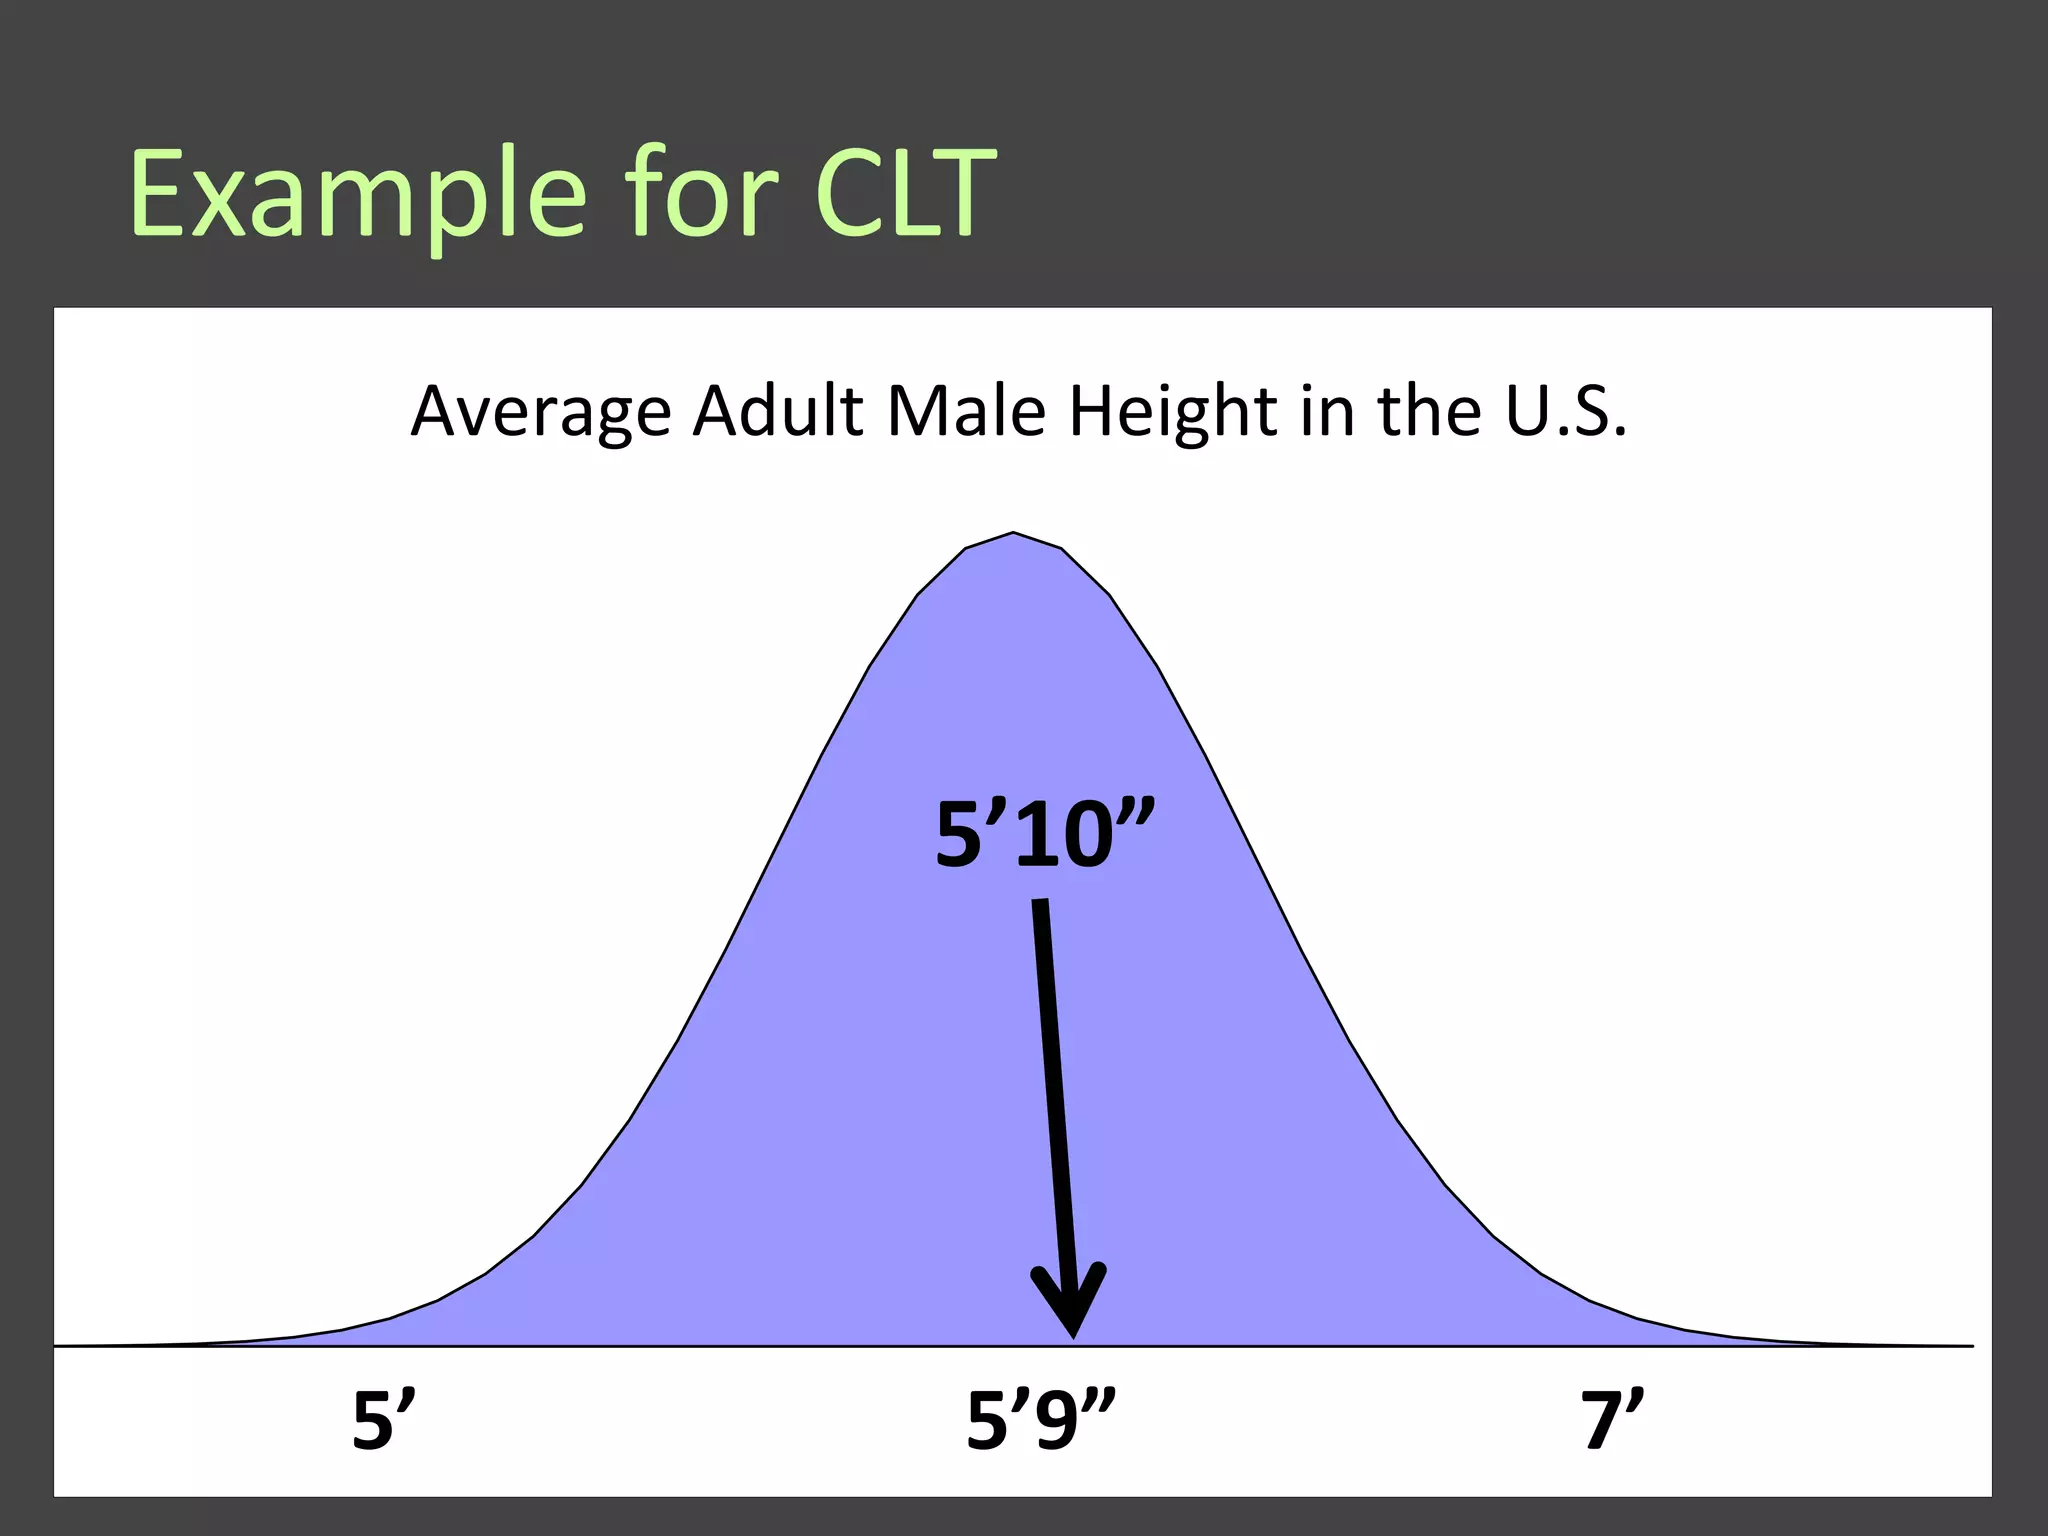
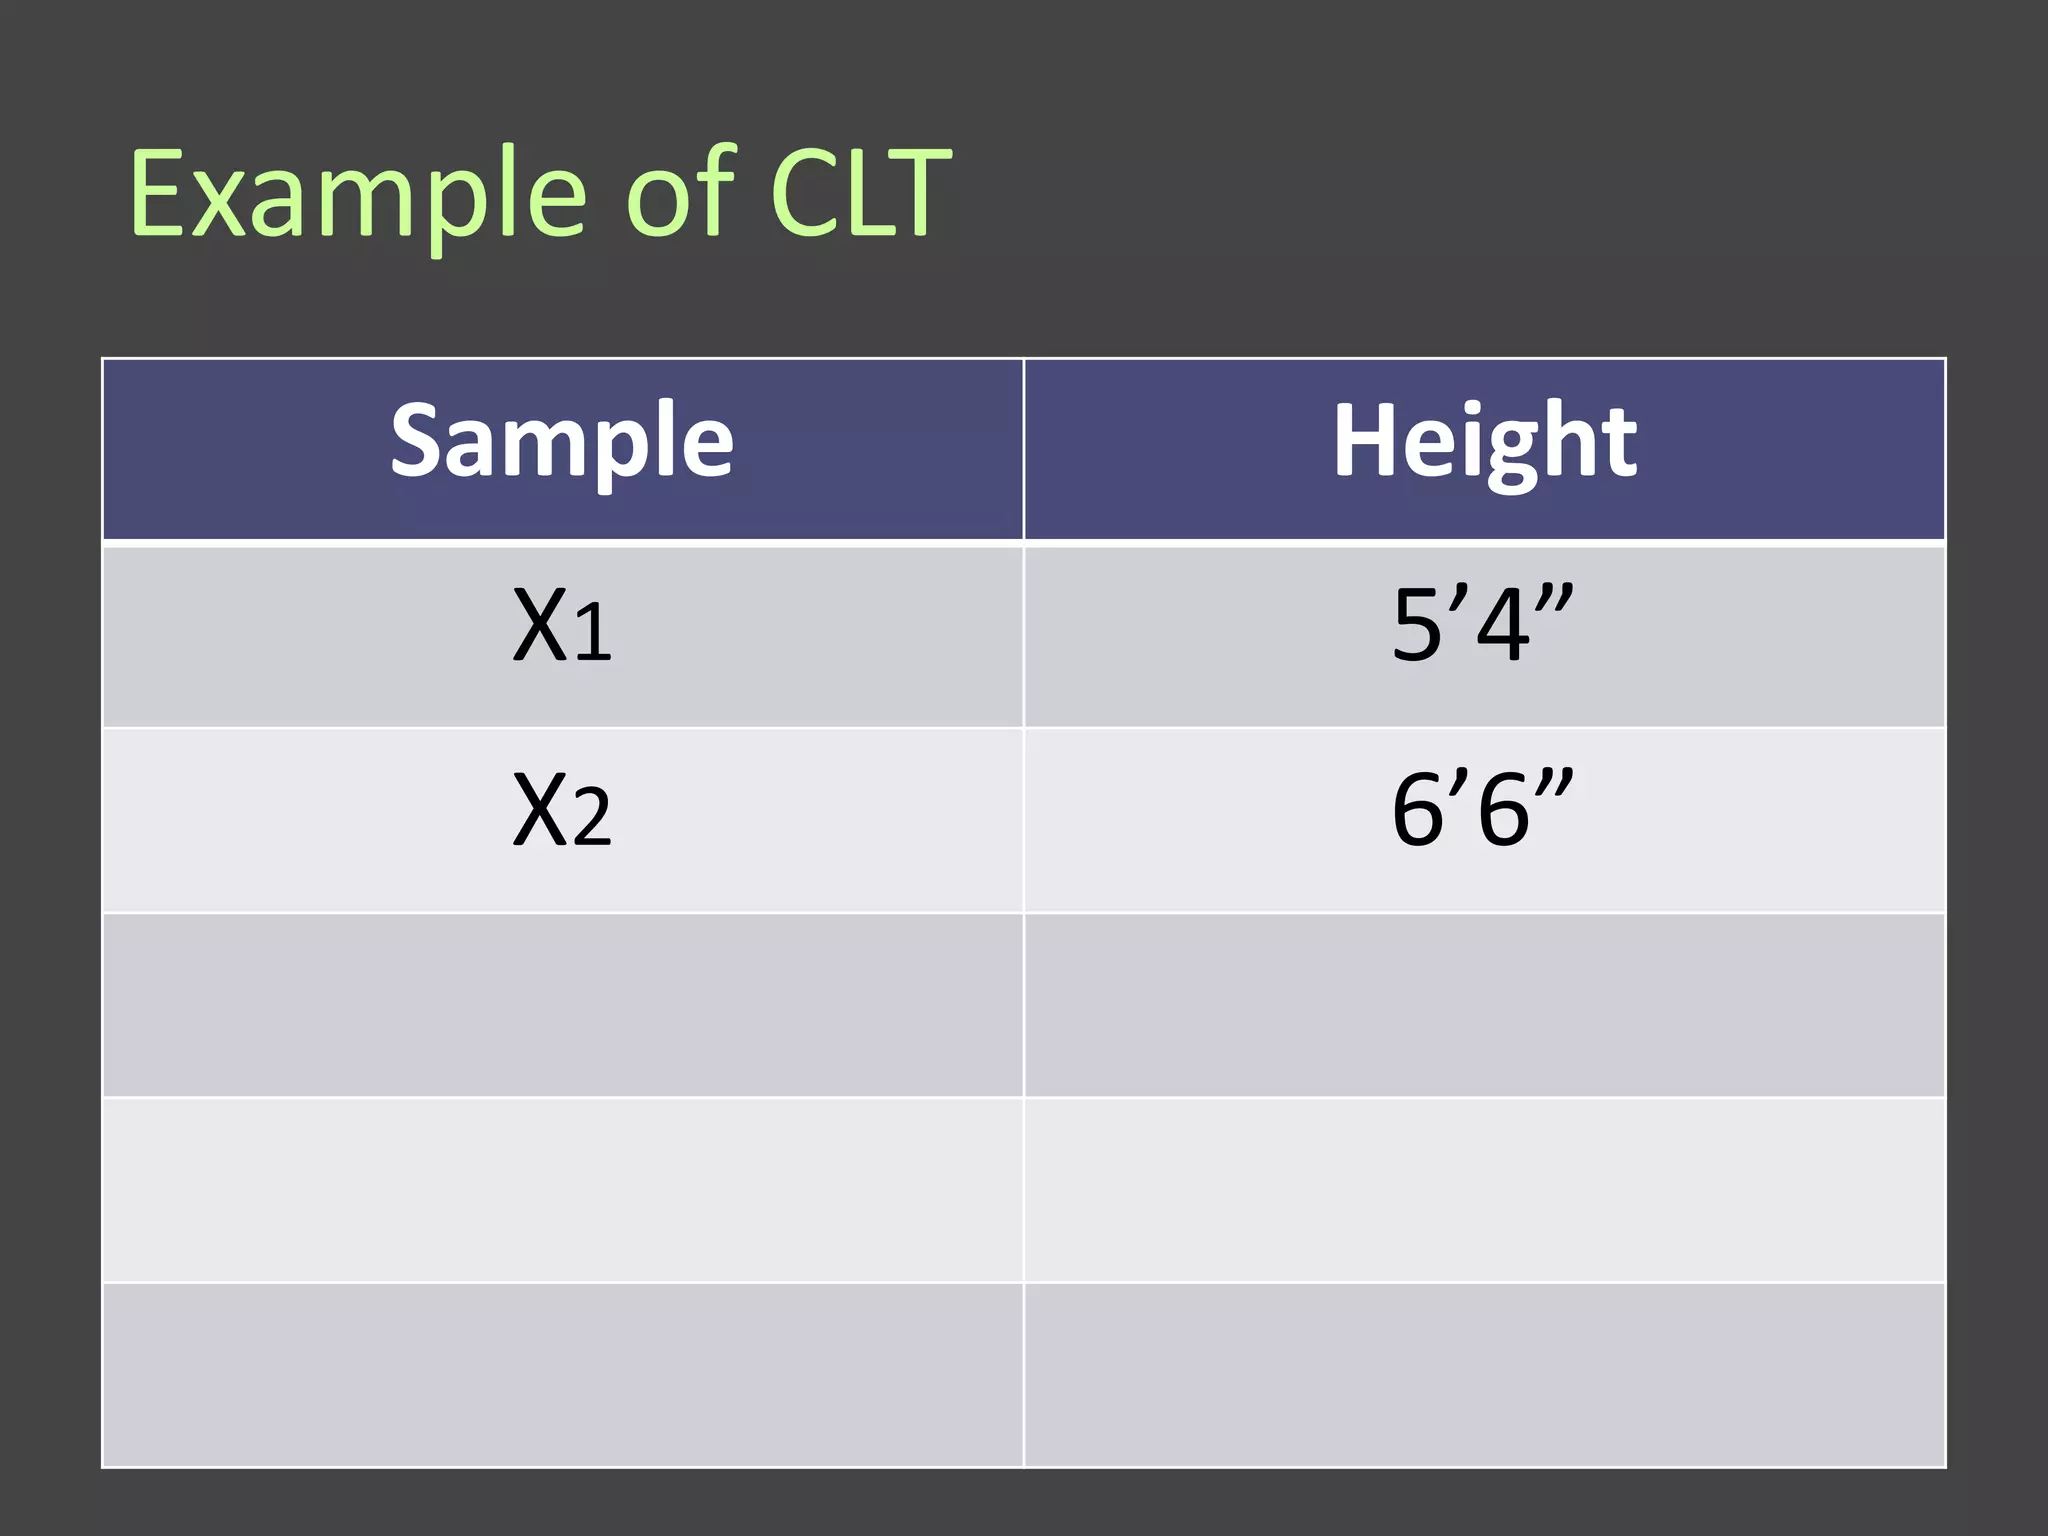
Chapter 3
Research Method
       EDHE6530
Dr. Pu-Shih Daniel Chen
Overview
•   Review our progress
•   Chapter 3 Research Methods
•   Break
•   How to review journal articles?
•   A quick review of quantitative research
    methods
A Quick Review
Chapter One
• Introduction/problem statement
• Purpose of the study
• Conceptual framework or theoretical
  orientation
• Research questions and hypotheses
• Definition of terms
• Significance of the study
• Limitations, delimitations, & assumptions
Key to a good literature review
• Always keep your research questions in
  mind
• Critically analyze the literature
• Integrate instead of summarize
• Use primary sources
• Distinguish between assertion and
  evidence
Other tips
• Don’t ignore studies that differ from
  majority or personal bias
• Read most recent ones first, oldest last
• Read important landmark works
• Use data-based, empirical studies
• Opinion pieces and descriptive research
  helpful in introduction – set stage
• Not a literary production- be clear and
  concise
Basic Research
• Theory Driven
• Discovery of knowledge
Applied Research
• IMMEDIATE practical problem
• ACTUAL problems in the field
• Limited generalizability
Research vs. Assessment
Research                      Assessment
• Generate knowledge that     • Evaluate the progress or
  can be applied broadly        results of a initiative or
• Audience is not location-     program
  bounded                     • Internally focused
• Sample based                • To improve the project or
                                process
                              • Population based
Quantitative vs. Qualitative
•   Epistemology
•   Treatment of Theory
•   Role of the researcher(s)
•   Data collection and analysis
•   Quality controls
•   Report of findings
•   Types of studies
•   How to choose between the two methods
Quantitative Methods
• Experimental Design
• Casual-Comparative Design
  – Survey Research
  – Secondary Data Research
• Descriptive Design
Qualitative Methods
•   Ethnography
•   Case Study
•   Grounded Theory
•   Narrative Inquiry
    – Content Analysis
Ideological Approaches
• Researcher’s role
  – Interpreting the phenomenon through a
    particular perspective
  – Identifying marginalized or endangered
    people in society
  – To advocate
• Challenging traditional views and usually
  controversial
Mixed-Method
• Philosophically torn between positivist
  and Phenomenology
• Pragmatism comes to save the day
• Focusing on “solving the problems”
  instead of philosophical arguments
• Mixed-method is NOT half quantitative
  and half qualitative
Discuss Your Research
Questions and Possible Method
Selections
Chapter 3
Research Methods
Purpose of the method chapter
• Make your research transparent
• Make it possible to other researchers to
  replicate your study
• Make it possible for other researchers to
  judge the quality of your study
Did you remember?


   Always keep your research
       questions in mind
Four questions are addressed
•   Who participated in the study?
•   Types of materials needed?
•   What data were collected and how?
•   How did you analyze the data?
Participants/Sample
• How were they selected?
  – Random selection
  – Volunteers
  – Paid
• From where are participants
  – Geographic region
  – Institutional affiliation
Participants/Sample
• Demographic characteristics
  – Age/age range
  – Gender
  – Ethnicity
• Other information for replication
Example of Participants
A total of 50 participants will be selected from
a population of 157 students enrolled in an
Algebra I course at a large urban high school in
Houston, TX. The population is tricultural,
composed primarily of Caucasian non-
Hispanic, African American, and Hispanic
students from a variety of Latin American
backgrounds. Moreover, 100% of students at
this school are enrolled in the free or reduced
price lunch program. Participants, comprised
Example of Participants
of 54% female and 46% male, will be
selected randomly through use of random
numbers table (Ary, Jacobs, & Razavieh,
1996).
Instrumentation
• Describes “things” used
• Sources of data
  – Test, questionnaire, interview…etc.
  – Archival sources
• Why instruments selected
• Quality of your instrument
  – Validity
  – Reliability
Instrumentation
• Who and how administered?
  – How many items
  – How long to complete
  – How scored
  – Special condition
• If new instrument developed
  – Why
  – Field test?
  – Include in entirety as table or appendix
Example of Instrumentation
The Stanford Achievement Test (SAT):
Arithmetic Test (Level 7.0 – 9.9) will be
utilized as the data gathering instrument.
Split-half reliability coefficients are reported
to range from .86 to .93 (Davies, 1994) and
reviewers (Locus, 1995; Smythe, 1994) are in
agreement concerning its high content
validity. The SAT Arithmetic test is comprised
of 45 multiple-choice items and requires
approximately 35 minutes to complete.
What is missing from the
example?
• Why instruments selected
• How scored (what is the score range and
  distribution?)
Procedures
• What did researchers/participants do?
  When? In what order were activities
  conducted?
• If intervention or treatment given,
  describe in detail
• Write in cookbook manner; step-by-step
  process
• Remember – enough details for
  replication
Example of Procedures
In the fall of 1997, prior to the assignment of
students to classes, a list of all students
scheduled to enroll in General Math I in the fall
(approximately 150) will be obtained from the
principle of the school. Using this list, 50
students will be randomly selected through
use of a random numbers table to participate
in the study. These 50 students will then be
randomly assigned to one of two General Math
I classes, one class to receive
Example of Procedures
programmed instruction and one class to
receive lecture-discussion instruction. The
random assignments to class type will also be
performed through the use of a random
numbers table. The programmed instruction
class will utilize a computer program titled
Herculette, published by the Programmers
Institute of Technology School (1996), and
used on IBM or IBM compatible computers
with a Pentium 686 processor. In this program,
Example of Procedures
students are required to exhibit mastery
learning on each lesson prior to making a
transition to the next higher lesson in the math
sequence. The lecture-discussion classroom
teacher will present the same math concepts
used in the Herculette program but through a
lecture format instead of through use of a
computer. Discussion will occur between the
teacher and students when students ask
questions about math concepts.
Data Analysis
• Describe techniques to analyze data
  – Quantitative studies – Statistics procedures
    • A brief description and explanation of the
      statistics you choose to use
    • The reason for choosing this statistical method
  – Qualitative studies – data summary,
    interpretation, and method of verification
    • Give as much details as possible
    • Remember triangulation – how you going to
      achieve that
Example of Data Analysis
A statistical analysis will be used for comparing
the achievement, on a test of reading
comprehension, of two randomly formed
groups of second grade students. An
independent samples t-test will be used to
determine whether the means of these two
groups are statistically significantly different
from one another. Should the data analysis
provide a statistically significant result at the
.05 level, then null hypothesis will be rejected.
Example of Data Analysis
Should the statistical analysis not yield a
statistically significant result at the .05
level, then the null hypothesis will not be
rejected. For each comparison, an alpha
level of .05 will be used for the level of
statistical significance.
Class Activities
• Outline your Chapter 3
  – Population/Sample/Participants
  – Instrumentation
  – Data collection methods
  – Data analysis
A Quick Review of
Quantitative Research Methods
Statistics Methods for Social
Sciences
• Major assumptions in statistics
• Types of questions that can be answered
  – Are they different?
  – What is the relationship?
  – What cause it to happen?
  – What cause the whole thing to work like
    that?
Population vs. Sample
• Population is the entire group of
  individuals that we want information
  about
• Sample is the part of the population that
  we actually examine in order to gather
  information
Which is which?
A study of political orientation of African
American female registered voters under
 age 25 in the 2008 presidential election

• All female African American
  undergraduates at UNT who said they are
  going to vote
                 Sample
Which is which?
 A study of Latino freshmen at the Collin
 County Community College in terms of
  their intention to transfer to four-year
                institutions

• A survey of all Latino freshmen at the
  Collin County Community College with
  100% response rate
               Population
Population Research


   No Statistics Required


        Is that good or bad?
Probability – The Foundation
Key Elements in Probability
• Randomness – the
  lack of bias or
  manipulation
• Law of large
  numbers
• Central limit
  theorem (CLT)
Example for CLT
    Average Adult Male Height in the U.S.


   5’               5’9”               7’
Example for CLT
    Average Adult Male Height in the U.S.


        5’4”


   5’               5’9”               7’
Example for CLT
    Average Adult Male Height in the U.S.


                                  6’6”


   5’               5’9”               7’
Example for CLT
    Average Adult Male Height in the U.S.


                   5’10”


   5’               5’9”               7’
Example of CLT
    Sample       Height
      X1          5’4”
Example of CLT
    Sample       Height
      X1          5’4”
      X2          6’6”
Example of CLT
    Sample       Height
      X1          5’4”
      X2          6’6”
      X3         5”10’
Example of CLT
     Sample           Height
       X1              5’4”
       X2              6’6”
       X3              5”10’
 X4, X5,X6,…….,Xn   5’3”,6’9”…..
Average (X1-Xn)        5’9”
Example for CLT
Example for CLT
     Average Adult Male Height in the U.S.


 <20% 5’4”


    5’               5’9”               7’
What does p < .05 mean?
0.25


 0.2


0.15


 0.1


0.05


  0

       0   2   4   6   8   10   12   14   16   18   20
Null Hypothesis Significance
Testing (NHST)
• Originated from agricultural sciences
• Test the probability of null hypothesis
• If the probability for null hypothesis to
  happen is less than a certain value (p<.05
  or p<.01) we call it statistically significant
The Problems with NHST
• The size of p value does NOT indicate the
  strength of the relationship
• Statistical significant does NOT imply
  theoretical or practical significance
• Sample size has a great impact (if you
  have enough power, you will always
  reject null hypothesis)
• Does not work for population study
Solutions
• Reporting confidence interval (CI),
  standard errors, and effect sizes
• Discuss theoretical and practical
  importance using effect sizes
• Downgrade the importance of p value
Are they different
•   T-test
•   Analysis of Variance (ANOVA)
•   Chi Square
•   Wilcoxon signed-rank test
•   Cluster Analysis
•   Discriminant Function Analysis
What is the relationship
• Correlational Coefficients
  – Pearson's product-moment coefficient
  – Spearman's rank correlation coefficient
• Presumptions
  – Randomness
  – Linearity
What cause it to happen?
• Linear regression
• Multiple regression
  – Multiple linear regression
  – Logistic regression
  – Ordered logistic regression
  – Multinomial logit regression
What cause the whole thing to work
like that?
• Structural equation modeling
  – MANOVA, MANCOVA
  – Factor Analysis
  – Path Analysis
• Hierarchical linear modeling
• Repeated Measure
  – HLM growth model
  – Time series
  – GLM repeated measure
Common Mistakes
• Ignoring assumptions for a specific
  method
• Conducting multiple t-tests without
  Bonferroni correction
• Misusing Exploratory Factor Analysis
  (EFA)
• Inferring casual relationship in a
  correlational study
Other Mistakes
• Not reporting the quality measures of
  your instrument
• Ignoring the problems of missing data
• Ignoring the problems of self-selection
  bias
• Using statistical methods that you don’t
  really understand
Remember


Restate your research questions in
      your method chapter
Remember


   Someone should be able to
replicate your study by following
      your method chapter

Lecture 10.12.10

  • 1.
    Chapter 3 Research Method EDHE6530 Dr. Pu-Shih Daniel Chen
  • 2.
    Overview • Review our progress • Chapter 3 Research Methods • Break • How to review journal articles? • A quick review of quantitative research methods
  • 3.
  • 4.
    Chapter One • Introduction/problemstatement • Purpose of the study • Conceptual framework or theoretical orientation • Research questions and hypotheses • Definition of terms • Significance of the study • Limitations, delimitations, & assumptions
  • 5.
    Key to agood literature review • Always keep your research questions in mind • Critically analyze the literature • Integrate instead of summarize • Use primary sources • Distinguish between assertion and evidence
  • 6.
    Other tips • Don’tignore studies that differ from majority or personal bias • Read most recent ones first, oldest last • Read important landmark works • Use data-based, empirical studies • Opinion pieces and descriptive research helpful in introduction – set stage • Not a literary production- be clear and concise
  • 7.
    Basic Research • TheoryDriven • Discovery of knowledge
  • 8.
    Applied Research • IMMEDIATEpractical problem • ACTUAL problems in the field • Limited generalizability
  • 9.
    Research vs. Assessment Research Assessment • Generate knowledge that • Evaluate the progress or can be applied broadly results of a initiative or • Audience is not location- program bounded • Internally focused • Sample based • To improve the project or process • Population based
  • 10.
    Quantitative vs. Qualitative • Epistemology • Treatment of Theory • Role of the researcher(s) • Data collection and analysis • Quality controls • Report of findings • Types of studies • How to choose between the two methods
  • 11.
    Quantitative Methods • ExperimentalDesign • Casual-Comparative Design – Survey Research – Secondary Data Research • Descriptive Design
  • 12.
    Qualitative Methods • Ethnography • Case Study • Grounded Theory • Narrative Inquiry – Content Analysis
  • 13.
    Ideological Approaches • Researcher’srole – Interpreting the phenomenon through a particular perspective – Identifying marginalized or endangered people in society – To advocate • Challenging traditional views and usually controversial
  • 14.
    Mixed-Method • Philosophically tornbetween positivist and Phenomenology • Pragmatism comes to save the day • Focusing on “solving the problems” instead of philosophical arguments • Mixed-method is NOT half quantitative and half qualitative
  • 15.
    Discuss Your Research Questionsand Possible Method Selections
  • 16.
  • 17.
    Purpose of themethod chapter • Make your research transparent • Make it possible to other researchers to replicate your study • Make it possible for other researchers to judge the quality of your study
  • 18.
    Did you remember? Always keep your research questions in mind
  • 19.
    Four questions areaddressed • Who participated in the study? • Types of materials needed? • What data were collected and how? • How did you analyze the data?
  • 20.
    Participants/Sample • How werethey selected? – Random selection – Volunteers – Paid • From where are participants – Geographic region – Institutional affiliation
  • 21.
    Participants/Sample • Demographic characteristics – Age/age range – Gender – Ethnicity • Other information for replication
  • 22.
    Example of Participants Atotal of 50 participants will be selected from a population of 157 students enrolled in an Algebra I course at a large urban high school in Houston, TX. The population is tricultural, composed primarily of Caucasian non- Hispanic, African American, and Hispanic students from a variety of Latin American backgrounds. Moreover, 100% of students at this school are enrolled in the free or reduced price lunch program. Participants, comprised
  • 23.
    Example of Participants of54% female and 46% male, will be selected randomly through use of random numbers table (Ary, Jacobs, & Razavieh, 1996).
  • 24.
    Instrumentation • Describes “things”used • Sources of data – Test, questionnaire, interview…etc. – Archival sources • Why instruments selected • Quality of your instrument – Validity – Reliability
  • 25.
    Instrumentation • Who andhow administered? – How many items – How long to complete – How scored – Special condition • If new instrument developed – Why – Field test? – Include in entirety as table or appendix
  • 26.
    Example of Instrumentation TheStanford Achievement Test (SAT): Arithmetic Test (Level 7.0 – 9.9) will be utilized as the data gathering instrument. Split-half reliability coefficients are reported to range from .86 to .93 (Davies, 1994) and reviewers (Locus, 1995; Smythe, 1994) are in agreement concerning its high content validity. The SAT Arithmetic test is comprised of 45 multiple-choice items and requires approximately 35 minutes to complete.
  • 27.
    What is missingfrom the example? • Why instruments selected • How scored (what is the score range and distribution?)
  • 28.
    Procedures • What didresearchers/participants do? When? In what order were activities conducted? • If intervention or treatment given, describe in detail • Write in cookbook manner; step-by-step process • Remember – enough details for replication
  • 29.
    Example of Procedures Inthe fall of 1997, prior to the assignment of students to classes, a list of all students scheduled to enroll in General Math I in the fall (approximately 150) will be obtained from the principle of the school. Using this list, 50 students will be randomly selected through use of a random numbers table to participate in the study. These 50 students will then be randomly assigned to one of two General Math I classes, one class to receive
  • 30.
    Example of Procedures programmedinstruction and one class to receive lecture-discussion instruction. The random assignments to class type will also be performed through the use of a random numbers table. The programmed instruction class will utilize a computer program titled Herculette, published by the Programmers Institute of Technology School (1996), and used on IBM or IBM compatible computers with a Pentium 686 processor. In this program,
  • 31.
    Example of Procedures studentsare required to exhibit mastery learning on each lesson prior to making a transition to the next higher lesson in the math sequence. The lecture-discussion classroom teacher will present the same math concepts used in the Herculette program but through a lecture format instead of through use of a computer. Discussion will occur between the teacher and students when students ask questions about math concepts.
  • 32.
    Data Analysis • Describetechniques to analyze data – Quantitative studies – Statistics procedures • A brief description and explanation of the statistics you choose to use • The reason for choosing this statistical method – Qualitative studies – data summary, interpretation, and method of verification • Give as much details as possible • Remember triangulation – how you going to achieve that
  • 33.
    Example of DataAnalysis A statistical analysis will be used for comparing the achievement, on a test of reading comprehension, of two randomly formed groups of second grade students. An independent samples t-test will be used to determine whether the means of these two groups are statistically significantly different from one another. Should the data analysis provide a statistically significant result at the .05 level, then null hypothesis will be rejected.
  • 34.
    Example of DataAnalysis Should the statistical analysis not yield a statistically significant result at the .05 level, then the null hypothesis will not be rejected. For each comparison, an alpha level of .05 will be used for the level of statistical significance.
  • 35.
    Class Activities • Outlineyour Chapter 3 – Population/Sample/Participants – Instrumentation – Data collection methods – Data analysis
  • 36.
    A Quick Reviewof Quantitative Research Methods
  • 37.
    Statistics Methods forSocial Sciences • Major assumptions in statistics • Types of questions that can be answered – Are they different? – What is the relationship? – What cause it to happen? – What cause the whole thing to work like that?
  • 38.
    Population vs. Sample •Population is the entire group of individuals that we want information about • Sample is the part of the population that we actually examine in order to gather information
  • 39.
    Which is which? Astudy of political orientation of African American female registered voters under age 25 in the 2008 presidential election • All female African American undergraduates at UNT who said they are going to vote Sample
  • 40.
    Which is which? A study of Latino freshmen at the Collin County Community College in terms of their intention to transfer to four-year institutions • A survey of all Latino freshmen at the Collin County Community College with 100% response rate Population
  • 41.
    Population Research No Statistics Required Is that good or bad?
  • 42.
  • 43.
    Key Elements inProbability • Randomness – the lack of bias or manipulation • Law of large numbers • Central limit theorem (CLT)
  • 44.
    Example for CLT Average Adult Male Height in the U.S. 5’ 5’9” 7’
  • 45.
    Example for CLT Average Adult Male Height in the U.S. 5’4” 5’ 5’9” 7’
  • 46.
    Example for CLT Average Adult Male Height in the U.S. 6’6” 5’ 5’9” 7’
  • 47.
    Example for CLT Average Adult Male Height in the U.S. 5’10” 5’ 5’9” 7’
  • 48.
    Example of CLT Sample Height X1 5’4”
  • 49.
    Example of CLT Sample Height X1 5’4” X2 6’6”
  • 50.
    Example of CLT Sample Height X1 5’4” X2 6’6” X3 5”10’
  • 51.
    Example of CLT Sample Height X1 5’4” X2 6’6” X3 5”10’ X4, X5,X6,…….,Xn 5’3”,6’9”….. Average (X1-Xn) 5’9”
  • 52.
  • 53.
    Example for CLT Average Adult Male Height in the U.S. <20% 5’4” 5’ 5’9” 7’
  • 54.
    What does p< .05 mean? 0.25 0.2 0.15 0.1 0.05 0 0 2 4 6 8 10 12 14 16 18 20
  • 55.
    Null Hypothesis Significance Testing(NHST) • Originated from agricultural sciences • Test the probability of null hypothesis • If the probability for null hypothesis to happen is less than a certain value (p<.05 or p<.01) we call it statistically significant
  • 56.
    The Problems withNHST • The size of p value does NOT indicate the strength of the relationship • Statistical significant does NOT imply theoretical or practical significance • Sample size has a great impact (if you have enough power, you will always reject null hypothesis) • Does not work for population study
  • 57.
    Solutions • Reporting confidenceinterval (CI), standard errors, and effect sizes • Discuss theoretical and practical importance using effect sizes • Downgrade the importance of p value
  • 58.
    Are they different • T-test • Analysis of Variance (ANOVA) • Chi Square • Wilcoxon signed-rank test • Cluster Analysis • Discriminant Function Analysis
  • 59.
    What is therelationship • Correlational Coefficients – Pearson's product-moment coefficient – Spearman's rank correlation coefficient • Presumptions – Randomness – Linearity
  • 60.
    What cause itto happen? • Linear regression • Multiple regression – Multiple linear regression – Logistic regression – Ordered logistic regression – Multinomial logit regression
  • 61.
    What cause thewhole thing to work like that? • Structural equation modeling – MANOVA, MANCOVA – Factor Analysis – Path Analysis • Hierarchical linear modeling • Repeated Measure – HLM growth model – Time series – GLM repeated measure
  • 62.
    Common Mistakes • Ignoringassumptions for a specific method • Conducting multiple t-tests without Bonferroni correction • Misusing Exploratory Factor Analysis (EFA) • Inferring casual relationship in a correlational study
  • 63.
    Other Mistakes • Notreporting the quality measures of your instrument • Ignoring the problems of missing data • Ignoring the problems of self-selection bias • Using statistical methods that you don’t really understand
  • 64.
    Remember Restate your researchquestions in your method chapter
  • 65.
    Remember Someone should be able to replicate your study by following your method chapter