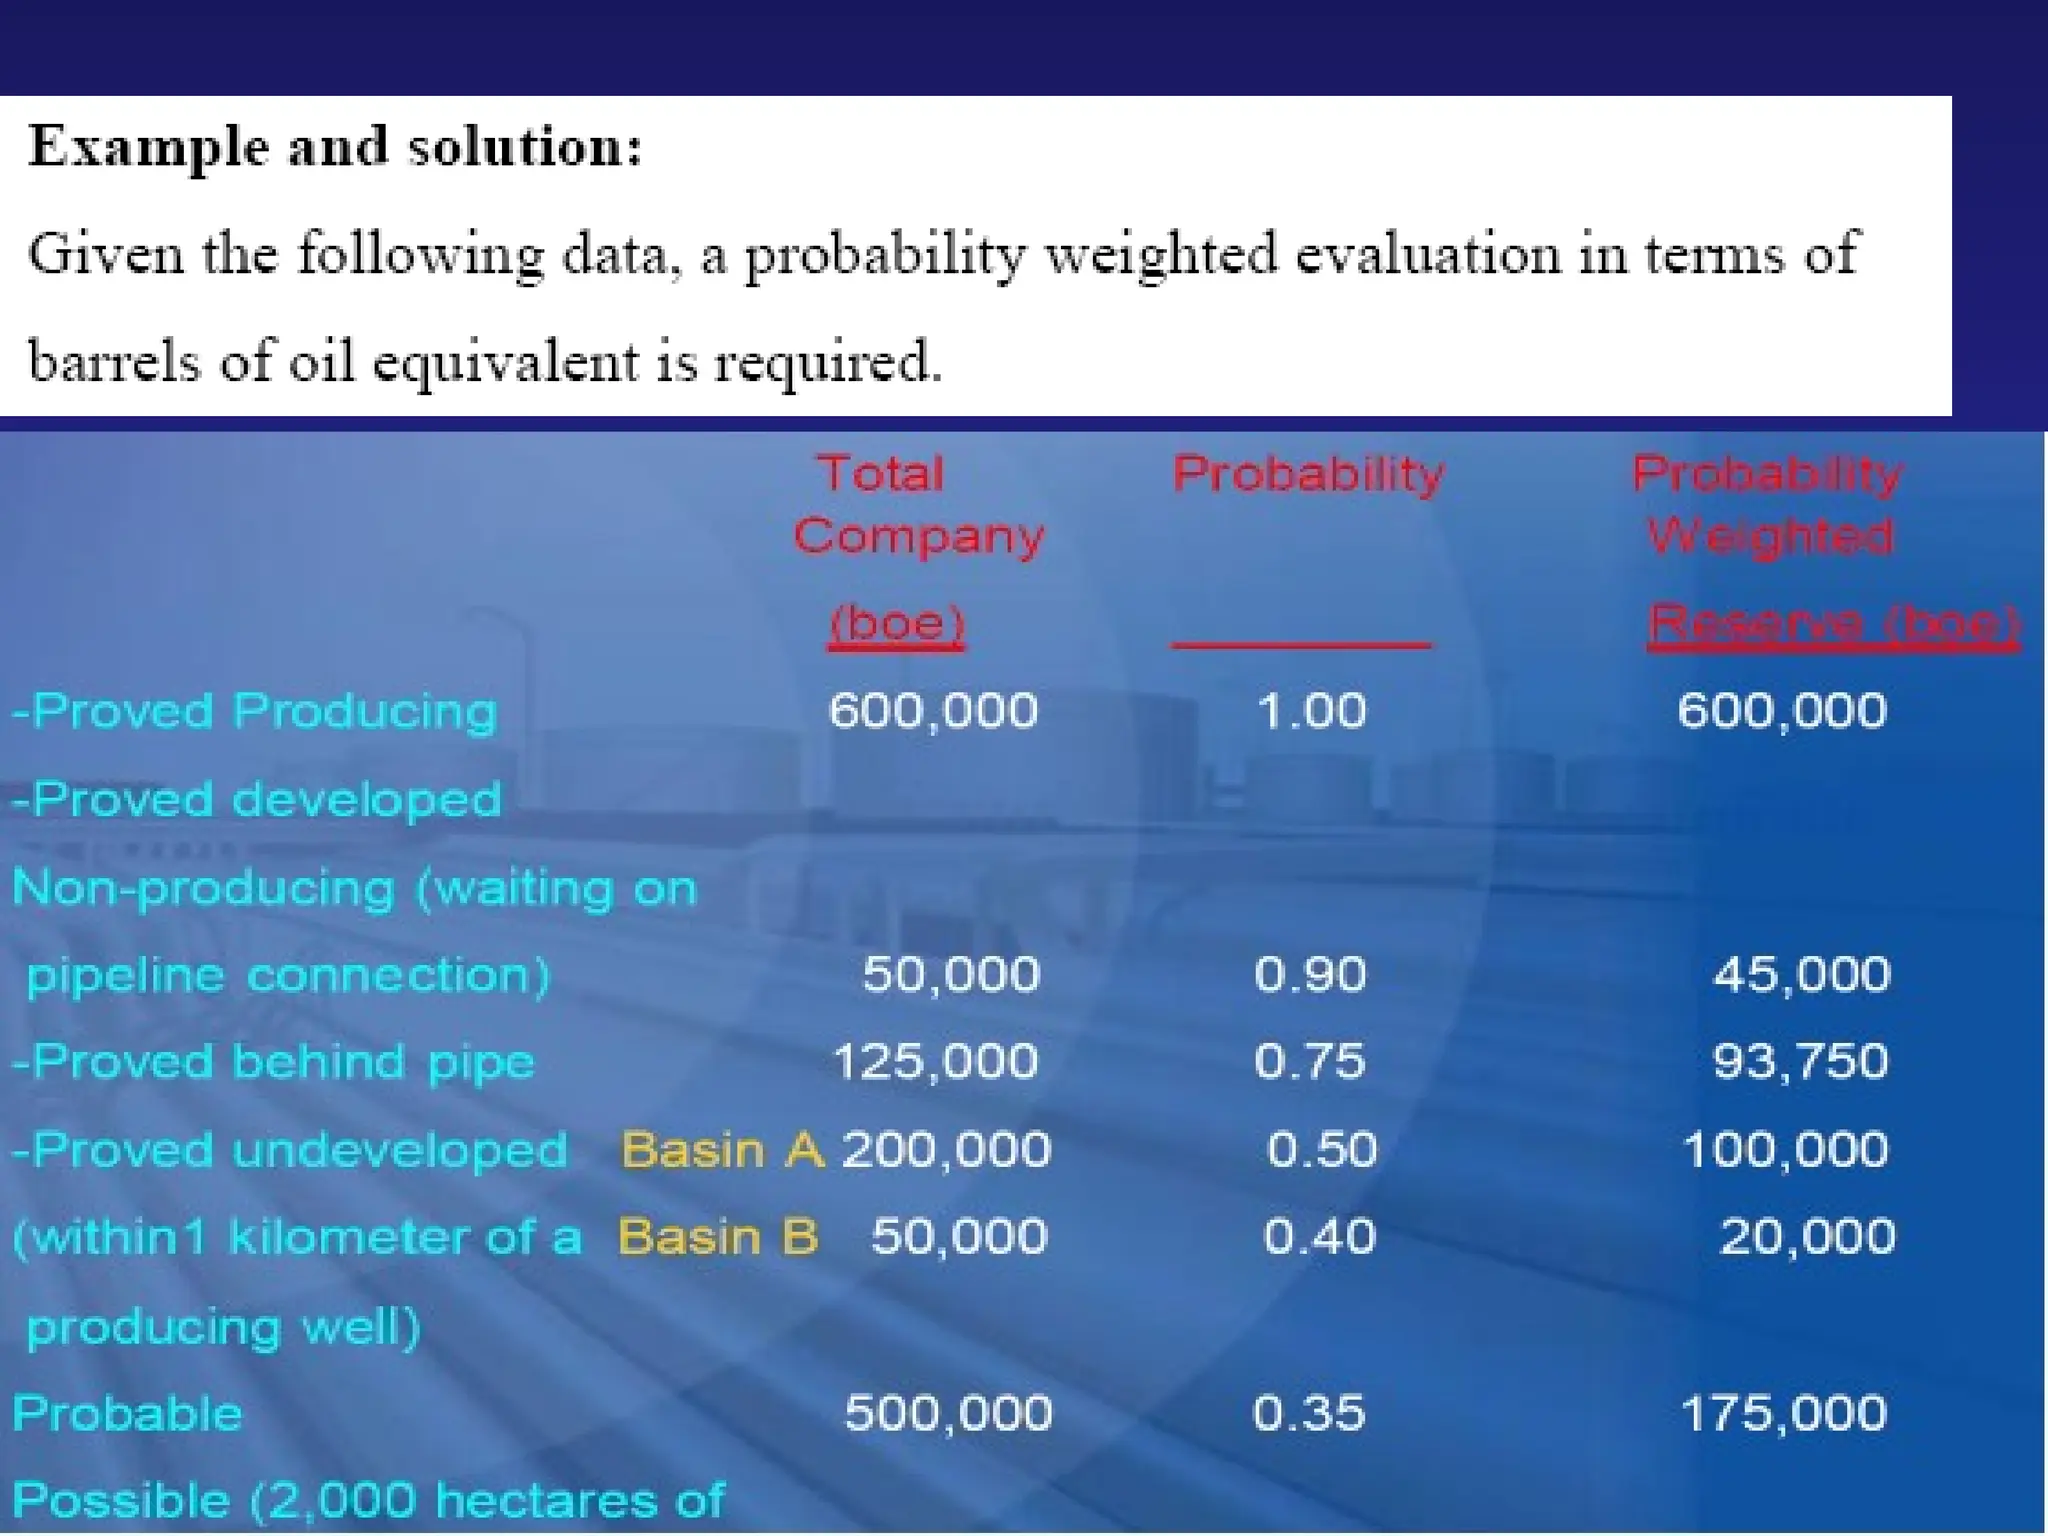
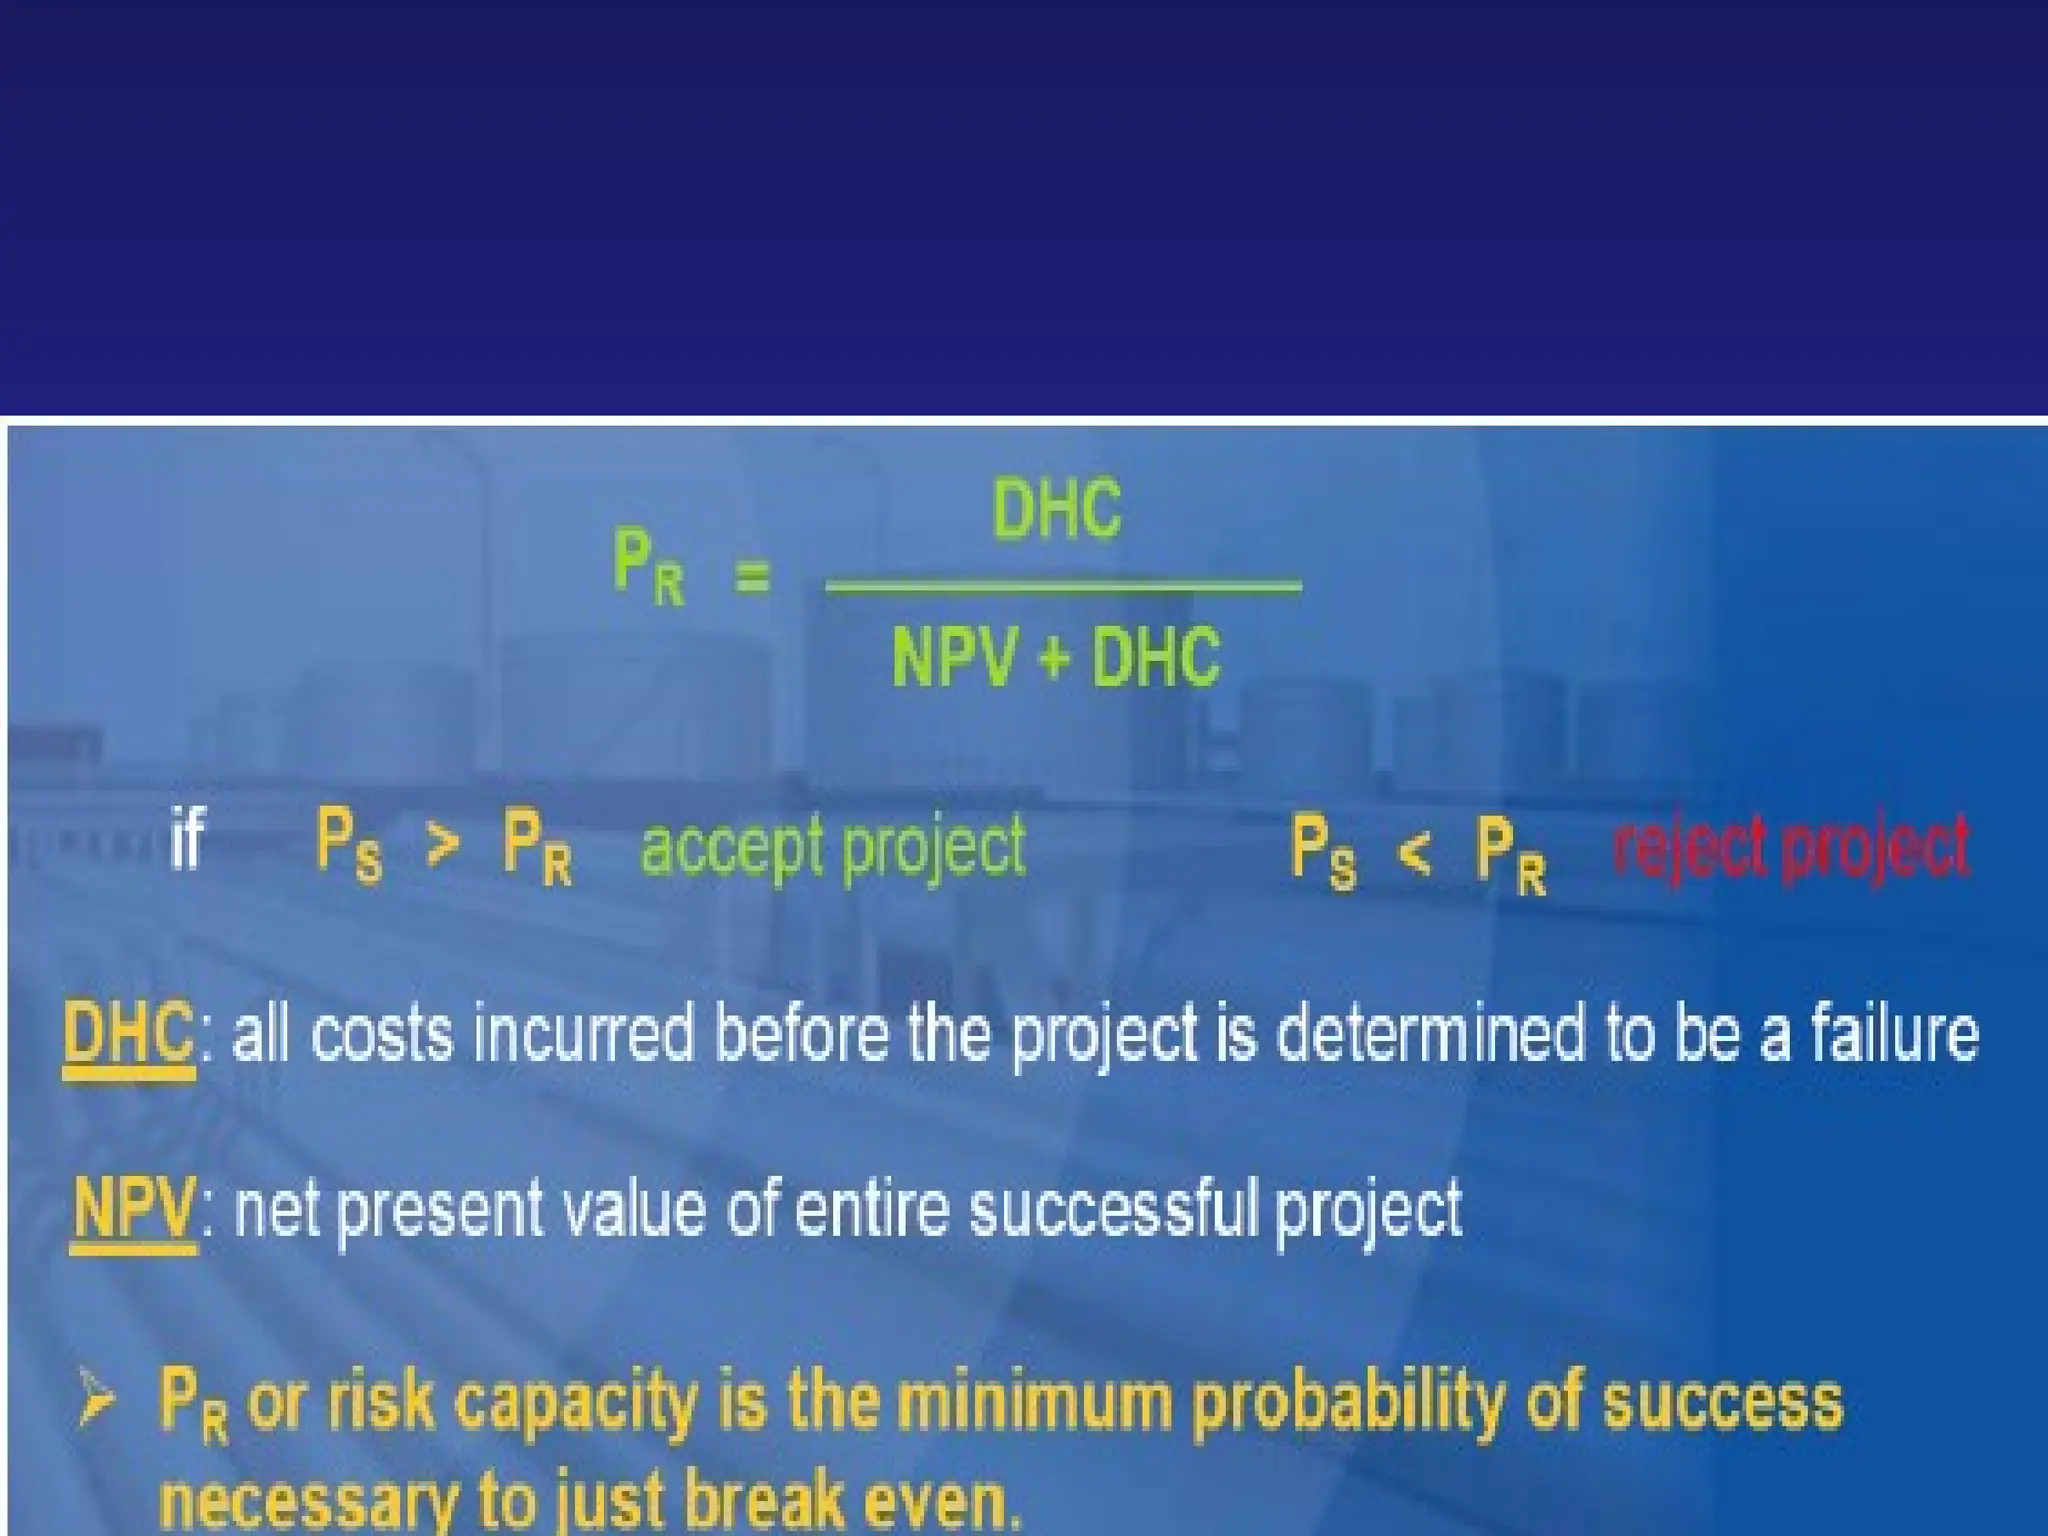
Oil & Gas Petroleum
Economics
Table of Contents
• Introduction to petroleum Projects
• Project economics
• Characteristics of petroleum Industry
• Risk and Uncertainty in Petroleum Industry
• Economic Analysis Procedure
• Crude oil characteristics
Table of Contents
• Crude oil price
• Crude Oil Bench markers
• Cost type ,Taxes and Royalties
• Reserves estimation
• Production forecasting using decline curve
analysis
• Solved examples
• Petroleum Projects economic Indicators
Table of Contents
• Petroleum Projects evaluation
• Solved examples
• Depreciation & Depletion
• Solved examples
• Decision Making
• Expected Minatory Value ( EMV)
Project
economics
•All oil industry projects have several
economically important issues and
charactrized by :
– Capital intensive,
– long project life time,
– Extreme uncertainty
Project economics
•Economic analysis is a decision
making tool which provides:
–An estimate of future cash flows,
–Assessment of profit or loss,
–Assessment of investiment risk
Project economics
• The main elements required for a cash
flow analysis are:
• expenditure estimates,
•capital expenditure (CAPEX)
•operational expenditure (OPEX),
– income estimates
Characteristics of petroleum
industry:
• Non renewable resource
• Long pre-production period between the
cost and revenue Uncertainty
• and high risk
* Geological risk * Engineering risk
* Economic risk * Political risk
Risk and Uncertainty in
Petroleum Industry
• ·Exploratory wells may or may not turn out to be
productive or economically feasible.
• An oil or gas field may not generate revenue as
expected.
• Future of oil and gas prices could move
unpredictably.
• ·Unforeseen events such as political unrest and
regional conflict
Elements of any economic
evaluation
• Elements of any economic evaluation
are:
• (1)Income
• (2)Expenditures
• (3)Time
Economic Analysis
Procedure
• 1. Setting economic objectives.
• 2. Formulating scenarios for project
development.
• 3. Identify elements of risk and uncertainty.
• 4. Collecting all available data used in
analysis.
• 5. Performing economic calculations.
• 6. Choose the optimum operation.
Economic Decision
Criteria
• · Payout period
• · Profit to investment ratio
• · Present worth net profit
• · Present worth index or profitability
index
• · Discounted cash flow return on
investment
Main elements in a
discounted cash-flow
model
• ·Cash – flow
• ·Profit
• ·Net Present Value
• ·Internal rate of Return
• ·Other decision criteria
• - Expected Monetary Value
• - Pay back time
• - Break even oil price
Crude Oil Classifications
and oil price
• 1- Due to its location of its origin
• ·West Texas Intermediate, WTI
• ·Brent
• ·Arabic Light
• 2-Dut to oil viscosity
• ·Light
• ·Intermediate
• ·Heavy
Crude Oil Classifications
and oil price
• 3- Due to sulfur content
• · Sweet (sulfur content < 0.5 % by
weight)
• · Sour (sulfur content > 0.5 % by
weight)
CRUDE OIL
Characteristics and the oil
price
• High API means high gasoline content
which indicates high price
• ·Sweet oil: oil has sulfur content lower than
0.5% by weight and has high price
• ·Sour oil: oil has sulfur content higher than
0.5% by weigh and has lower price
CAPEX
• Capital expenditure may include the
following:
– pipelines,
– offshore structures,
– well drilling programmes,
– data collection programmes,
– primary process facilities,
– onshore processing facilities,
– ...
OPEX
• Operational expenditure may include the
following:
– staff costs,
– daily energy requirements,
– transportation tariffs,
– in-fill drilling programmes,
– data acquisition,
– maintenance,
– facility upgrades,
Project incomes
•Income may include the following:
–oil sales,
–gas sales,
–pipeline tariffs,
–disposal of assets.
Inflation
• How prices are changing with respect to time
?
• normally quoted as an annual percentage rate
• different types of items have different
inflation rates
• positive rates imply rising prices
• negative rates imply falling prices
Simple compound
inflation
 n
R
I 
 1
100
I is the inflation index
R is the inflation rate per annum
n is the number of years
Year Inflation index
0 100.00
1 110.00
2 121.00
3 133.10
4 146.41
5 161.05
6 177.16
7 194.87
8 214.36
9 235.79
10 259.37
11 285.31
12 313.84
13 345.23
14 379.75
15 417.72
16 459.50
17 505.45
18 555.99
19 611.59
20 672.75
Inflation rate R
= 10%
What is time value of
money ?
• $100 will buy more today than in one year
time due to inflation
• If I invest $100 in a bank today, with an
interest rate of 10%, then in one year time it
will be $110
• So $100 today is worth more than $100 in one
year time (if inflation rate is positive)
Discount rates ÷ Discount
factors
• If you promise to pay me $100 in 5
years time, how much should I lend to
you ?
• How much is $100 in 5 years worth
today - what is its Present Value
Inflation - Interest in reverse
 
V
d
PV n


1
1
PV is the Present Value
d is the discount rate per annum
n is the number of years
V is the Value in n years
is known as the discount factor
 n
d

1
Present Value
Year Cash Flow d.f. PV of CF
$M 2% $M
0 -200.00 1.00 -200.00
1 -100.00 1.02 -98.04
2 60.00 1.04 57.67
3 250.00 1.06 235.58
4 252.51 1.08 233.28
5 255.03 1.10 230.99
6 257.58 1.13 228.72
7 231.82 1.15 201.82
8 174.40 1.17 148.85
9 130.40 1.20 109.11
10 97.80 1.22 80.23
11 73.36 1.24 59.00
12 55.01 1.27 43.38
13 41.26 1.29 31.90
14 30.95 1.32 23.46
15 23.21 1.35 17.25
16 17.42 1.37 12.69
17 13.06 1.40 9.33
18 9.80 1.43 6.86
19 7.35 1.46 5.05
20 5.51 1.49 3.71
-250.00
-200.00
-150.00
-100.00
-50.00
0.00
50.00
100.00
150.00
200.00
250.00
300.00
0 5 10 15 20 25
Years
PV
$M
 
V
d
PV n


1
1
Discount rate = 2%
Net present value
-400.00
-200.00
0.00
200.00
400.00
600.00
800.00
1000.00
1200.00
1400.00
1600.00
0 5 10 15 20 25
Years
NPV
$M
• The NPV is the most commonly used
method to assign a present worth, in
todays money, for a project that will
yield profits (and losses) in future years



m
i
i
PV
NPV
0
Optimum abandonment
year
-600.00
-400.00
-200.00
0.00
200.00
400.00
600.00
800.00
1000.00
1200.00
0 5 10 15 20 25
Years
N
PV
$M
Year Cum. PV PV of Aban. NPV
$M $M $M
0 -200.00 -25.00 -225.00
1 -298.04 -26.96 -325.00
2 -240.37 -110.49 -350.85
3 -4.78 -122.72 -127.50
4 228.50 -136.32 92.17
5 459.49 -151.42 308.06
6 688.21 -168.20 520.01
7 890.02 -152.68 737.34
8 1038.87 -169.60 869.28
9 1147.99 -188.38 959.61
10 1228.22 -209.30 1018.92
11 1287.22 -232.43 1054.78
12 1330.59 -321.70 1008.90
13 1362.49 -357.33 1005.15
14 1385.95 -396.92 989.02
15 1403.19 -440.90 962.30
16 1415.88 -489.74 926.14
17 1425.21 -544.00 881.21
18 1432.07 -604.27 827.80
19 1437.12 -671.21 765.90
20 1440.82 -745.57 695.25
The adandonment year is
selected by finding the
year that maximise the
NPV
Optimum
Other economic measures
• Net Value
• Pay Back Time
• Accounting rate of return
• Profit investiment ratio
• Present value profit ratio
• Growth rate of return
• Internal rate of return
Economic Yardsticks
• Measures that do not consider the time value of money
• Profit
• Payout time
• Cost to find and develop reserves
• Measures that do consider the time value of money
• Net Present Value
• Rate of Return
• Discounted Profit to Investment Ratio
• Profit
• Net cash flow = Revenue – expenses
Economic Yardsticks
• Expenses = initial investment + operating cost + taxes
• Net cash flow = profit
• Payout time
• Time from investment to positive cumulative
net cash flow
Economic Yardsticks
Solved Example:
• A refinery inNorth Africa is shut in after it can no
longer flow naturally. After several years a
recompletion is proposed at a cost of US$750,000.
The recompletion includes a fracture stimulation
and installation of gas lift. We estimate that the
well can be successfully returned to production
with a predicted production stream as given on
the following table.
• Calculate the total profit, payout time, and cost
to find and develop reserves.
Solved Example:
Solved Example:
Solved Example:
Time Value of Money
Time Value of Money
Profitability Index
Which Yardstick To Use
Economic Optimization
Second Solved Example
Third Solved Example
Depreciation
Depreciation Methods
• 1- Straight line Method
• 2-Decline Method
• 3-Double Decline Method
• 4- Sum-of-the-Year Method
• 5- Sinking Fund Method
Project Risk & Uncertainty
• Certainty: Only one possible outcome
• Uncertainty: Recognition that more than a
singly outcome is possible
• Risk: Possibility of incurring economic loss
• High Risk: Possibility of incurring a large loss
• Outcome: One of the possible events that can
take place
Project Risk & Uncertainty
• Probability: Chance between 0% and 100%
that an outcome will occur
• Types of Risk
• · Technical Risk
• · Economic Risk
• · Political Risk
Project Risk & Uncertainty
Decision Tree
Decision Tree
Decision Tree
Decision Tree
Lecture 1 petroleum economics lectures.ppt

Lecture 1 petroleum economics lectures.ppt

  • 1.
    Oil & GasPetroleum Economics
  • 2.
    Table of Contents •Introduction to petroleum Projects • Project economics • Characteristics of petroleum Industry • Risk and Uncertainty in Petroleum Industry • Economic Analysis Procedure • Crude oil characteristics
  • 3.
    Table of Contents •Crude oil price • Crude Oil Bench markers • Cost type ,Taxes and Royalties • Reserves estimation • Production forecasting using decline curve analysis • Solved examples • Petroleum Projects economic Indicators
  • 4.
    Table of Contents •Petroleum Projects evaluation • Solved examples • Depreciation & Depletion • Solved examples • Decision Making • Expected Minatory Value ( EMV)
  • 5.
    Project economics •All oil industryprojects have several economically important issues and charactrized by : – Capital intensive, – long project life time, – Extreme uncertainty
  • 6.
    Project economics •Economic analysisis a decision making tool which provides: –An estimate of future cash flows, –Assessment of profit or loss, –Assessment of investiment risk
  • 7.
    Project economics • Themain elements required for a cash flow analysis are: • expenditure estimates, •capital expenditure (CAPEX) •operational expenditure (OPEX), – income estimates
  • 8.
    Characteristics of petroleum industry: •Non renewable resource • Long pre-production period between the cost and revenue Uncertainty • and high risk * Geological risk * Engineering risk * Economic risk * Political risk
  • 9.
    Risk and Uncertaintyin Petroleum Industry • ·Exploratory wells may or may not turn out to be productive or economically feasible. • An oil or gas field may not generate revenue as expected. • Future of oil and gas prices could move unpredictably. • ·Unforeseen events such as political unrest and regional conflict
  • 10.
    Elements of anyeconomic evaluation • Elements of any economic evaluation are: • (1)Income • (2)Expenditures • (3)Time
  • 11.
    Economic Analysis Procedure • 1.Setting economic objectives. • 2. Formulating scenarios for project development. • 3. Identify elements of risk and uncertainty. • 4. Collecting all available data used in analysis. • 5. Performing economic calculations. • 6. Choose the optimum operation.
  • 12.
    Economic Decision Criteria • ·Payout period • · Profit to investment ratio • · Present worth net profit • · Present worth index or profitability index • · Discounted cash flow return on investment
  • 13.
    Main elements ina discounted cash-flow model • ·Cash – flow • ·Profit • ·Net Present Value • ·Internal rate of Return • ·Other decision criteria • - Expected Monetary Value • - Pay back time • - Break even oil price
  • 14.
    Crude Oil Classifications andoil price • 1- Due to its location of its origin • ·West Texas Intermediate, WTI • ·Brent • ·Arabic Light • 2-Dut to oil viscosity • ·Light • ·Intermediate • ·Heavy
  • 15.
    Crude Oil Classifications andoil price • 3- Due to sulfur content • · Sweet (sulfur content < 0.5 % by weight) • · Sour (sulfur content > 0.5 % by weight)
  • 16.
    CRUDE OIL Characteristics andthe oil price • High API means high gasoline content which indicates high price • ·Sweet oil: oil has sulfur content lower than 0.5% by weight and has high price • ·Sour oil: oil has sulfur content higher than 0.5% by weigh and has lower price
  • 22.
    CAPEX • Capital expendituremay include the following: – pipelines, – offshore structures, – well drilling programmes, – data collection programmes, – primary process facilities, – onshore processing facilities, – ...
  • 23.
    OPEX • Operational expendituremay include the following: – staff costs, – daily energy requirements, – transportation tariffs, – in-fill drilling programmes, – data acquisition, – maintenance, – facility upgrades,
  • 24.
    Project incomes •Income mayinclude the following: –oil sales, –gas sales, –pipeline tariffs, –disposal of assets.
  • 25.
    Inflation • How pricesare changing with respect to time ? • normally quoted as an annual percentage rate • different types of items have different inflation rates • positive rates imply rising prices • negative rates imply falling prices
  • 26.
    Simple compound inflation  n R I  1 100 I is the inflation index R is the inflation rate per annum n is the number of years Year Inflation index 0 100.00 1 110.00 2 121.00 3 133.10 4 146.41 5 161.05 6 177.16 7 194.87 8 214.36 9 235.79 10 259.37 11 285.31 12 313.84 13 345.23 14 379.75 15 417.72 16 459.50 17 505.45 18 555.99 19 611.59 20 672.75 Inflation rate R = 10%
  • 27.
    What is timevalue of money ? • $100 will buy more today than in one year time due to inflation • If I invest $100 in a bank today, with an interest rate of 10%, then in one year time it will be $110 • So $100 today is worth more than $100 in one year time (if inflation rate is positive)
  • 28.
    Discount rates ÷Discount factors • If you promise to pay me $100 in 5 years time, how much should I lend to you ? • How much is $100 in 5 years worth today - what is its Present Value
  • 29.
    Inflation - Interestin reverse   V d PV n   1 1 PV is the Present Value d is the discount rate per annum n is the number of years V is the Value in n years is known as the discount factor  n d  1
  • 30.
    Present Value Year CashFlow d.f. PV of CF $M 2% $M 0 -200.00 1.00 -200.00 1 -100.00 1.02 -98.04 2 60.00 1.04 57.67 3 250.00 1.06 235.58 4 252.51 1.08 233.28 5 255.03 1.10 230.99 6 257.58 1.13 228.72 7 231.82 1.15 201.82 8 174.40 1.17 148.85 9 130.40 1.20 109.11 10 97.80 1.22 80.23 11 73.36 1.24 59.00 12 55.01 1.27 43.38 13 41.26 1.29 31.90 14 30.95 1.32 23.46 15 23.21 1.35 17.25 16 17.42 1.37 12.69 17 13.06 1.40 9.33 18 9.80 1.43 6.86 19 7.35 1.46 5.05 20 5.51 1.49 3.71 -250.00 -200.00 -150.00 -100.00 -50.00 0.00 50.00 100.00 150.00 200.00 250.00 300.00 0 5 10 15 20 25 Years PV $M   V d PV n   1 1 Discount rate = 2%
  • 31.
    Net present value -400.00 -200.00 0.00 200.00 400.00 600.00 800.00 1000.00 1200.00 1400.00 1600.00 05 10 15 20 25 Years NPV $M • The NPV is the most commonly used method to assign a present worth, in todays money, for a project that will yield profits (and losses) in future years    m i i PV NPV 0
  • 32.
    Optimum abandonment year -600.00 -400.00 -200.00 0.00 200.00 400.00 600.00 800.00 1000.00 1200.00 0 510 15 20 25 Years N PV $M Year Cum. PV PV of Aban. NPV $M $M $M 0 -200.00 -25.00 -225.00 1 -298.04 -26.96 -325.00 2 -240.37 -110.49 -350.85 3 -4.78 -122.72 -127.50 4 228.50 -136.32 92.17 5 459.49 -151.42 308.06 6 688.21 -168.20 520.01 7 890.02 -152.68 737.34 8 1038.87 -169.60 869.28 9 1147.99 -188.38 959.61 10 1228.22 -209.30 1018.92 11 1287.22 -232.43 1054.78 12 1330.59 -321.70 1008.90 13 1362.49 -357.33 1005.15 14 1385.95 -396.92 989.02 15 1403.19 -440.90 962.30 16 1415.88 -489.74 926.14 17 1425.21 -544.00 881.21 18 1432.07 -604.27 827.80 19 1437.12 -671.21 765.90 20 1440.82 -745.57 695.25 The adandonment year is selected by finding the year that maximise the NPV Optimum
  • 33.
    Other economic measures •Net Value • Pay Back Time • Accounting rate of return • Profit investiment ratio • Present value profit ratio • Growth rate of return • Internal rate of return
  • 34.
    Economic Yardsticks • Measuresthat do not consider the time value of money • Profit • Payout time • Cost to find and develop reserves • Measures that do consider the time value of money • Net Present Value • Rate of Return • Discounted Profit to Investment Ratio • Profit • Net cash flow = Revenue – expenses
  • 35.
    Economic Yardsticks • Expenses= initial investment + operating cost + taxes • Net cash flow = profit • Payout time • Time from investment to positive cumulative net cash flow
  • 36.
  • 37.
    Solved Example: • Arefinery inNorth Africa is shut in after it can no longer flow naturally. After several years a recompletion is proposed at a cost of US$750,000. The recompletion includes a fracture stimulation and installation of gas lift. We estimate that the well can be successfully returned to production with a predicted production stream as given on the following table. • Calculate the total profit, payout time, and cost to find and develop reserves.
  • 38.
  • 39.
  • 40.
  • 41.
  • 43.
  • 44.
  • 45.
  • 46.
  • 47.
  • 48.
  • 49.
  • 50.
  • 51.
  • 52.
  • 53.
  • 54.
  • 55.
    Depreciation Methods • 1-Straight line Method • 2-Decline Method • 3-Double Decline Method • 4- Sum-of-the-Year Method • 5- Sinking Fund Method
  • 56.
    Project Risk &Uncertainty • Certainty: Only one possible outcome • Uncertainty: Recognition that more than a singly outcome is possible • Risk: Possibility of incurring economic loss • High Risk: Possibility of incurring a large loss • Outcome: One of the possible events that can take place
  • 57.
    Project Risk &Uncertainty • Probability: Chance between 0% and 100% that an outcome will occur • Types of Risk • · Technical Risk • · Economic Risk • · Political Risk
  • 58.
    Project Risk &Uncertainty
  • 59.
    Project Risk &Uncertainty
  • 60.
    Project Risk &Uncertainty
  • 61.
  • 62.
  • 63.
  • 64.