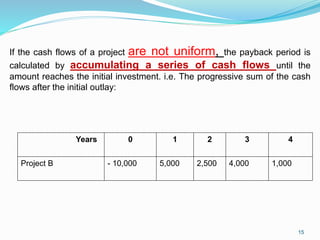
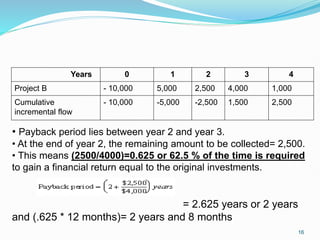
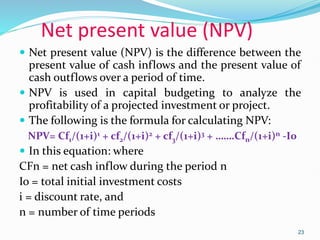
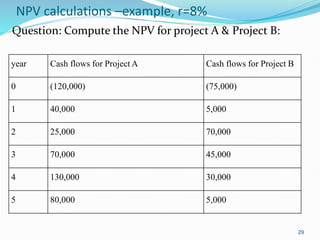
Okay, here are the NPV calculations for Projects A and B with a discount rate of 8%:
Project A:
CF0 = -120,000
CF1 = 40,000 / (1.08) = 37,037
CF2 = 25,000 / (1.08)2 = 22,222
CF3 = 70,000 / (1.08)3 = 58,333
CF4 = 130,000 / (1.08)4 = 108,333
CF5 = 80,000 / (1.08)5 = 66,667
NPV = -120,000 + 37,037 + 22,222 + 58,333 + 108,333 + 66


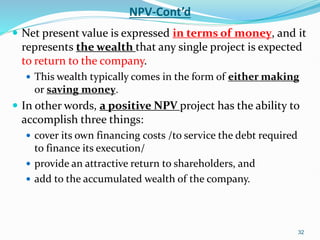
![NPV-cont’d
where regular cash flows are expected [these are
termed as annuities], the above expression can be
reduced to:
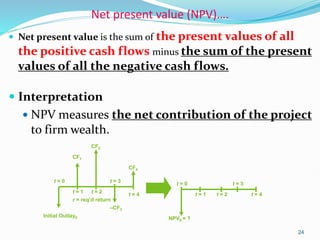
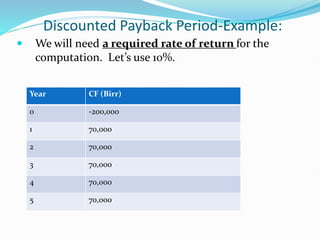
Take-home Exercise: Compute the NPV for the
following three project alternatives at 3%, 5% & 8%
discount rates.
31
Projects X Y Z
Costs ($)-Initial investment 10,380 10,380 10,380
Project life span (years) 5 15 25
Annual Benefits ($) 2,397 1,000 736](https://image.slidesharecdn.com/fmch6capitalbudgeting-231117182846-2fa18c4a/85/FM-Ch6-Capital-Budgeting-pptx-31-320.jpg)
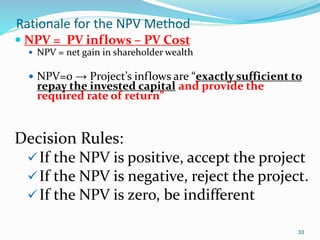
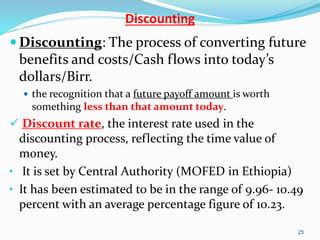
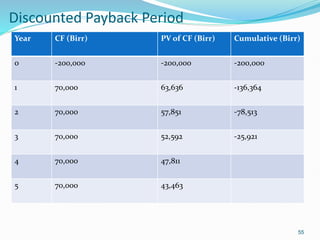
![Disadvantages of NPV
• If the investments are different, deciding the desirability of the project
based on the NPV will be misleading.
We have learnt that NPV tells us ‘how much birr is the net result of the project’ but
it does not tell us if this amount is the outcome of a big effort or a small one.
Example:
For Project A:
NPV= 10; {B-C=110-100=10]
Big differences in investment amount
For Project B:
NPV=15; [10,015-10,000=15]
• The cost of capital is assumed to remain constant throughout the life of
the project.
35](https://image.slidesharecdn.com/fmch6capitalbudgeting-231117182846-2fa18c4a/85/FM-Ch6-Capital-Budgeting-pptx-35-320.jpg)


![5) capital_budgeting_(1)_-(2)[1].ppt.pdf](https://cdn.slidesharecdn.com/ss_thumbnails/5capitalbudgeting121-250323135834-146732f6-thumbnail.jpg?width=640&height=640&fit=bounds)


