Download as PDF, PPTX
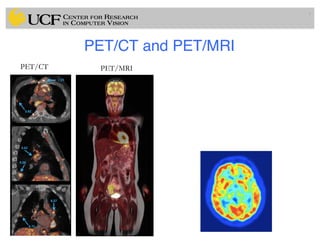
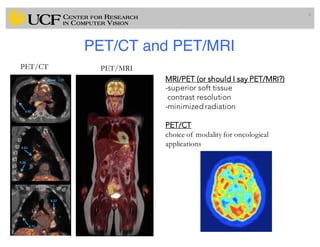
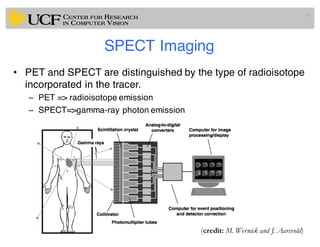
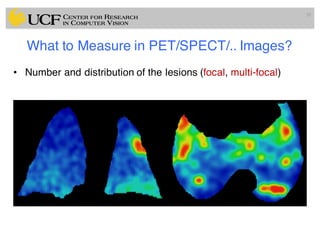
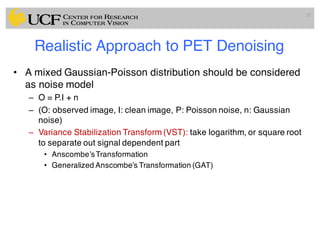
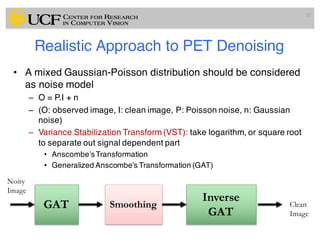
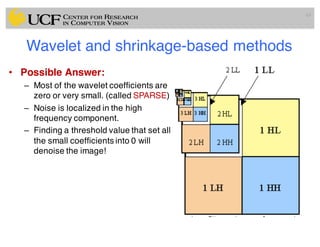
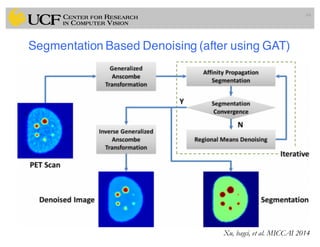
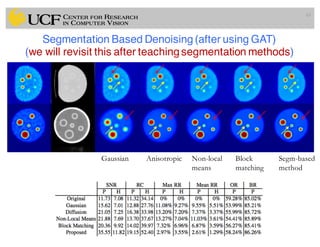
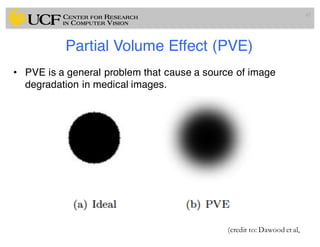
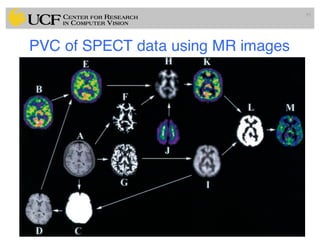
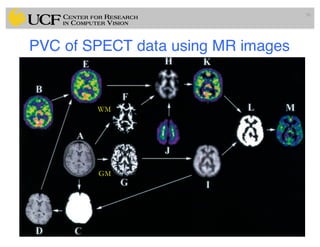

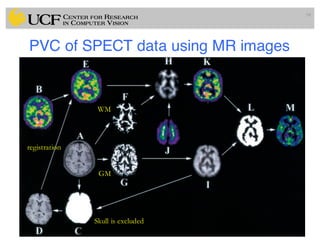

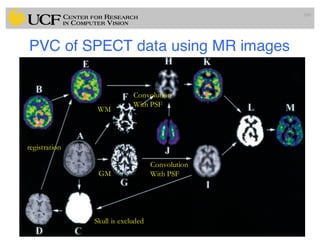

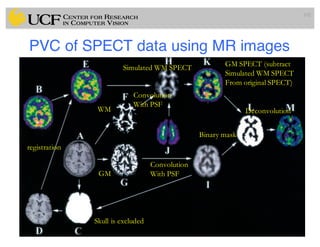
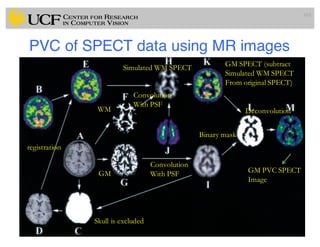

The document outlines a lecture on medical image computing with a focus on pre-processing techniques for nuclear medicine images, particularly involving PET, SPECT, and MRI modalities. It discusses various aspects such as the measurement of standardized uptake values, denoising techniques, and partial volume correction to enhance image quality and accuracy in diagnosing tumors. The lecture includes insights into noise models, imaging modalities, and specific metrics used in the evaluation of nuclear medicine images.