Downloaded 221 times


![1. Introduction
During the past few decades, there have been dra-
matic changes in the field of radiotherapy (Thwaites
and Malicki, 2011). These changes include significant
developments in imaging, computer technology,
treatment planning, and treatment-delivery technol-
ogy, and also in understanding the nature of malig-
nant disease and the effects of radiation on both
malignant and normal tissue (Leer, 2011; Overgaard,
2011; Rodemann and Wouters, 2011; Thwaites and
Malicki, 2011). Due to these developments and the in-
creasing incidence and significance of cancer world-
wide (Cavalli, 2006; IAEA, 2013), radiation oncology
has become one of the major disciplines in modern
medical care and research.
Modern oncology includes a large variety of special-
ties both in research and in clinical medicine, ranging
from prevention to diagnostic and therapeutic proce-
dures. Surgical, radiation, and medical oncology are
the major therapeutic strategies, and—because of the
necessary sub-specialization of expertise—multidis-
ciplinary approaches have become the standard in re-
search, education, and patient care (Croke and
El-Sayed, 2012; Kesson et al., 2012; Po¨tter et al., 2012;
Reade and Elit, 2012). Major progress in the field is
leading to increasingly patient-specific treatment
approaches tailored to the individual patient risk,
based on tumor stage, histology, prognostic factors,
and response to treatment (Reade and Elit, 2012).
Cure rates have increased significantly in many onco-
logical fields, initially most notably for pediatric and
hematological malignancies (O’Leary et al., 2008;
Pritchard-Jones et al., 2006), but increasingly also for
solid tumors (Ferlay et al., 2007; Kesson et al., 2012).
The reasons for such improvements are multifold, in-
cluding the introduction of more tailored multimodal-
ity treatments. The combination of radiotherapy with
cytotoxic chemotherapy or hormonal therapy has, for
example, become standard particularly for advanced
high-risk disease for various malignancies such as
breast (Goldhirsch et al., 2009), rectum (Valentini
et al., 2009), prostate (Mottet et al., 2011), and cervical
cancers (Eifel, 2006; Thomas, 1999), with new
approaches in combined targeted therapies and im-
munotherapies as major future pathways (Specenier
and Vermorken, 2013). Long-term treatment-related
morbidity and quality of life have consequently
become major concerns in the increasing population
of cancer survivors (Heirs et al., 2012; McCabe and
Jacobs, 2012). In parallel, palliative medicine, includ-
ing radiotherapy, has improved and is playing an in-
creasing role in relief of symptoms, and its role is
increasingly emphasized in research and education.
1.1 Developments in Epidemiology and
Treatment of Cervical Cancer
Cervical cancer had the highest incidence among
female cancers in high-income countries in the first
half of the last century [Annual Reports of the
International Federation of Gynecology and Obstetrics
(FIGO)] (Boyle et al., 2003; Denny, 2012; Pecorelli,
2009; Pettersson and Benedet, 1998; Quinn et al.,
2006). Cervical cancer remains frequent, about
500 000 new cases per year worldwide (Jemal et al.,
2012, Parkin et al., 2005), even increasing in numbers
(Forouzanfar et al., 2011), particularly in developing
countries. Cervical cancer incidence will further in-
crease in countries lacking systematic vaccination and
screening programs (Jemal et al., 2011; Sherris et al.,
2001).
In the developed world, there has been a dramatic
shift in the initial presentation of cervical cancer due to
the widespread implementation of cytological screening
that began about 50 years ago and is now further
expanded to include human-papilloma-virus-based
DNA testing (Cuzick, 2010; Cuzick et al., 2008).
Screening has led to a dramatic decrease in cervical
cancer mortality (Cuzick et al., 2008). This progress in
screening coupled with advances in therapy has
divided the “world of cervix cancer” into two groups of
countries:
† Countries in South-Central–Eastern Asia, Eastern/
Western/South/Middle Africa, South and Central
America, and Central/Eastern Europe that have
limited resources and a high incidence/mortality of
cervical cancer per 100 000 women-years: 15/6
Central and Eastern Europe, 25/15 in South-Central
Asia, 24/11 South and Central America, 34/25
Eastern/Western Africa (Jemal et al., 2011; Sherris
Journal of the ICRU Vol 13 No 1–2 (2013) Report 89 doi:10.1093/jicru/ndw003
Oxford University Press
# International Commission on Radiation Units and Measurements 2016
atUniversityofCalifornia,IrvineonSeptember9,2016http://jicru.oxfordjournals.org/Downloadedfrom](https://image.slidesharecdn.com/icru891-190321105446/85/Icru-89-23-320.jpg)
![(fMRI). State-of-the-art imaging such as MRI and CT
are being increasingly introduced in the diagnosis and
treatment of cervical cancer, particularly in the wealth-
ier countries. Ultrasound imaging has played a limited
role, although its potential is significant particularly
for applicator placement. Despite the above advances,
the majority of patients worldwide still undergo treat-
ments based mainly on FIGO staging determined from
clinical examination with or without anatomical draw-
ings and radiographic images.
An overview of the various modalities used for cer-
vical cancer imaging is outlined in Section 4 with
particular emphasis on their use in the planning of
brachytherapy.
1.2.4 Tumor and Target Volumes and
Adaptive Radiotherapy
Brachytherapy in cancer of the uterine cervix can
be adaptive and provide better dose conformation if
the tumor/target can be precisely assessed and deli-
neated in three dimensions, taking into account the
tumor-growth pattern, change during the course of
radio-chemotherapy, and the topography of the adja-
cent OAR. At the time of publication of ICRU Report
38 (ICRU, 1985), treatment planning for cervical
cancer was based on gynecologic examination at diag-
nosis and radiography without the benefit of time-
dependent volumetric imaging. The target approach
was recommended, referring to the clinical tumor
presentation at diagnosis. Reporting the maximum
width, thickness, and height of the 60 Gy reference
volume covering this target was recommended. It is
now well documented that major shrinkage of the
initial gross tumor volume (GTV) and variation of
topography occurs regularly during treatment, which
typically begins with EBRT and simultaneous chemo-
therapy, leaving various amounts of residual GTV at
the time of brachytherapy.
To allow adaptations of the treatment, repetitive
gynecologic examinations and imaging are essential
to determine tumor width, thickness, and height as
a function of time.
The adaptive approach described in Section 5 forms
the thrust of the current report. For the boost treat-
ment of the tumor, a special CTV-T terminology is used
and specifically defined for the time of brachytherapy
after initial radio-chemotherapy. The high-risk CTV-T
(CTV-THR), an adaptive CTV-T,1
includes the residual
tumor, the cervix, and residual adjacent pathologic
tissue. A second CTV, the intermediate-risk CTV-T
(CTV-TIR), includes the initial tumor extent and the
CTV-THR with a margin. The area of potential
microscopic tumor spread is called the low-risk tumor-
related CTV-T (CTV-TLR). The general concepts, terms,
and definitions enunciated in the series of recent ICRU
reports on prescribing, recording, and reporting differ-
ent radiotherapy (ICRU, 1993a; 2000; 2004; 2007;
2010) are integrated into the present report, which
unlike these previous reports deals with a specific
disease site. The GEC ESTRO Recommendations
(Haie-Meder et al., 2005), generally accepted world-
wide, form the basis of this adaptive strategy.
Some attention is paid also to the use of the plan-
ning target volume (PTV), which plays a major role
in planning and delivering EBRT. However, specific
considerations have to be taken into account for
brachytherapy due to the inherent absorbed-dose-
distribution characteristics, with large absorbed-dose
inhomogeneities throughout the target volume and
steep absorbed-dose gradients adjacent to the target
surface. Therefore, PTV margins have to be utilized
with great care in intracavitary brachytherapy. Due
to very limited target movement in relation to the
position of the applicator, margins for compensation
of geometric uncertainties play a minor role. Addition
of margins in the orthogonal direction should be
avoided as they would lead to a considerable absorbed-
dose increase in the whole volume.
1.2.5 OAR- and Morbidity-Related Concepts
and Volumes
Section 6 introduces radiotherapy-related morbid-
ity endpoints and (sub-)volumes of OARs based on
the typical morbidity profiles as known from clinical
experience in cervical cancer radiotherapy. Certain
targets in the OAR are selected that correspond to
typical pathology and morbidity patterns (e.g., tel-
angiectasia/bleeding). Small absolute volumes (2,
0.1 cm3
) are defined corresponding to typical
brachytherapy-related morbidities such as telangec-
tasia and ulceration/fistula. These reference
volumes might have different locations in the OARs
depending on the application technique. The loca-
tion of such volumes within a given organ can be
specified through anatomically defined points in
OARs [e.g., ICRU bladder point on the bladder floor
(bladder balloon), vaginal points (bony reference)].
Larger volumes are of interest for morbidity such as
stenosis or organ shrinkage that are due to signifi-
cant radiation dose to the whole circumference and/
or a significant length of a hollow organ (e.g., cir-
cumference in the upper vagina; length for the mid/
lower vagina).
Position variations and uncertainties due to in-
ternal motion are observed for OARs (e.g., bowel)
and should be assessed through repetitive imaging
and corrections applied as appropriate. For organs
1
For simplification, in this Report, CTV refers to CTV-T if not
otherwise stated.
Introduction
9
atUniversityofCalifornia,IrvineonSeptember9,2016http://jicru.oxfordjournals.org/Downloadedfrom](https://image.slidesharecdn.com/icru891-190321105446/85/Icru-89-25-320.jpg)


![radiotherapy significantly decreases the recurrence
rate (Viswanathan et al., 2006a). Even though the
FIGO stage does not take into account nodal status,
FIGO staging has been identified as a significant prog-
nostic factor (Fyles et al., 1995; Stehman et al., 1991).
Nodal involvement represents the most significant
negative prognostic factor in the majority of studies.
In limited-stage disease (Stage I/II), reports indicate
5-year survival rates in excess of 90 % among
treated patients with negative pelvic and para-aortic
nodes, compared with patients with positive pelvic
(from 50 % to 60 %) or para-aortic nodes (from 20 %
to 45 %) (Delgado et al., 1990). Decreasing 5-year
survival rates have been associated with increasing
numbers of positive pelvic nodes.
Lympho-vascular space invasion is a significant
prognostic factor, especially in early-stage cervical
cancer, correlating with pelvic nodal involvement
(Delgado et al., 1990; Milam et al., 2007).
Squamous-cell carcinoma accounts for from 80 % to
90 % of cervical cancers, adenocarcinoma for from 10 %
to 20 % (Young and Clement, 2002). Adenocarcinoma
has significantly lower survival rates with higher
distant failure rates compared stage-by-stage
(Baalbergen et al., 2004; Gien et al., 2010; Kleine
et al., 1989).
Even though external-beam radiotherapy (EBRT)
with concomitant chemotherapy has significantly
improved tumor control (Green et al., 2001), local failure
is still from 10 % to 15 % in early-stage disease (IB2/IIB)
increasing to as much as 40 % in more advanced stages
[IIB(distal)/IIIB/IVA], especially with topographically
unfavorable disease location (such as distal parametrial
or utero-sacral ligament involvement) with poor re-
sponse to initial EBRT and chemotherapy (Barbera and
Thomas, 2009). Local tumor control is important, as per-
sistent local disease or local recurrence has a dismal
prognosis that does not significantly benefit from
salvage treatment (Barbera and Thomas, 2009).
2.7 Stage- and Risk-Adapted
Multidisciplinary Treatment
The treatment of patients with cervical cancer is
multidisciplinary, based on detailed information about
tumor size, extension, and other important prognostic
factors such as histology and nodal status. The follow-
ing treatment outlines are meant to put the report
into the perspective of present-day treatment philoso-
phies (Haie-Meder et al., 2010a), and not meant to be
treatment recommendations.
2.7.1 FIGO Stage IA1
Standard treatment consists of conisation with free
margins or simple hysterectomy (depending upon
patient age) (Gadducci et al., 2003; Gray, 2008). In the
case of lympho-vascular-space involvement, pelvic
lymphadenectomy is recommended. In patients with
at least two high-risk factors (deep stromal invasion,
lympho-vascular-space involvement, large primary
tumors), postoperative pelvic radiotherapy with or
without concomitant chemotherapy should be consid-
ered. In patients with positive margins, parametrial
involvement, or pelvic-node involvement, standard
treatment consists of postoperative EBRT with con-
comitant chemotherapy and might be followed by
vaginal brachytherapy.
2.7.2 FIGO Stage IA2
Surgery is the standard. Options consist of conisa-
tion or trachelectomy in young patients and simple
or radical hysterectomy in other patients (Gadducci
et al., 2003; Gray, 2008). If unexpectedly positive
margins or parametrial involvement is seen at
surgery, pelvic lymphadenectomy and postoperative
EBRT with concomitant chemotherapy is performed
and might be followed by vaginal brachytherapy.
2.7.3 FIGO Stage IB1
There is no general standard treatment (Landoni
et al., 1997). Options consist of surgery, definitive
EBRT plus brachytherapy, or combined brachyther-
apy and surgery plus EBRT in the case of positive
nodes (Gerbaulet et al., 2002a).
Conservative treatment (radical trachelectomy) com-
bined with pelvic lymphadenectomy can be proposed
in young patients presenting with tumors of less than
20 mm in diameter, without lympho-vascular-space in-
volvement or lymph-node involvement. A review of 548
patients treated with radical trachelectomy and lym-
phadenectomy reported a recurrence rate of about 5 %,
in accordance with what has been reported with stand-
ard colpo-hysterectomies (Beiner and Covens, 2007).
Successful pregnancies outcomes were reported to be
within the range of from 41 % to 78 %.
Standard surgery consists of radical hysterectomy,
bilateral oophorectomy, and pelvic lymphadenectomy,
and is performed if nodes are negative (Gray, 2008).
Patients with positive pelvic nodes at surgery, or posi-
tive surgical margins, or postoperative findings with
disease within parametria or with lympho-vascular
space involvement are considered at high risk of re-
currence. For high-risk patients, standard treatment
consists of complementary EBRT with concomitant
chemotherapy followed by vaginal brachytherapy
(Keys et al., 2003), but the risk of complications
(mainly gastro-intestinal) can reach 17 % (Landoni
et al., 1997). Therefore, EBRT techniques (including
brachytherapy) have to be designed with special care,
in order to minimize bowel irradiation. As the uterus
PRESCRIBING, RECORDING, AND REPORTING BRACHYTHERAPY FOR CANCER OF THE CERVIX
16
atUniversityofCalifornia,IrvineonSeptember9,2016http://jicru.oxfordjournals.org/Downloadedfrom](https://image.slidesharecdn.com/icru891-190321105446/85/Icru-89-32-320.jpg)

![spread into the uterus, the parametria and the
vagina, and the internal, external, and common iliac
nodes [see, e.g., RTOG recommendations for IMRT
(Lim et al., 2011)]. The pelvis is generally treated
with from 1.8 Gy/day to 2.0 Gy/day to a total
absorbed dose of from 45 Gy to 50 Gy with high-
energy photon beams (!10 MV).
Para-aortic nodes can be included in the target
volumes if indicated. In patients with involvement
of the lower third of the vagina, EBRT fields are
extended to the inguinal lymph nodes because of the
risk of metastases linked to the drainage of the
lower part of the vagina.
Midline shielding blocks (generally 4 cm wide)
have been used during EBRT, especially in early
stage disease. Applied after from 20 Gy to 30 Gy of
external-beam therapy, the aim is to shield the
central part of the fields to maintain bladder and
rectal absorbed doses at a low level so as to allow a
higher absorbed dose to be delivered with brachy-
therapy. No real consensus, however, has been
reported regarding their use.
In the case of parametrial disease or positive
nodes, a boost can be delivered by EBRT to a total
absorbed dose ranging from 50 Gy to 65 Gy, includ-
ing the absorbed dose given by brachytherapy. To
achieve this goal, midline blocks have been used for
central shielding. Recent data, however, have shown
that this technique did not predictably protect
organs at risk and did not significantly improve the
absorbed-dose coverage of the high-risk clinical
target volume (Fenkell et al., 2011).
Intensity-modulated radiation therapy (IMRT) in
conjunction with brachytherapy is currently under
investigation. The potential benefits of IMRT treat-
ment include a decrease in toxicity, with more con-
formal absorbed-dose distributions (Ahmed et al.,
2004; Brixey et al., 2002; Chen et al., 2011; Heron
et al., 2003; Portelance et al., 2001).
Brachytherapy represents a crucial part of the
treatment, especially in advanced cervical cancers,
as high absorbed doses can be delivered to the tumor
while sparing the bladder, the rectum, and the
sigmoid because of the rapid absorbed-dose fall-off.
The choice of brachytherapy approach, LDR, PDR,
or HDR, is usually driven by institutional traditions.
Various techniques and applicators are available
(see Sections 3.4 and 3.6). Image-based adaptive
brachytherapy seems to improve local control,
achieving local control rates at 3 years above 90 %
even in advanced disease (Castelnau-Marchand et
al., 2015; Chargari et al., 2009; Gill et al., 2015;
Lindegaard et al., 2013; Nomden et al., 2013b;
Po¨tter et al., 2007; 2011; Rijkmans et al., 2014;
Sturdza et al., 2016).
2.9 Treatment Results
2.9.1 Stage IA
In the vast majority of cases, patients are treated
with surgery alone, with a 5-year DFS of from 96 % to
100 % (Gadducci et al., 2003). In Stage IA2 with posi-
tive lymph nodes, EBRT with concomitant chemo-
therapy is the standard treatment with a 5-year DFS
of from 70 % to 90 % (Gray, 2008; Haie-Meder et al.,
2010a).
2.9.2 Stages IB1 and Limited IIA
Treatment options consist of radical surgery or
EBRT alone (without concomitant chemotherapy) fol-
lowed by brachytherapy or combined treatment using
brachytherapy and surgery (see Section 2.7.3).
Randomized studies have shown comparable out-
comes with the two modalities (Landoni et al., 1997;
Newton, 1975). Five-year DFS rates are in the range
of 73 % to 84 %. If surgery demonstrates positive
pelvic nodes or positive margins, EBRTwith concomi-
tant chemotherapy followed by vaginal brachyther-
apy is necessary for these high-risk patients and
leads to an 80 % 4-year DFS, but can result in signifi-
cant toxicity requiring medical or surgical interven-
tion in 22 % of the patients. The toxicity is mainly of
hematologic origin, but severe gastrointestinal mor-
bidity is observed in 38 % of the patients (Peters
et al., 2000) (see also Section 2.7.3 for IB1). EBRT
alone in this patient population leads to a 75 % 5-year
DFS, however with less morbidity (Landoni et al.,
1997). Another option is preoperative brachytherapy
followed by colpo-hysterectomy, with a 4-year DFS of
86 % (Gerbaulet et al., 1992; Haie-Meder et al., 2009).
In Stage IB1 and limited IIA, whatever the treatment
approach, lymph-node metastasis is the major prog-
nostic factor, with a 5-year DFS of 50 % compared
with from 85 % to 90 % in node-negative patients
(Gerbaulet et al., 1992; Haie-Meder et al., 2009).
2.9.3 Stage IB2, Extensive IIA, IIB, III,
and IVA
EBRT with concomitant chemotherapy followed
by brachytherapy is the standard treatment for all
these stages (see Section 2.7.4).
In Stage IB2–IIA, studies have shown a dose–
effect relationship, with pelvic recurrences reaching
33 % when patients received less than 60 Gy of
intracavitary treatment to Point A (Eifel et al.,
1994b; Kim et al., 1999; Paley et al., 2000). Tumor
diameter is a highly significant prognostic factor;
local tumor control generally correlated with regres-
sion after EBRT and brachytherapy. In patients with
complementary extra-fascial hysterectomy, residual
PRESCRIBING, RECORDING, AND REPORTING BRACHYTHERAPY FOR CANCER OF THE CERVIX
18
atUniversityofCalifornia,IrvineonSeptember9,2016http://jicru.oxfordjournals.org/Downloadedfrom](https://image.slidesharecdn.com/icru891-190321105446/85/Icru-89-34-320.jpg)


![vaginal bleeding prior to surgery, often with findings
of an endometrial cancer. In the context of radiation-
therapy planning, however, there is limited recent
literature on the use of US for cervical cancer brachy-
therapy (Narayan et al., 2011; Schmid et al., 2013a).
Trans-abdominal, trans-rectal, and trans-vaginal
US imaging might be performed (see Figure 4.6).
Trans-vaginal US appears to be of less value due to
its limited view of the parametria for delineation of
extra-cervical disease and due to the limited space in
the vagina after applicator insertion. For the assess-
ment of the uterine body and cervical dimensions, a
strong correlation between trans-abdominal US and
MRI has been reported, indicating a potential for
US-based treatment planning (Mahantshetty et al.,
2012; Van Dyk et al., 2009). Furthermore, it has been
shown that tumor size measured by trans-rectal US
is a prognostic factor for relapse of cervical cancer
(Magee et al., 1991). The accuracy of trans-rectal
ultrasound (TRUS) for staging cervical cancer, com-
pared with the surgical findings, was reported in one
study as 83 % (Innocenti et al., 1992). Comparisons
between TRUS and MRI in the assessment of tumor
dimensions and tumor volume are currently being
debated (Fischerova, 2011; Fischerova et al., 2008;
Hawnaur et al., 1998; Schmid et al., 2013a).
4.6 Radiography
Radiographic imaging has been used for local
FIGO staging by assessing ureteral obstruction by
Figure 4.4. Enlarged para-aortic node, contoured in red, visible
on an axial CT slice.
Figure 4.5. 2-(Fluorine-18) fluoro-2-deoxy-D-glucose PET-CTexam
revealing a large cancer of the cervix on the left and multiple
internal and common iliac nodes with increased FDG activity.
Figure 4.6. Ultrasound of cervical cancer: vaginal 3D endo-
sonography of bulky cervical cancer infiltrating into the uterine
corpus [from Figure 1.1. (Olpin and Tempany, 2011)]; trans-rectal
US (b) and MRI (c) of advanced cervical cancer with bilateral
proximal (1) and right distal (2) parametrial involvement at the
time of brachytherapy without the applicator in place (Schmid
et al., 2013a).
Brachytherapy Imaging for Treatment Planning
41
atUniversityofCalifornia,IrvineonSeptember9,2016http://jicru.oxfordjournals.org/Downloadedfrom](https://image.slidesharecdn.com/icru891-190321105446/85/Icru-89-57-320.jpg)
![IVU (Stage IIIB), bowel invasion by BE (in addition
to rectal endoscopy) (Stage IVA), bladder invasion by
cystograms in addition to cystoscopy (Stage IVA).
Bipedal LAG has been widely performed to assess
lymph-node involvement (N category in the TNM
classification) along the inguinal, iliac (external/
common), and para-aortic regions.
Chest x ray and skeletal films have been used to
assess lung metastases (M category in the TNM
system) and to confirm bone metastases in suspi-
cious lesions found through bone scintigraphy.
Treatment-planning radiographs have been used to
document the position of the applicator in relation to
the bony anatomy and the position of the recto-
sigmoid and the bladder (ICRU, 1985). Due to the dif-
ficulty of identifying the same points in each structure
on both the anteroposterior and lateral radiographs,
the role of contrast-enhanced 2D imaging of the recto-
sigmoid, bowel, bladder, and for point-based dosim-
etry is not established. Some institutions use clips to
mark the cervix or vaginal extensions of disease.
With the advent of computerized treatment plan-
ning, radiographs have been taken in two (orthogonal)
orientations with a 3D reference system (e.g., refer-
ence box) to create individualized point-based dosim-
etry based on key applicator and reference point(s),
including Point A, Point B, and ICRU bladder and
rectum points, for a treatment plan (ICRU, 1985).
This can be aided by drawing the tumor extension
and/or the tumor width, thickness, and height in rela-
tion to the applicator onto the radiograph and/or the
treatment plan (see Figure 4.7, lateral radiograph).
This radiography-based 3D treatment planning,
relying on bony landmarks and reference points (see
Figure 4.7. Anteroposterior and lateral radiographs with tandem-ring (a) and tandem-mold (b and c) applicator in place with bladder
balloon, vaginal contrast [contrast medium (a); air (b) and (c); rectal probe in the rectum (a)] as basis for radiographic approximation of
target dose [from the GEC ESTRO Handbook of Brachytherapy 2002 (Gerbaulet et al., 2002a)]. (a) Bladder (BICRU) and rectum (RICRU)
reference points (compare with Figure 10.6), rectal probe points, pelvic wall points, and lymphatic trapezoid (compare with Figures 10.4
and 10.5); (b and c) Delineation of the tumor extension based on gynecologic examination at diagnosis (IIB and IIIB) for radiographic
approximation of target dose (see also Section 10.3, Figure 10.3).
PRESCRIBING, RECORDING, AND REPORTING BRACHYTHERAPY FOR CANCER OF THE CERVIX
42
atUniversityofCalifornia,IrvineonSeptember9,2016http://jicru.oxfordjournals.org/Downloadedfrom](https://image.slidesharecdn.com/icru891-190321105446/85/Icru-89-58-320.jpg)

![the time of brachytherapy (GTVres), the high risk
CTV [cervix, residual GTV, residual pathologic
tissue (see Section 5.2)], and the OAR (see Section
6.3) and thus provides the basis for optimization of
the absorbed-dose distribution within an adaptive
approach. CT imaging following applicator
placement allows immediate confirmation of the pos-
ition of the applicator relative to the cervix and adja-
cent OAR (see Figures 4.9 and 4.10).
The greatest value of CT has been in gaining a
better understanding of topographic relationships of
OAR and subsequently absorbed doses in organs close
to the applicators (see Figures 4.9 and 4.10). Point
doses, isodose curves, and dose–volume histograms
can be generated and used to define treatment.
The sigmoid, which might be subject to late ulcer-
ation and strictures, can weave much closer to the
applicator with time between imaging and irradi-
ation or during fractionated PDR brachytherapy
than the displaced rectum located near the rectal
ICRU Report 38 point. The sigmoid has typically
been ignored because of the difficulty in opacifying
and localizing it on plain-film images but is at con-
siderable risk as it is above the vaginal packing or
retractors and can weave very high around the
uterine tandem (see Figure 4.10) or dip very low,
close to the vaginal applicators (see Appendix). CT is
excellent at visualizing these organ locations
(Erickson et al., 2011; Lim et al., 2011; Shin et al.,
2006). CT-based generation of dose–volume histo-
grams for OAR (see Section 8.4) allows for a more re-
liable estimation of absorbed doses in the OAR and
is currently regarded as the minimum requirement
in image-based cervical cancer brachytherapy.
Even with CT-compatible applicators, the bound-
aries between structures of interest can be poorly
defined using CT. The value of MRI in the imaging
Figure 4.9. Computed tomography-based computerized treatment planning with the applicator in place, with associated isodoses in
sagittal and coronal planes.
Figure 4.10. Axial CT slice showing a contrast-filled loop of
sigmoid in close proximity to the high-absorbed-dose–volume
from the intrauterine applicator, necessitating a change in
loading pattern.
PRESCRIBING, RECORDING, AND REPORTING BRACHYTHERAPY FOR CANCER OF THE CERVIX
44
atUniversityofCalifornia,IrvineonSeptember9,2016http://jicru.oxfordjournals.org/Downloadedfrom](https://image.slidesharecdn.com/icru891-190321105446/85/Icru-89-60-320.jpg)
![of gynecologic cancers lies in its multi-planar cap-
ability and superior soft-tissue resolution compared
with CT, enabling delineation of tumor within the
cervix and uterus as well as within the parametrial
and vaginal tissues (Erickson, 2003; Erickson et al.,
2011; Wachter-Gerstner et al., 2003); this is true
even for the residual tumor after external-beam
therapy. Furthermore, residual pathologic tissue
can become visible in areas occupied by the initial
tumor. Tumors of the cervix display moderately
increased signal on T2-weighted images relative to
normal cervical stroma, permitting definition of
tumor volume. This is an advantage during brachy-
therapy as it is possible to assess the proximity of
the tumor to the applicator and the subsequent
absorbed-dose distribution throughout the tumor
volume, permitting accurate determination and
better control of the absorbed dose in the adjacent
normal organs (Dimopoulos et al., 2012a; Erickson
et al., 2011; Lim et al., 2011).
The GEC ESTRO working group developed recom-
mendations for recording and reporting 3D-image-
based treatment planning for cervical cancer
brachytherapy. These discussions began in 2000 and
were based on evaluations of repeated MRI and
gynecologic examinations, and resulted in recom-
mendations published in 2005 (Haie-Meder et al.,
2005), which described a methodology using mor-
phologic MRI [fast spin-echo sequences (FSE)] at
the time of diagnosis and at brachytherapy to define
the GTVinit, the GTVres, and the CTVHR (see
Sections 5.3 and 5.4).
More detailed recommendations based on the GEC
ESTRO recommendations for target delineation from
2005 were published recently (Dimopoulos et al.,
2012a). These recommendations include performing
pelvic MRI (T2-weighted) prior to radiotherapy and at
the time of brachytherapy using preferably the same
MR scanner. Correlation with the images from the
pelvic examination and with gynecologic examination
at each of these points is essential. Multi-planar
T2-weighted images (FSE) obtained parallel and or-
thogonal to the uterus (applicator) axes in (para-)
transverse, (para-) sagittal, and (para-) coronal orien-
tation are considered the gold standard for visualiza-
tion of the tumor, the uterus, the parametria, and the
critical organs (Dimopoulos et al., 2012a). Dedicated
MRI protocols tailored to the institution-specific
magnet strength and scanner are crucial. Attention to
bladder/bowel filling is important, as is reduction in
bowel motion through the use of IV or intramuscular
antispasmodic agents. Applicator MRI compatibility,
applicator immobilization, and minimization of
patient movement are key. The spatial accuracy of MR
images is essential for precise absorbed-dose planning
and applicator reconstruction, and minimization of
susceptibility artifacts is of special importance. A slice
thickness less than or equal to 5 mm is recommended
to minimize reconstruction errors. Delineation of
the source channel is key in generating an
MRI-based dosimetry plan and can be achieved using
MR-compatible markers, fusion techniques, or a
vendor-provided library of applicators that can be
brought into the planning system (Hellebust et al.,
2010a). It is recommended that the MR images be
viewed and interpreted on dedicated DICOM-viewer
workstations. In conjunction with the schematic dia-
grams from the gynecologic examination, this pro-
vides the basis for the contouring procedure. Window
and level settings can be key in the definition of the
GTV and CTVHR (see Sections 5.3.4 and 5.4.5). The
accuracy of delineating contours improves with prac-
tice, image quality, and sequences tailored specifically
to brachytherapy. Inter-observer and intra-observer
variabilities exist, but can be minimized with optimal
imaging and experience (see Section 5.4.6).
Positron-emission tomography–CT-guided brachy-
therapy was pioneered by Grigsby and his group (Kidd
and Grigsby, 2011). The volume created by the 40 %
threshold of the maximum standardized uptake
value (SUV) is used to define the metabolically active
(residual) cervical tumor following external-beam
therapy, and can be used for delineation of the meta-
bolically active (residual) tumor in relation to the
brachytherapy applicators and the surrounding
OAR, enabling optimization of the absorbed-dose dis-
tribution.
For brachytherapy, US can be used to ensure
optimal positioning of applicators and needles within
the target volume and to assist in detecting and con-
touring the target volume and OAR (Petric et al.,
2011). Real-time US can be used during insertion of
the intrauterine tandem to achieve optimal place-
ment, for example, in patients with an obliterated
endo-cervical canal or with complex pathology, and to
prevent inadvertent uterine perforation (see
Figure 4.11). Both trans-rectal and trans-abdominal
US have been used in interstitial treatment to guide
the depth of needle insertion. Post-insertion US can
be used to measure the diameter of the cervix, the
thickness of the uterine wall, and the thickness of the
vagina at the time of brachytherapy to aid in
absorbed-dose specification (Narayan et al., 2011;
Schmid et al., 2013a; Van Dyk et al., 2009).
4.8 Summary
Assessment of disease in cervical-cancer staging is
achieved by clinical examination, various imaging tech-
niques, and laparoscopic procedures. Gynecological
examination and imaging are repeated during treat-
ment to monitor response and to guide additional boost
treatment by brachytherapy.
Brachytherapy Imaging for Treatment Planning
45
atUniversityofCalifornia,IrvineonSeptember9,2016http://jicru.oxfordjournals.org/Downloadedfrom](https://image.slidesharecdn.com/icru891-190321105446/85/Icru-89-61-320.jpg)


![5. Tumor and Target Volumes and Adaptive Radiotherapy
5.1 Introduction and Overview
A series of ICRU Reports (ICRU, 1993b; 1999;
2004a; 2007; 2010) on prescribing, recording, and
reporting several external-beam radiotherapy (EBRT)
techniques, viz. photon-, electron-, and proton-beam
radiotherapy and IMRT, provide fundamental and
widely accepted terms and concepts that have had
a significant impact on the clinical, scientific, and
educational practice of radiation oncology. Reports
on dose and volume specification for intracavitary
therapy in gynecology (ICRU, 1985) and interstitial
therapy (ICRU, 1997) have also been published.
However, since these publications, important changes
in brachytherapy practice have resulted from develop-
ments in engineering, computer technology, imaging,
radionuclide, and dose rates, combined with an overall
improved radio-oncological and radiobiological under-
standing in the field (Haie-Meder et al., 2011; Po¨tter,
2009). Many of these developments have been incorpo-
rated in the GEC-ESTRO recommendations for image-
guided adaptive brachytherapy (IGABT) in cervical
cancer (Dimopoulos et al., 2012a; Haie-Meder et al.,
2005, Hellebust et al., 2010a, Po¨tter et al., 2006).
Radiotherapy for locally advanced cervical cancer
is a prototypical example of adaptive radiotherapy
that takes into account changes in tumor configur-
ation, volume, and topography during the course
of treatment (Tanderup et al., 2010b). The current
report emphasizes the adaptive, four-dimensional
(4D: three spatial dimension and time) treatment ap-
proach that aims to improve the efficacy:toxicity ratio
by exploiting the tumor-volume regression often seen
in cervical cancer after the first phase of treatment, a
theme that is gaining prominence in (radiation) on-
cology in general (Yan, 2010). The concept of residual
gross tumor volume (GTVres) refers to the reassessed
GTV after a significant part of the overall treatment
has been completed (see Section 5.2.1.3); in cervical
cancer treatment after external beam therapy with or
without chemotherapy, it is often defined before boost
brachytherapy (see Section 5.3.4). Correspondingly,
an adaptive clinical target volume (CTVadapt) can be
delineated. In the case of brachytherapy for cervical
cancer, CTVadapt is often referred to as the high-risk
CTV, CTVHR (see Section 5.2.1.5).
For cervical cancer brachytherapy, the complex ap-
proach to adaptive radiotherapy has only recently been
systematically described, especially for the combin-
ation of EBRT with boost brachytherapy (Haie-Meder
et al., 2005; Po¨tter et al., 2006; 2008a). A rigorous
description of adaptive radiotherapy for this disease
requires the introduction of specific target volume con-
cepts such as CTVHR and the intermediate-risk CTV,
the CTVIR. These are illustrated in a set of clinical
cases of cervical cancer of varying stage of disease (see
Figures 5.7–5.14 and the Appendix).
Finally, this section briefly addresses the issue of
adding margins to allow for geometric and dosimet-
ric uncertainties (the planning target volume, PTV)
for the specific situation of intracavitary brachyther-
apy (see Section 5.5).
5.2 Volume Definitions in Adaptive
(Gynecological) Radiotherapy
GTV, CTV, and PTVare concepts defined for EBRT
in ICRU Reports 50, 62, 71, and 78 (ICRU, 1993b;
1999; 2004a; 2007). Most recently, these concepts
were discussed and expanded for use in IMRT in
ICRU Report 83 (ICRU, 2010). Important recom-
mendations of ICRU Report 83 on target volumes
relevant to this report included:
† subdividing target volumes into primary tumor
(-T), lymp node (-N), and distant metastasis (-M)
volumes;
† specifying the method used for target selection and
delineation fe.g., GTV-T (MRI, clinical examination)
or GTV-T [FMISO positron-emission tomography
(PET)/CT]g. These volumes might be nested or
could be combined into a composite “clinical” GTV-T;
† specifying the accumulated dose (and the method
used) at the time of target-volume assessment in
adaptive treatment [e.g., CTV-N (26 Gy, CT)].
These recommendations are also relevant to adap-
tive gynecological radiotherapy, in particular when
combined with brachytherapy as in cervical cancer
treatment. These concepts are therefore translated,
merged, and further developed for the currently
established terminology of gynecological brachy-
therapy.
Journal of the ICRU Vol 13 No 1–2 (2013) Report 89 doi:10.1093/jicru/ndw017
Oxford University Press
# International Commission on Radiation Units and Measurements 2016
atUniversityofCalifornia,IrvineonSeptember9,2016http://jicru.oxfordjournals.org/Downloadedfrom](https://image.slidesharecdn.com/icru891-190321105446/85/Icru-89-65-320.jpg)

![of the longitudinal axis of the tandem. As margins
along the longitudinal axis of the tandem have very
limited impact on the dose throughout the target,
longitudinal margins can be added to compensate in
part for set-up variations, even after application.
5.2.1.9 Initial Treatment based on Different
CTV-Ts. In treatment of limited disease with early
brachytherapy, current clinical practice of IGABT
often defines three CTV-Ts at the time of diagnosis:
CTV-T1 is the GTV-T and adjacent tissue, always in-
cluding the whole cervix; CTV-T2 includes the
CTV-T1 plus margins; CTV-T3 includes the CTV-T2
plus sub-volumes of adjacent compartments at risk
for potential contiguous or incontiguous microscopic
invasion (see Section 5.2.1.7). Such concept is also
considered for adaptive EBRT in locally advanced
disease based on these definitions.
The terms initial CTV-THR, initial CTV-TIR, and
initial CTV-TLR can be used also for CTV-T1,
CTV-T2, and CTV-T3 in limited disease treated with
brachytherapy at the beginning of EBRT. It can be
used in addition for any other clinical scenarios and
treatment techniques that ask for an upfront defin-
ition of these CTV-T volumes, as, for example, in
adaptive EBRT of locally advanced cervical cancer.
CTV-T1, CTV-T2, and CTV-T3 can then also be called
“Initial CTV-THR,” “Initial CTV-TIR,” and “Initial
CTV-TLR,” respectively.
5.2.2. Target Volume Definitions for Nodal
and Metastatic Disease
The recommended terminology for nodal and
metastatic target volume definitions—except for the
primary-tumor-related volumes—are in principal
those of ICRU Report 83, as these volumes are
mainly treated with EBRT. However, the concepts
and terms for adaptive radiotherapy as elaborated
in this report can be further developed and adopted
also for nodal and metastatic disease (see Section
5.4.4.4).
5.3 Clinical Aspects of Selecting and
Contouring the Initial (GTV-Tinit) and
Residual (GTV-Tres) GTV-T
5.3.1 Concept of the GTV
Complete and accurate staging and delineation of
the GTV for cervical cancer requires specification of
the tumor location and its extent in all dimensions
(in particular the width as the most important
tumor-related prognostic factor), its volume, and its
growth pattern (expansive/infiltrative). The dimen-
sions and anatomical location of the GTV still form
the major basis of the FIGO and TNM classification
systems (see Table 2.1 in Section 2) (Pecorelli, 2009;
Sobin et al., 2009) and the WHO International Code
for Disease in Oncology (ICD-O-3) (WHO, 2000).
The stage classification, including nodal disease,
represents the major prognostic factor. The GTV-T
should be described in relation to the cervix, para-
metria, and pelvic wall, as well as the uterine
corpus, the vagina, and the adjacent organs. As a
minimum requirement, the GTV-T size should be
specified in terms of maximum width (latero-lateral
dimension) and thickness (dorso-ventral dimension,
in a plane perpendicular to the cervix axis). In
locally advanced disease, height (cranio-caudal di-
mension in a plane parallel to the cervix axis) can be
assessed only if appropriate imaging is available
(see Figures 5.1 and 5.2).
Although the concept of the GTV itself is straight-
forward, accurate delineation of any GTV relies on
discrimination between malignant tumor and
normal tissue, which is dependent on the physician
and the diagnostic tools used.
In general, separate GTVs are delineated for the
primary tumor (GTV-T) and the regional node(s)
(GTV-N). In some clinical situations, however, the
metastatic node is not easily distinguishable from
the primary tumor at diagnosis [e.g., in cervical
cancer infiltrating the pelvic side wall (Stage IIIB)
with enlarged internal iliac nodes present]. In this
case, a single GTV encompassing both the primary
tumor and the node(s) might be delineated for plan-
ning the primary chemo-radiotherapy. This can be
adapted during the course of treatment according to
the volume regression of the macroscopic primary or
nodal tumor.
5.3.2 GTV-T Selection and Delineation
The GTV-Tinit includes macroscopic tumor exten-
sion at diagnosis as detected by clinical examination
(GTV-Tinit/clin) or as visualized on MRI as a mass
with high signal intensity using T2-weighted, fast
spin-echo sequences (FSE) (GTV-Tinit/MRI, or as com-
posite GTV-Tinit/MRIþclin) (see Figures 5.2a, 5.4.1a,
and 5.4.2a). As for cervix cancer the GTV-Tinit is dif-
ficult to visualize directly on CT; it can be superim-
posed on CT from clinical examination, GTV-Tinit/clin:
CT, or more accurately from MRI, GTV-Tinit/MRI: CT.
5.3.2.1 GTV-T Selection and Investigation
Technique. In radiation oncology in general, CT
and MRI are the most commonly used imaging mo-
dalities for delineating the GTV-T and serve as a
complement to clinical examination for tumors that
are clinically accessible. Increasingly, PET–CT and
functional MRI are being introduced to improve
the evaluation of the GTV. The delineated GTV-T
Tumor and Target Volumes and Adaptive Radiotherapy
51
atUniversityofCalifornia,IrvineonSeptember9,2016http://jicru.oxfordjournals.org/Downloadedfrom](https://image.slidesharecdn.com/icru891-190321105446/85/Icru-89-67-320.jpg)
![can vary significantly depending on the assessment
method (see Figure 5.1); therefore, the method(s)
used to delineate the GTV must be specified and
reported [e.g., GTVclin, GTVCT, GTVMRI, GTVPET CT,
as proposed in ICRU 83 (Geets et al., 2006; 2007;
ICRU, 2010)]. For locally advanced disease, MRI is
widely accepted as the gold standard for clinical
staging, radiotherapy planning, and assessment of
treatment response and recurrent disease (Hricak
et al., 1993). Magnetic resonance imaging is regarded
superior to CT and Ultrasonography (US) for primary-
tumor assessment, except for small-volume disease
in stage IB (Epstein et al., 2013; Hricak et al., 2007;
Mitchell et al., 2006) (see Figure 5.1). However, clin-
ical examination remains a valid and useful primary
method of assessment. Topographical descriptions,
indicating dimensions (width, thickness, height) and
the overall volume, should be given as accurately as
possible, always stating the method of evaluation
(see Figures 5.1, 5.2a, 5.4.1a, and 5.4.2a).
Computed tomography has limited value for delin-
eating the GTV-T in cervical cancer because of poor
discrimination between normal soft tissues and tumor
in most cases (see Figure 5.1). Ultrasonography pro-
vides good discrimination between the hypo-echogenic
tumor and, for example, the hyper-echogenic (fatty)
parametrial tissue as the echogenicity is different (see
also Figure 4.6) (Schmid et al., 2013a).
The information from different assessment methods
is often complementary (see Section 4). For evaluation
of vaginal disease, clinical examination with inspec-
tion and palpation, possibly supported by a vaginal
impression (Magne et al., 2010), is of major value.
Magnetic resonance imaging following a specific
protocol (e.g., vaginal filling with ultrasound gel to
visualize vaginal walls) provides additional informa-
tion on vaginal infiltration depth, but limited informa-
tion on superficial mucosal infiltration (Dimopoulos
et al., 2006b; 2012a; Van Hoe et al., 1999). For asses-
sing the tumor width, with or without infiltration into
the parametrium, as well as tumor thickness, MRI,
US, and vaginal and rectal clinical examination
provide essential and comparable information. In most
cases, tumor height is difficult or impossible to assess
by clinical examination or CT, whereas it appears to be
precise with MRI. Positron-emission tomography/CT
for primary-tumor delineation appears promising, but
more data are needed (Kidd and Grigsby, 2011).
5.3.2.2 Identification of Sub-GTV-T(s). The
use of functional imaging with PET using various
tracers or with functional MRI can add to the delin-
eation of the GTV by showing, for example, cellular
functionality such as hypoxia, which is likely to
have impact on the treatment outcome (Gregoire
et al., 2003; Kidd et al., 2013; Schuetz et al., 2010).
The identification of functional sub-GTV(s) by a
suffix (e.g., GTVFaza-PET CT for a hypoxic sub-volume)
will avoid the introduction of new or potentially con-
fusing terminology [e.g., biological target volume,
metabolic target volume, or hypoxic target volume
(Kidd et al., 2013; Ling et al., 2000)]. The sub-GTV
approach is able to cover all the different situations
that might be encountered (Ling et al., 2000).
Functional imaging can be used repetitively indicat-
ing changes in functional (sub)-GTV during the
course of treatment (residual sub- GTV) (Haack
et al., 2010). It is important that the method used to
Figure 5.1. Intravenous-contrast-enhanced pelvic CT and T2-weighted FSE MRI of a patient with locally advanced cervical cancer,
illustrating superiority of MRI in imaging the local-tumor extent and the muscular walls of the organs at risk. (a) An irregular,
contrast-enhanced large cervical mass (white arrows) is seen on CT with transposition of the cervix to the left side (lumen visible).
Irregular border between the cervix and the parametrium on the left suggests tumor invasion (white arrows). Contrast enhancement at
the posterior aspect of the right internal obturator muscle is indicative of a pathologically enlarged lymph node (white arrow-head). The
outer contours of the rectum and bladder are well visualized. (b and c) T2-weighted FSE MRI of the same patient offers improved
soft-tissue visualization. Transverse and sagittal projections reveal a high-signal intensity lesion in the postero-inferior aspect of the
cervix, representing the GTV (black arrows). The tumor exhibits a combined infiltrative and exophytic growth pattern with protrusion into
the vagina, invasion of the posterior and left vaginal fornix, and infiltration into the left parametrium (black arrows). Anterior and
superior to the lesion, the cervical tissue demonstrates its normal low-signal intensity, with a hyper-intensive signal of the
mucus-containing cervical canal. A pathologically enlarged lymph node at the posterior aspect of the right internal obturator muscles
(black arrow-head) shows high signal intensity, resembling the appearance of the primary tumor. In addition to their outer contours,
hypo-intensity-signal walls of the rectum and bladder are clearly seen.
PRESCRIBING, RECORDING, AND REPORTING BRACHYTHERAPY FOR CANCER OF THE CERVIX
52
atUniversityofCalifornia,IrvineonSeptember9,2016http://jicru.oxfordjournals.org/Downloadedfrom](https://image.slidesharecdn.com/icru891-190321105446/85/Icru-89-68-320.jpg)

![5.3.2.3 The Composite GTV: The GTV-T. The
GTV-T is the volume finally chosen by the oncologist
for treatment planning, and this is the result of consid-
ering information from different clinical and imaging
investigations. This final GTV-T used for treatment
planning is called the composite GTV-T. The dimen-
sions and the volume of this composite GTV-T should
be reported as comprehensively as possible, together
with its topographical relationships.
It is essential that the methods used for defining
the composite GTV-T are clearly described as pointed
out here (see Figures 5.1, 5.2, and 5.4) and in the
clinical examples in the Appendix. In cervical cancer,
the GTV-T assessment is at present recommended to
be based both on MRI and clinical examination.
Together they are regarded as the gold standard
for the decision on the composite GTV-T, which is
then a GTV-TclinþMRI (see Figures 5.2 and 5.4, and the
clinical examples in the Appendix).
5.3.3 Change of Primary Tumors during
Treatment: The Initial GTV-T (GTV-Tinit)
and the Residual GTV-T (GTV-Tres)
(Chemo-)radiotherapy is delivered over a period
of several weeks, often causing changes of tumor
characteristics, dimensions, volume, and topog-
raphy, and allowing treatment adaptation according
to tumor response (Yan, 2010). Many tumors show
significant volume regression during the first weeks
of radiotherapy, and the regression is generally more
pronounced after combined chemo-radiotherapy.
Tumor regression during treatment has long been
recognized, but can now be better visualized and
quantified by state-of-the-art 3D and 4D repeated
CT, MRI (US), and functional imaging.
The change of the tumor during treatment can
impact treatment strategies at any time. The GTV-Tres
as defined in this report should be used only for adapt-
ing the target volume after delivery of a radiation
dose (e.g., 45–50 Gy) regarded as sufficient to control
microscopic disease. For any other situation, the radi-
ation dose delivered should be indicated (e.g., GTV-Tres
25 Gy). There is evidence from other tumor histologies,
in particular rectal cancer, that the visualized residual
GTV-T after 50 Gy of preoperative radiotherapy
or chemo-radiotherapy might contain macroscopic,
microscopic, or no disease at the time of surgery
(Dresen et al., 2009).
Analogous to the GTV-Tinit, the GTV-Tres repre-
sents remaining macroscopic disease, determined
using the same clinical or imaging investigations as
used initially, at a specific point during the course of
treatment. This makes an assessment of macroscop-
ic tumor response possible. However, the pathologic
nature of the GTV-Tres is less well defined than that
of the GTV-Tinit, which is proven by (representative)
biopsy at diagnosis. As stated above, there may or
may not be macroscopic and/or microscopic disease
within GTV-Tres. The GTVres is used for defining an
adaptive CTV-T (see Figure 5.3). Analogous to the
specification of the initial GTV-T (see Figure 5.2A),
the location, size, growth pattern, and investigation
techniques should be specified for the residual
GTV-T (see Figure 5.2B). The GTV-Tres-related
(boost) CTV-T can be defined as an adaptive target
volume (see Figure 5.3).
The initial GTV-T can completely disappear or can
shrink and/or change in appearance due to the
initial part of the treatment (see Figure 5.3). The
GTV-Tres can have undergone inflammatory reac-
tions with edema and fibrotic remodeling and thus
not reflect the tumor tissue at diagnosis. Such
changes can be detectable by clinical means, endos-
copy, or various imaging procedures. One typical
MRI finding is termed “gray zones,” zones that were
signal intensive on the initial MRI depicting the
GTV-T but became gray indicating pathologic re-
sidual fibrotic tissue (Schmid et al., 2013b), which
might or might not contain macroscopic or micro-
scopic tumor (Dresen et al., 2009; Vincens et al.,
2008) (see Section 5.4.3). Observations from mor-
phologic imaging might be supplemented in the
future by repeated functional-imaging studies [see
Figures 4.2 and 4.3 in ICRU Report 83 (ICRU,
2010)] or by biomarkers for tumor oxygenation
(Haack et al., 2010), for permeability, or a certain re-
ceptor status (Noordhuis et al., 2011). At present,
such approaches are investigational.
5.3.4 Initial GTV-T (GTV-Tinit) and Residual
GTV-T (GTV-Tres) in Cervical Cancer
Radiotherapy (at the Time of
Brachytherapy)
For cervical cancer, clinical examination and
repeated imaging studies have shown large volumet-
ric and topographic changes during EBRT, with or
without chemotherapy, with an average volume re-
duction of from 60 % to 80 % after 4 to 5 weeks (see
Figures 5.2 and 5.4), i.e., from a mean of 59 cm3
to
13 cm3
assessed on MRI (Schmid et al., 2013b). It
has also been shown that the position of the uterus
can vary by from 0.5 cm to 3.5 cm (Beadle et al.,
2009; Dimopoulos et al., 2009a; Lim et al., 2008;
Taylor and Powell, 2008; van de Bunt et al., 2006;
2008). Furthermore, there is evidence that the re-
sponse pattern is dependent on certain tumor char-
acteristics, such as the initial growth pattern
(Dimopoulos et al., 2009b; Schmid et al., 2012). In
predominantly expansive tumors (cervix/parame-
tria/vagina/uterine corpus), there is often a huge
PRESCRIBING, RECORDING, AND REPORTING BRACHYTHERAPY FOR CANCER OF THE CERVIX
54
atUniversityofCalifornia,IrvineonSeptember9,2016http://jicru.oxfordjournals.org/Downloadedfrom](https://image.slidesharecdn.com/icru891-190321105446/85/Icru-89-70-320.jpg)


![in the area of adjacent “residual pathologic tissue”
(region of the intial GTV) (Hricak et al., 2007), and
more research is needed, including morphologic and
functional imaging and histo-pathologic evaluation.
In order to minimize the uncertainties of GTV se-
lection and contouring, the GEC ESTRO recommends
MRI and clinical examination as the standards for
contouring the GTV-Tinit for cervical cancer, and
detailed imaging protocols have been proposed
(Dimopoulos et al., 2012a; Schmid et al., 2013b),
which also include the definition of the GTV-Tres as
the volume of high-signal-intensity and clinically de-
tectable residual mass and the definition of residual
pathologic tissue as fibrotic areas within the volume
of the initial GTV. Systematic clinical investigations of
patterns of spread at diagnosis and after
chemo-radiotherapy, at the time of brachytherapy,
support these recommendations (Dimopoulos et al.,
2009a; Lang et al., 2007; Petric et al., 2008; Petricˇ
et al., 2013; Weiss et al., 2003, Wu et al., 2005). The
use of standards for imaging, appropriate image
quality, adequate training, and adherence to contour-
ing recommendations are the main strategies to min-
imize inter-observer variations for contouring both
the GTV-Tinit and the GTV-Tres (Petricˇ et al., 2013).
For the further development of adaptive-radio-
therapy approaches, the investigation and reporting
of uncertainties in GTV assessment is needed. The
evaluation and reporting of systematic and random
variations of GTV-Tinit and GTV-Tres contouring are
therefore encouraged. These uncertainties should be
reported separately from those related to the CTV-T
or the PTV-T (ICRU, 2010).
5.4 CTVand Adaptive CTV
5.4.1 Concept of CTV
The CTV is a volume containing a demonstrable
GTV and assumed sub-clinical malignant disease
considered to require therapy to achieve the treat-
ment aim. Following surgical resection, the CTV may
contain sub-clinical disease only. For well-defined
types and stages of tumors, available guidelines for
CTV delineation should be followed if applicable to
the clinical case.
CTV-T encompasses the microscopic tumor spread
at the boundary of the primary tumor GTV; CTV-N
encompasses the potential microscopic tumor
spread into lymph nodes and around a macroscopic-
ally involved node (GTV-N). A CTV-M, i.e., the po-
tential metastatic involvement of other organs (e.g.,
the lung), may in general also be considered, includ-
ing possible management with radiotherapy.
As this report focuses on brachytherapy for cervical
cancer, the following discussion concentrates on
CTV-T, only partly covering issues related to CTV-N.
5.4.2 CTV-T Selection and Delineation
The selection of the CTV-T is based on a probabil-
istic assessment integrating the biological and clin-
ical behavior of the individual tumor, and the
knowledge of the surrounding anatomy, including
structures that are barriers to tissue infiltration or
structures that are conduits allowing easy passage
for tumor dissemination (Figure 5.5).
The probability for the presence of malignant cells
and their density in the margin around the GTV
often decreases with the distance from the border of
the GTV which may be symmetrical or asymmetric-
al. In addition, there may be local routes of spread
giving specific adjacent locations a higher probabil-
ity for malignant cells to be present.
For primary cancer of the cervix, the selection of
CTV-T is guided by the assumed decrease in the
density of cancer cells with distance from the GTV
and by typical routes of microscopic spread into the
adjacent tissues. Tumor spread follow anatomical
compartments, for example, into the lateral and pos-
terior parts of the parametrium, and the risk of
spread is reduced by anatomical barriers [e.g., the
posterior sacro-uterine ligament effectively prevent-
ing spread into the adjacent para-rectal space
(Figures 5.4 and 5.5; see also Section 5.2.1.4)]. One
practical consequence is that different CTV-Ts may
be selected according to their assumed tumor
burden (ICRU, 2004a; 2010). The probability of
pathologic lymph node involvement depends mainly
on histology, stage, and primary tumor location.
The size and configuration of the CTV-T result
from the selection of the width of the margin around
the GTV but may include the whole tumor-bearing
organ (c.f., the whole prostate in cancer of the pros-
tate, the whole breast in cancer of the breast).
In cervical cancer, the whole cervix is regarded as
CTV-T1, even if the GTV occupies only part of it. A
second CTV-T2 is defined with margins around the
cervix indicating adjacent areas of suspected tumor
spread with a significant probability of tumor cells
which require treatment. A third CTV-T3 is defined
as covering the well-known areas of potential
spread; for example, for advanced cervix cancer the
whole uterus, the whole parametria, and the upper
vaginal third (if the vagina is not involved) (see
Figures 5.7–5.9; Sections 5.2.1.7 and 5.2.1.9).
The CTV selection should take into account target
selection and contouring uncertainties (see Section
5.4.6). However, the CTV does not include the range
of motion of internal anatomy (see PTV Section 5.5).
Selection of the CTV(s) is the responsibility of the
radiation oncologist and is currently based on differ-
ent levels of evidence derived from personal or de-
partmental clinical experience and on exchanged or
PRESCRIBING, RECORDING, AND REPORTING BRACHYTHERAPY FOR CANCER OF THE CERVIX
58
atUniversityofCalifornia,IrvineonSeptember9,2016http://jicru.oxfordjournals.org/Downloadedfrom](https://image.slidesharecdn.com/icru891-190321105446/85/Icru-89-74-320.jpg)
![published information. Such decision may be linked
mainly to one imaging or clinical investigation modal-
ity showing a certain GTV size and morphology or
may represent a composition of information from dif-
ferent imaging and clinical investigations which
show variations in GTV [compare the composite GTV
(Section 5.3.2)]. The 3D delineation of the CTVs for
both the primary tumor and the nodal site will often
follow published guidelines, which aim to describe
the regions at risk for microscopic spread (both at the
primary tumor site and at lymph node areas) and
relate them to boundaries identifiable on planning CT
or MRI (Castadot et al., 2010; Haie-Meder et al., 2005;
Lim et al., 2011; Small et al., 2008; Taylor et al., 2005).
5.4.3 Change of Primary Tumor CTV-T
during Treatment: The Adaptive CTV
The adaptive CTV-T (CTVadapt) is based on the size
and the configuration of the GTV-Tres. For the purpose
of this report with two distinct treatment steps (EBRT
and brachytherapy), the GTV-Tres is further specified
as it presents at the time when the delivered dose is
considered sufficient to control microscopic disease
(see Section 5.2.1.3 and 5.3.4). Around this GTV-Tres,
residual microscopic tumor cells may or may not be
suspected depending, for example, on the initial
growth (exophytic/infiltrative) and the response
pattern (central/non-central). In the case of infiltrative
tumors, multiple areas with residual (macroscopic)
pathologic tissue may be observed adjacent to the
GTVres. On MRI, such areas may appear as gray
zones, indicating residual fibrotic tissue. Such residual
pathologic tissue is located by definition in the volume
of GTVinit. Therefore, the selection of CTVadapt must
also take into account the morphology and topography
of GTVinit and the morphologic and/or functional re-
sponse to treatment. CTVadapt may or may not include
a margin around GTVres depending on the growth and
response patterns and the suspected presence of re-
sidual tumor cells (Figure 5.3). Even a sub-volume of
GTVres, considered likely to bear a specific tumor
burden, may be selected as the CTVadapt (Figure 5.6).
The adaptive radiotherapy paradigm assumes
that, after the first treatment phase, additional
treatment is needed to the CTVadapt. This additional
treatment may be a radiotherapy boost, chemother-
apy, surgery, or some combination of these modal-
ities. Whereas traditional radiotherapy practice has
mainly focused on providing additional treatment to
the GTVinit related CTV-T, there is increasing evi-
dence from analyses of pattern of recurrence, for
example, in anal cancer or in head and neck cancer,
that some situations may require additional treat-
ment only to an adaptive CTV based on GTVres.
More aggressive treatment may be considered for
such—significantly smaller—volumes in an attempt
to improve local control. Treatment-related morbid-
ity could be minimized, either due to less radical
surgery or to less toxic high-dose radiotherapy
focused on small volumes (Figure 5.6).
The radiotherapy target boost concept, as the target
for most types of radical surgery after treatment for re-
mission induction, has so far been mainly related to
the initial GTV plus margins for potential microscopic
spread. This is in contrast to the so far rarely applied
response-related adaptive boost concept, which implies
an adaptive CTV-T and which focuses on the situation
as it presents after initial treatment with often signifi-
cant changes of GTV, topography, and geometry, the
residual GTV-T. The geometrical changes during frac-
tionated radiotherapy may lead to considerable dosi-
metric changes and have received major attention in
the recent period of repetitive imaging (Yan, 2010).
“Adaptive radiotherapy” so far has mainly addressed
these geometric and dosimetric changes. In the
tumor-response-related, adaptive approach as pre-
sented here, the individual tumor response is the
Figure 5.5. Schematic axial (left) mid-sagittal (middle) and mid-coronal (right) views of typical cervix cancer growth in—and outside—the
cervix with extra-cervical infiltration into adjacent structures such as parametria, uterine corpus, vagina [see also electronic appendix
Gyn GEC ESTRO Rec II (Lim et al., 2011; Po¨tter et al., 2006)].
Tumor and Target Volumes and Adaptive Radiotherapy
59
atUniversityofCalifornia,IrvineonSeptember9,2016http://jicru.oxfordjournals.org/Downloadedfrom](https://image.slidesharecdn.com/icru891-190321105446/85/Icru-89-75-320.jpg)
![frame into which the adaptive boost for radiotherapy
is integrated. This is accomplished through morpho-
logic repetitive imaging that provides major informa-
tion about the change of GTV. In future, such
adaptation may additionally be guided by various
forms of imaging including functional imaging as, for
example, shown for lung cancer (van Elmpt et al.,
2012) or for Hodgkin’s disease (Eich et al., 2008;
Lutgendorf-Caucig et al., 2012; Specht et al., 2014).
The examples below illustrate the adaptive CTV-T
approach (see also one example as shown in
Figure 5.3). Notice that the tumor-response concept
of adaptive CTV-T can also be applied to macroscopic
nodal and metastatic disease, which would then
become a CTV-Nadapt or a CTV-Madapt.
There are two basic approaches to selecting the
CTV-T for additional radiotherapy. One approach is
to select the boost CTV-T based on the GTV-Tinit
(Figure 5.6):
† initial GTV plus margins for microscopic spread
(traditional CTV-T concept);
† initial GTValone (CTVIR; Section 5.2.1.6)
† initial sub-GTVs [e.g., based on functional
imaging (Geets et al., 2007, van Elmpt et al., 2012;
Viswanathan et al., 2007)]
Alternatively, a CTV-Tadapt approach may be used
based on the GTV-Tres, which may again give rise to
multiple possible boost CTV-Ts (Figures 5.3, 5.6):
† residual GTV plus residual pathologic tissue in
the area of the initial GTV (e.g., gray zones) plus
tumor-bearing organ (CTVHR; Section 5.2.1.3);
(compare Figure 5.3)
† residual GTV plus residual pathologic tissue in
the area of the initial GTV (e.g., gray zones) (as
demonstrated in Figure 5.3);
† residual GTV alone plus margins for suspected
microscopic spread (Figure 5.6);
† residual GTV alone (e.g., SRT boost for brain me-
tastases after whole-brain RT) (Figure 5.6);
† residual sub-GTVs (e.g., based on functional
imaging) (Figure 5.6).
GTV-Tres-related CTV-Tadapt selection is currently
based on morphologic repeat imaging, such as CT,
MRI, US, or endoscopy, and clinical examination,
whereas the selection of the (initial) CTV-T is based
on the GTVinit as represented on imaging at diagno-
sis. The resulting selection of adaptive target
volumes depends on the imaging modality applied
(Daisne et al., 2004). Functional imaging is being
investigated for defining volumes with specific
Figure 5.6. Schematic diagram indicating one typical response pattern of the initial GTV to treatment resulting in a typical residual GTV
and adjacent pathologic residual tissue (compare Figure 5.3). Various forms of CTVs are shown for boost treatment, referring either to the
initial or to the residual GTV with non-adaptive and adaptive CTV. Initial findings of tumor configuration and spread, or findings after a
first phase of treatment are taken into account (see text).
PRESCRIBING, RECORDING, AND REPORTING BRACHYTHERAPY FOR CANCER OF THE CERVIX
60
atUniversityofCalifornia,IrvineonSeptember9,2016http://jicru.oxfordjournals.org/Downloadedfrom](https://image.slidesharecdn.com/icru891-190321105446/85/Icru-89-76-320.jpg)
![biological characteristics and these are often smaller
than those defined from morphologic imaging alone
(Daisne et al., 2004). In order to fully exploit the
adaptive approach, a more thorough understanding
of tumor spread at diagnosis [cervix cancer
(Burghardt et al., 1989)] and regression pattern
during treatment [cervix cancer (Kidd et al., 2013;
Schmid et al., 2012)] is essential which requires
major research and development.
Response-related adaptive target concepts for defin-
ing boost treatments in radiotherapy alone or in multi-
modality approaches have been successfully used, for
example, in Hodgkin’s disease (lymph nodes), small
cell lung cancer (tumor and lymph nodes), anal cancer
(tumor), Ewing Sarcoma (tumor), and in selected
cases of head and neck cancer (tumor/lymph nodes).
5.4.4 Initial CTV-T and Adaptive CTV-T in
Stage-Related Treatment of Cervical
Cancer
The initial and adaptive CTV-T concepts are
described below for the various stages of cervical
cancer with special emphasis on brachytherapy.
Whereas FIGO stage-adapted treatment has been
the standard of care in local treatment of cervical
cancer for decades [stage adapted dose prescriptions
to Point A (Perez et al., 1998)], systematic
GTV-related CTV-T concepts have only been recently
introduced, mainly due to the progress in volumetric
imaging (Po¨tter et al., 2008a).
The typical pattern of spread of cervical cancer is
well known from observation of clinical behavior and
pathological examination of cervical cancer, thus
allowing a probabilistic assessment of tumor involve-
ment and spread, lymph node involvement, and po-
tential recurrence patterns (Dimopoulos et al., 2006b;
Eifel and Levenback, 2001) (Figure 5.5). According to
the primary route of tumor spread within the cervix,
the whole cervix forms the basis for the CTV-T1. The
second route of tumor spread is the adjacent uterine
corpus, the adjacent parametria, the adjacent vagina,
and the adjacent anterior and posterior spaces
toward the bladder and rectum, respectively, which
form the CTV-T2. Furthermore, the whole or major
parts of these structures are regarded as the areas of
possible microscopic tumor spread [Figure 5.5 (Hertel
et al., 2006)]. Therefore, the whole uterine corpus,
the whole parametria, the upper half of the vagina,
and the utero-bladder and cervico-rectal spaces are
generally regarded as a CTV-T3. The anterior, poster-
ior, and cranial uterine surfaces form strong barriers
for tumor infiltration into adjacent structures and
spaces such as the rectum, sigmoid, bladder, and
bowel. The sacro-uterine ligaments are at the same
time barriers against infiltration into adjacent
structures and spaces such as the para-rectal space
and the lateral rectum and routes of spread as they
form the posterior border of the parametrial space
(Figure 5.5).
5.4.4.1 Uterine Cervix: The Primary CTV-T
for Any Invasive Cervical Cancer. In invasive
cervical cancer, the whole uterine cervix is included
into any GTV-related CTV-T for any stage of disease
and at any time of treatment (Haie-Meder et al., 2005;
Viswanathan and Thomadsen, 2012; Viswanathan
et al., 2012b).
In early disease, such as FIGO IA2 and low-risk
IB, the whole cervix is the only CTV-T to be treated,
most often by surgery alone but treatment may also
include small-volume brachytherapy focused on the
uterine cervix. Specific surgical procedures (trache-
lectomy) have been developed to spare the uterine
corpus—an approach that is mainly applied in young
women to retain their ability to give birth. Local
recurrences in the remaining uterine corpus and
the adjacent parametria have rarely been reported
(Hertel et al., 2006).
5.4.4.2 Peri-Cervical Areas at Risk in
Tumors with an Intact Cervix (Stage IB, IB1,
IB2). Invasive cervical cancer with an intact cervix
presents with a wide range of tumors that vary in size
and risk from limited (,4 cm, IB1) to bulky (!4 cm,
IB2) disease (see Table 2.1). Treatment may consist of
definitive radiotherapy (including brachytherapy)
with or without chemotherapy, definitive surgery, or a
combination of these (see Section 2.7.3).
For the selection of CTV-T, two clinical scenarios
and treatment strategies should be distinguished.
For IB1 tumors, radiotherapy alone may be chosen,
including early brachytherapy during initial treat-
ment. The large IB2 tumors require more intensive
treatment with upfront chemo-radiotherapy and
late brachytherapy that is adaptive in the case of
significant tumor shrinkage.
The appropriate CTV-Ts based on initial GTV-T
assessment (Stage IB1) are the following (Figures 5.7
and 5.8):
† CTV-T1: the area adjacent to the GTV-T not sepa-
rated by any anatomical borders and the whole
cervix where the risk of microscopic tumor spread
is high;
† CTV-T2: potential significant microscopic tumor
spread beyond the cervical borders in adjacent
tissues: parametria (10 mm margin), uterine
corpus (10 mm), vagina (10 mm), anterior cervix–
bladder, and posterior cervix–rectum space (5 mm);
† CTV-T3: potential minimal tumor cell load, spread
contiguously or incontiguously within anatomical
Tumor and Target Volumes and Adaptive Radiotherapy
61
atUniversityofCalifornia,IrvineonSeptember9,2016http://jicru.oxfordjournals.org/Downloadedfrom](https://image.slidesharecdn.com/icru891-190321105446/85/Icru-89-77-320.jpg)
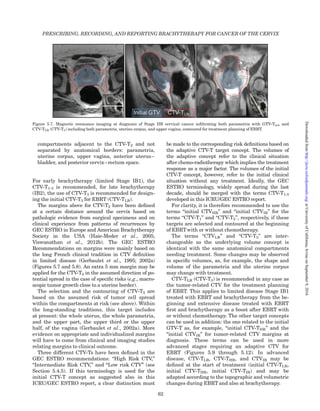
![The overall CTV-T (including CTV-T1/2/3 as neces-
sary) may be treated by either surgery or radiotherapy,
taking into account the volumes at risk. External-
beam radiotherapy is selected to treat all CTV-Ts—
usually together with the CTV-N—to a certain dose
sufficient to control microscopic disease. Brachytherapy
mainly contributes high doses to the CTV-T1þ2 inter-
mediate doses to CTV-T3 and for doses to CTV-N.
In the case of large bulky cervical disease (IB2),
the CTV-T for brachytherapy is adapted to allow
for tumor shrinkage following EBRT and concurrent
chemotherapy. The adaptive target concept is
applied with two additional CTV-Ts, the CTVHR and
the CTVIR (see the following paragraphs whereas
the compartments of potential tumor spread remain
the same—maybe with some topographic changes—,
therefore the adaptive CTVLR remains comparable
to the initial CTV-T3).
5.4.4.3 Peri-Cervical Areas at Risk in
Tumors Infiltrating beyond the Cervix (Stage
II–IVA). Tumor infiltration beyond the cervix repre-
sents the third clinical scenario relevant for CTV-T
determination. In particular, the parametria, uterine
corpus, vagina, and the adjacent anterior and poster-
ior spaces with the limiting bladder and rectum
organ walls present volumes with assumed high risk
of microscopic infiltration. The risk depends on
the individual extent and biology of disease and
the topographic relation to the potential routes of
spread in the peri-cervical areas and the barriers of
spread (see Sections 5.4.2 and 5.4.4.2; Figure 5.5). The
major routes of spread are reflected in the FIGO clas-
sification, except for uterine corpus infiltration. In
Stage IIB, a sub-division into proximal and distal infil-
tration has proven useful for further categorization of
the parametrial disease spread (Gerbaulet et al., 1995;
2002a). For uni- and bilateral parametrial infiltrations
up to the pelvic wall, a subdivision of Stage III has
been proposed as IIIA and IIIB, respectively (Eifel and
Levenback 2001; Fletcher, 1980).
The CTV-T for any infiltration beyond the cervix
has been related in the past to the extent of tumor in-
filtration at diagnosis [e.g., ICRU 38 (1985); Gerbaulet
et al. (2002a), see Figure 4.7].
The initial external chemo-radiotherapy, the
standard treatment for any patient with extra-
cervical disease (see Section 2.7.4), typically causes
significant tumor shrinkage and consequently a
major change in topography. The CTV-T determin-
ation for the brachytherapy boost at the end of exter-
nal therapy takes these changes into account by
applying the adaptive CTV-T concept with CTV-THR
and CTV-TIR as described in detail in the following
section for the various clinical scenarios (Figures 5.9
through 5.12).
5.4.4.4 Regional Lymph Nodes Involved
and at Risk. CTV-N is defined from nodal staging
as nodes with proven macroscopic, microscopic, or
Figure 5.8. Schematic diagram for cervical cancer, limited disease, Stage IB1, with initial GTV, initial CTVHR (cervix) (CTV-T1) and initial
CTVIR (margins around cervix) (CTV-T2) and initial CTVLR (margins for whole parametria, whole uterine corpus, upper third of vagina,
utero-bladder ,and cervix–rectum space) (CTV-T3) for initial brachytherapy combined with EBRT: coronal, transversal, and sagittal view
[see also Appendix example 1].
Tumor and Target Volumes and Adaptive Radiotherapy
63
atUniversityofCalifornia,IrvineonSeptember9,2016http://jicru.oxfordjournals.org/Downloadedfrom](https://image.slidesharecdn.com/icru891-190321105446/85/Icru-89-79-320.jpg)
![suspected involvement. Nodal boost volumes may be
additionally defined, for example, for suspected or
proven disease. The probability of lymph node in-
volvement increases with stage [15 % to 20 % in
Stage IB, 30 % in Stage IIB, 40% to 50 % in IIIB (see
Sections 2.5 and 2.6)] and is also dependent on
pathologic characteristics. Morphologic and func-
tional volumetric imaging (CT, MRI, PET–CT, US)
has been used for nodal staging of cervical cancer
(not included in FIGO but in TNM classification)
and assessment of the CTV-N. However, due to the
risk of false-negative imaging results, laparoscopic
lymph node sampling and radical lymph node dis-
section play an important role in assessing the nodal
status: selected para-aortic lymph and/or pelvic node
areas are sampled according to tumor stage, imaging
findings, and the estimated risk of involvement (see
Section 2.5). The areas of macroscopic involvement
(GTV-N) and proven or suspected microscopic involve-
ment (CTV-N) are considered for EBRT.
Recommendations have been published on the delin-
eation of such nodal targets with suggested margins
to vessels in regions of suspected microscopic disease
for the elective CTV-N and margins around the
GTV-N for the CTV-N (Haie-Meder et al., 2005; Lim et
al., 2011; Small et al., 2008; Taylor and Powell, 2008).
Areas of macroscopic involvement and/or poor re-
sponse may be selected for a boost CTV-N that is con-
sidered to require higher radiation doses (e.g.,
CTV-N1, CTV-N2, etc.). If such a boost is related to re-
sponse at the end of chemo-radiotherapy, an adaptive
CTV-N concept may be applied.
5.4.5 High-Risk CTV (CTVHR),
Intermediate-Risk CTV (CTVIR),
Low-Risk CTV (CTVLR) in Combined
Radiotherapy of Cervical Cancer
The high risk, CTV-THR, and intermediate risk,
CTV-TIR, as defined in Sections 5.2.1.5 and 5.2.1.6,
respectively, are GTV-T-related concepts represent-
ing areas of initial macroscopic disease (GTV-Tinit)
and microscopic disease (“the whole cervix”) while
taking into account the change of these areas during
treatment (GTV-Tres + pathologic residual tissue).
These areas have the highest risk of recurrence
within the overall CTV-T. The adaptive concept with
CTV-THR and CTV-TIR has been developed since
2000 with upcoming volumetric imaging in cervical
cancer brachytherapy based on the ICRU 38 trad-
ition and within the Point A-related tradition (Nag,
2006) to define volumes during the course of treat-
ment that may be considered to require additional
boost treatment (e.g., by brachytherapy). CTVIR is
related to the GTVinit, and CTVHR to the GTVres, any
adjacent residual pathologic tissue and the whole
uterine cervix.
CTV-TLR is defined for adjacent compartments
with potential microscopic disease such as parame-
tria, uterine corpus, and vagina analogous to CTV-T3
at diagnosis but may be redefined according to the
topography as it presents at the time of brachyther-
apy (adaptive CTV-TLR, see Section 5.4.4.2). CTV-TLR
is mainly treated by EBRT with less contribution
from brachytherapy.
Figure 5.9. Schematic diagram for cervical cancer, Stage IB2 (bulky disease), good response after chemo-radiotherapy: residual GTV-T
(GTV-Tres), adaptive CTV-T (CTV-THR), initial GTV-T (GTV-Tinit), intermediate risk CTV-T (CTV-TIR) (GTV-Tinit plus margins around the
CTV-THR), and CTV-TLR for adaptive brachytherapy: coronal, transversal, and sagittal view (see also Appendix Example 2 and 9).
PRESCRIBING, RECORDING, AND REPORTING BRACHYTHERAPY FOR CANCER OF THE CERVIX
64
atUniversityofCalifornia,IrvineonSeptember9,2016http://jicru.oxfordjournals.org/Downloadedfrom](https://image.slidesharecdn.com/icru891-190321105446/85/Icru-89-80-320.jpg)
![The CTVHR and CTVIR concepts were introduced
for image-guided, adaptive cervical cancer brachy-
therapy in the 2005 GEC ESTRO recommendations
(Haie-Meder et al., 2005) and have become widely
accepted in the international gynecological-radio-
oncological scientific community (Nag, 2006), scien-
tific and educational communications and teaching
activities [ESTRO, ABS, Association of Radiation
Oncology of India (AROI), Chinese Society of
Thereapeutic Radiology and Oncology (CISTRO),
South-East Asian Society of Radiation Oncology
(SEAROG), Association of Latin American The-
rapeutic Radiology and Oncology (ALATRO) and
International Atomic Energy Agency (IAEA)], in-
ternational treatment guidelines [ABS Guidelines
(Viswanathan and Thomadsen 2012; Viswanathan
et al., 2012b)], International Atomic Energy Agency
technical reports (IAEA, 2013), and national guide-
lines [United Kingdom (Tan et al., 2009)].
In the following, the general concept for tumor-
response related adaptive-CTV selection (see
Sections 5.4.3 and 5.4.4) is specified according to the
situation at diagnosis, and during treatment plan-
ning and treatment for the different advanced
stages of cervical cancer.
The overall concept of the Gyn GEC ESTRO
Recommendations (I), linked to MRI, is maintained
(Haie-Meder et al., 2005) with some minor adapta-
tions: terminology for initial brachytherapy (CTV-T1,2/
initial CTV-THR/IR), imaging requirements (allowing
now also for CT and US), specification of the CTVIR
in specific clinical settings (e.g., poor response, stable
disease). As CTVHR and CTVIR have become a widely
accepted terminology in this field, these terms are
further recommended for adaptive brachytherapy in
gynecology.
The GEC ESTRO Recommendations were origin-
ally intended for recording and reporting only as no
clinical target concept was supported by major clin-
ical evidence at the time. This situation has gradual-
ly improved with accumulating single- and multi-
institutional experience supporting the clinical
value of these recommendations (Chargari et al.,
2009; Haie-Meder et al., 2010b; Po¨tter et al., 2007,
2011; Sturdza et al., 2012) leading to their imple-
mentation into international treatment guidelines
(see above) and into large international studies
[STIC (Charra-Brunaud et al., 2012); EMBRACE
2015 (I and II) (www.embracestudy.dk), RETRO
EMBRACE (Sturdza et al., 2016)].
Tumor volume and pelvic anatomy change signifi-
cantly during EBRT with or without chemotherapy
(see Section 5.3.4) which indicates the need for sys-
tematic assessment of volume and configuration of
GTV-Tinit and GTV-Tres, residual pathologic tissue
and the adjacent OAR.
The assessment and the final volume contouring
are based on the following:
† clinical examination with subsequent clinical
drawings at diagnosis, during radiotherapy (if
possible at weekly intervals) and at the beginning
of brachytherapy;
Figure 5.10. Schematic diagram for cervical cancer, Stage IIB bulky disease, and good response after chemo-radiotherapy: GTV-Tinit,
GTV-Tres, and extra-cervical gray zones, adaptive CTV-THR, CTV-TIR (GTV-Tinit plus margins around the CTV-THR), and CTV-TLR for
adaptive brachytherapy: coronal, transversal, and sagittal view. Maximum width, thickness, and height of the CTV-THR are indicated (see
also Example 5 and 7 in the Appendix).
Tumor and Target Volumes and Adaptive Radiotherapy
65
atUniversityofCalifornia,IrvineonSeptember9,2016http://jicru.oxfordjournals.org/Downloadedfrom](https://image.slidesharecdn.com/icru891-190321105446/85/Icru-89-81-320.jpg)


![considerable treatment and volume change,
GTV-Tinit retains importance. It can be assumed
that residual tumor cells remain at various locations
in this volume, even if the tissue has changed to a
macroscopic normal appearance on clinical and
imaging examination. Therefore, in the adaptive
target concept for cervical cancer, special attention
is paid to GTV-Tinit. To this end, the CTV-TIR is
defined, which includes GTV-Tinit [and in any case,
a margin around the CTV-THR (see next para-
graph)]. The concept of CTVIR can be applied, for
example, if patients are treated with EBRT and
chemotherapy to be followed by brachytherapy
(common for Stage IB2 to Stage IVA disease). The se-
lection and contouring of CTV-TIR is based on macro-
scopic tumor extension at diagnosis (GTV-Tinit),
which is superimposed on the topographic situation
at the time of brachytherapy. This usually also leads
to a margin around the CTV-THR in areas of the
initial GTV-T due to tumor shrinkage. This defin-
ition is sufficient if the GTV-Tinit covers the whole
cervix as a minimum.
For areas of GTV-Tinit located within the borders
of the whole cervix, the concept of the GTV-Tinit is
alone not sufficient to define an intermediate risk
CTV-T. CTV-THR then serves as (additional) criterion
for the selection of CTV-TIR as it always includes the
whole cervix, independent of the size and configur-
ation of the GTV-T. In order to account for suspected
microscopic residual disease in the regions outside the
CTV-THR borders, a margin around CTV-THR is added
to produce CTV-TIR.1
This margin should be large
enough to include the suspected residual microscopic
disease and is decided by the radiation oncologist.
The GEC ESTRO Recommendations suggest a 10 mm
margin in the lateral and cranio-caudal directions and
5 mm in the anterior–posterior direction (Haie-Meder
Figure 5.13. Schematic diagram for cervical cancer, with parametrial infiltration (IIB distal) and various level of remission (response):
selection of different CTV-THR and CTV-TIR dependent on GTV-Tinit and GTV-Tres applying various margins for the CTV-TIR in adaptive
brachytherapy (see also examples in the Appendix).
1
The authors are aware that the area of significant microscopic
tumor burden is situated around the CTV-THR (and partly inside
the CTV-THR). Therefore the CTV-TIR should be a volume
surrounding the CTV-THR like a shell according to the dimensions
and the configuration of the GTV-Tinit and should include a
margin at the borders of the CTV-THR where there was no initial
GTV-T.
PRESCRIBING, RECORDING, AND REPORTING BRACHYTHERAPY FOR CANCER OF THE CERVIX
68
atUniversityofCalifornia,IrvineonSeptember9,2016http://jicru.oxfordjournals.org/Downloadedfrom](https://image.slidesharecdn.com/icru891-190321105446/85/Icru-89-84-320.jpg)
![et al., 2005), which has been widely accepted in clinical
practice (see introduction to 5.4.5). Further clinical re-
search may provide more clinical evidence for defining
the necessary width of such margins.
5.4.5.2.1. Selection of the CTV-TIR for Vari-
ous Patterns of Tumor Response after EBRT+
Chemotherapy.
For complete response, CTV-TIR includes the
CTV-THR and the initial macroscopic tumor exten-
sion (GTV-Tinit) as superimposed on the anatomy at
the time of brachytherapy. Margins must be applied
around the (other) CTV-THR borders (not included in
GTVinit), as appropriate (Figures 5.13 and 5.14).
For good response (!70 % to 75 % GTV-T volume re-
duction, limited residual pathologic tissue),
CTV-TIR includes the CTV-THR and the initial
macroscopic tumor extension as superimposed on
the anatomy at the time of brachytherapy. Margins
must be applied around the (other) CTVHR borders
(not included in GTVinit), as appropriate
(Figures 5.13 and 5.14).
For poor response (,70 % to 75 % GTV volume re-
duction and significant residual pathologic tissue),
CTV-TIR includes GTVres and the residual patho-
logical tissue as starting point. Margins are added
for suspected adjacent residual microscopic disease
in the direction of potential residual microscopic
spread taking into account natural anatomical
borders [according to GEC ESTRO recommenda-
tions (Haie-Meder et al., 2005)]. The margins have
to include as minimum the initial macroscopic
tumor extension as superimposed on the anatomy at
the time of brachytherapy. In addition, margins
must be applied around the other borders of the
CTVHR not included in GTVinit, as appropriate
(Figures 5.13 and 5.14).
For stable disease, CTV-THR becomes similar to
the GTV-Tinit. Margins [according to GEC ESTRO
recommendations (Haie-Meder et al., 2005)] are
added to this CTV-THR analogue to those applied at
Figure 5.14. Schematic diagram for cervical cancer, with uterine and vaginal infiltration (IIIA) and various levels of remission (response):
selection of different CTV-THR and CTV-TIR dependent on GTV-Tinit and GTV-Tres applying various margins for the CTV-TIR in adaptive
brachytherapy (see also examples in the Appendix).
Tumor and Target Volumes and Adaptive Radiotherapy
69
atUniversityofCalifornia,IrvineonSeptember9,2016http://jicru.oxfordjournals.org/Downloadedfrom](https://image.slidesharecdn.com/icru891-190321105446/85/Icru-89-85-320.jpg)
![diagnosis (Figures 5.13 and 5.14, compare also
Figure 5.3). In addition, margins must be applied
around the other borders of the CTVHR not included
in GTVinit, as appropriate.
In the case of rectal/bladder invasion, CTV-T
margins should not go into the organ lumen but
should just include the tumor invasion into the organ
wall (Figure 5.12).
The GEC ESTRO Recommendations suggest
margins around the CTV-THR in the range of 5–10
(15) mm [10 mm in all directions except anterior/
posterior with 5 mm (Haie-Meder et al., 2005)],
which corresponds to the guidelines in the
EMBRACE studies (EMBRACE, 2015). These
margins must not include any OAR besides the
vagina, except in Stage IVA disease. Prospective
studies of current clinical practice may be helpful to
better understand which margins are relevant in
specific clinical situations.
5.4.6 Uncertainties in Target Selection and
Contouring
Uncertainties in target selection and contouring
are inherent to the CTV concept, as assumptions
about microscopic tumor spread have to be made
and decisions taken (Petricˇ et al., 2013). Such uncer-
tainties have also been recognized for other tumor
sites (Buijsen et al., 2012; Nijkamp et al., 2012;
Steenbakkers et al., 2006; Wang et al., 2011) and
have been discussed in ICRU reports for EBRT
(ICRU, 1999; 2004a; 2007; 2010). In high-precision
treatment planning and delivery, the uncertainties
in target selection and delineation represent one of
the weakest parts of the chain of image-guided adap-
tive radiotherapy (Kirisits et al., 2014; Njeh, 2008)
and this seems also to be true for brachytherapy in
cervical cancer (Tanderup et al., 2013). There is
emerging evidence (Kirisits et al., 2014) that
CTV-related uncertainties may even overshadow the
so-called motion and set-up geometrical uncertain-
ties considered in the PTV concept (van Herk et al.,
2000).
In the adaptive CTV-T definition, the operator-
related uncertainties may be even more significant
compared with CTV-T definition at diagnosis, since
the relevant empirical base is still developing. The
adaptive approach implies that GTV-Tres and the re-
sidual pathologic tissue after tumor shrinkage are
considered in target selection. Knowledge about the
validity and reliability of imaging and clinical find-
ings after chemo-radiotherapy with regard to re-
sidual GTV-T and residual pathologic findings
remain sparse, supported by only limited pathologic
and/or clinical evidence (Lambrecht et al., 2010;
Vincens et al., 2008).
Several inter-observer studies of MRI-based con-
touring of target volumes have shown reasonably
high conformity indices (0.6–0.7); however, with
some variation in certain regions, particularly the
parametria, vagina, and uterine corpus (Dimopoulos
et al., 2009a; Lang et al., 2006; Petric et al., 2008;
Petricˇ et al., 2013). Uncertainties are much more pro-
nounced for CT compared with MRI due to the
limited soft tissue contrast obtainable. These uncer-
tainties result in relatively larger target volumes
when CT is used for target delineation (Hegazy et al.,
2013; Po¨tter et al., 2016; Viswanathan et al., 2007).
Due to the significant dose gradients in brachyther-
apy, the impact of contouring uncertainties on dose
reporting can be significant (Hellebust et al., 2013)
and may result in different CTV-T doses when report-
ing either MRI or CT-based target definitions.
Therefore, dose reporting must specify the imaging
modality used (see Section 5.3.2 and 5.4.2).
In the process of treatment planning, the prescrip-
tion isodose is at present—in the era of transition
from 2D to 3D—frequently chosen larger than the
contoured CTV-THR. This expansion reflects that
CTV-T uncertainties are taken into account by pre-
scribing a treatment that is not completely conform-
al to the delineated CTV-T (Figure 5.15). This
clinical practice includes a CTV-T-related non-
conformality region that takes uncertainties in both
target selection and contouring into account.
The definition for CTV-THR according to the GEC
ESTRO recommendations was primarily intended
only for reporting and not for prescription, as no
clinical experience was available to justify these
definitions (Chargari et al., 2009; Lindegaard et al.,
2013; Nomden et al., 2013a; Po¨tter et al., 2007, 2011).
Therefore, due to limited clinical validation of this
new adaptive CTV-THR concept, traditional prescrip-
tion and target concepts have been and may con-
tinue to be used—in particular in a transition period
from radiography to volumetric-imaging-based
treatment planning and prescription. One hundred
years of successful experience in cervical cancer
brachytherapy with overall excellent clinical results
have to be recognized when considering the imple-
mentation of new prescription and target concepts
within the frame of IGABT. Traditional brachyther-
apy of cervical cancer has, for example, always
included large parts of the uterine corpus and of the
upper vagina [traditional pear-shaped isodose
(Erickson, 2003; Nkiwane et al., 2013; Sapru et al.,
2013; Tanderup et al., 2010a)]. Therefore, the plan-
ning aim and the prescription isodose according to in-
stitutional guidelines (see also Section 8.6) may (still)
involve margins outside the contour of CTV-THR
(Figure 5.15). This practice is likely to change grad-
ually with the accumulation of clinical evidence for
PRESCRIBING, RECORDING, AND REPORTING BRACHYTHERAPY FOR CANCER OF THE CERVIX
70
atUniversityofCalifornia,IrvineonSeptember9,2016http://jicru.oxfordjournals.org/Downloadedfrom](https://image.slidesharecdn.com/icru891-190321105446/85/Icru-89-86-320.jpg)
![the use of prescription isodoses more tailored to the
adaptive clinical target contours (Mohamed et al.,
2014; Nkiwane et al., 2013; Tanderup et al., 2010a).
Evidence is emerging, that with IGABT, very high
local control rates can be achieved using the new
target concept based on for CTVHR and CTVIR
(Chargari et al., 2009; Lindegaard et al., 2013;
Nomden et al., 2013a; Po¨tter et al., 2007; 2011) and
joining this with the past pear concept for intracavi-
tary brachytherapy (Lindegaard et al., 2008, 2013;
Po¨tter et al., 2008b; Tanderup et al., 2010a). This
new approach includes extension of the dose into the
parametria as appropriate and feasible in the case of
Stage IIB and IIIB tumors and typically a decrease
in the dose toward the tip of the tandem (upper
uterine corpus) tailored to primary tumor spread
and response (Figure 5.15, see examples in the
Appendix (Ju¨rgenliemk-Schulz et al., 2009; 2010;
Kirisits et al., 2005; 2006a; Nomden et al., 2013a).
So far, the isodose in the vagina has been kept quite
similar to the traditional pear shape in many
institutions. This pear-shaped isodose still implies a
large non-conformality region when compared with
the CTV-THR definition (Figure 5.15).
Specific considerations for target selection are dis-
cussed in the following (Figure 5.15). They reflect
the situation as outlined above reflecting the time
when this report is written:
(a) In the cranial uterine direction, there is a smooth
transition between the uterine cervix and uterine
body without natural borders. The internal
uterine os indicates the beginning of the uterine
cavity and the end of the endo-cervical canal.
There is no clear border visible on images
between the uterine cervix and corpus stroma in
many women. Traditional experience included
major parts of the uterine corpus in the target
since applicator loading through the tip of the
tandem was standard (Gerbaulet et al., 2002a;
ICRU, 1985). This traditional approach for non-
volumetric image-based target definition was sig-
nificantly different from the present MRI-based
practice of often including only the cervix in the
CTV-THR volume for tumors not infiltrating the
uterine corpus [such approach is not appropriate,
if only CT is available (Hegazy et al., 2013)].
(b) In the caudal vaginal direction, the upper vagina,
taken as approximately the upper third, about 2
cm to 3 cm, has been included in the prescribed
isodose contour since the early days of intracavi-
tary brachytherapy, resulting in exposure of a sig-
nificant vaginal volume (Gerbaulet et al., 2002a;
ICRU, 1985). Furthermore, due to the loading of
the vaginal part of the applicator, the upper third
of the vagina has always received high radiation
doses. The large non-conformality region in the
upper vagina associated with the traditional pear-
shaped isodose has not changed significantly with
the implementation of IGABT so far. This caudal
margin is also large compared with that at the
cranial part of the high-risk CTV at the uterine
cervix–corpus transition (Mohamed et al., 2014;
Sapru et al., 2013; Westerveld et al., 2013).
(c) For the lateral parametrial extensions, the cer-
vical border in the case of an intact cervix and
the residual GTV and the gray zones indicating
residual pathologic tissue in the case of infiltra-
tive extra-cervical growth have been introduced
for target delineation. The outer cervical border
represents the border of potential spread within
the tumor-bearing organ (intact cervical rim).
Residual GTV and adjacent gray zones represent
areas with a high risk of residual disease.
Such gray zones must be located in areas where
gross disease was seen before initial treatment
Figure 5.15. Schematic illustration of a cervical cancer Stage IIB
after EBRT and chemotherapy with the ring applicator in place:
CTV-THR and prescription isodose (black line) are shown in the
cervix, uterus, parametria, and vagina in the coronal view. The
size of the cranial uterine non-conformality region reflects the target
contouring uncertainty mainly due to the lack of discrimination
in the uterine stroma between the cervix and uterine corpus,
whereas the caudal vaginal non-conformality region reflects
uncertainties in target selection for the upper vagina, following
older traditions. Toward the lateral parametria, there is almost no
non-conformality-region included [modified from Tanderup et al.
(2010c)].
Tumor and Target Volumes and Adaptive Radiotherapy
71
atUniversityofCalifornia,IrvineonSeptember9,2016http://jicru.oxfordjournals.org/Downloadedfrom](https://image.slidesharecdn.com/icru891-190321105446/85/Icru-89-87-320.jpg)
![(GTV-Tinit). The pear-shaped isodose may not have
covered these borders in the past. For tumors with
a large width after EBRT, the target width deli-
neated according to the CTV-THR definition would
often be outside the width of the pear-shaped pre-
scription isodose. Following the high-risk CTV-T
recommendations, it is straightforward to contour
the cervical border for the intact cervix; however, it
is not so clear how to define the borders of such
gray zones in the case of extra-cervical growth.
These borders are by definition not very well
defined which may lead to large inter-observer var-
iations. Nevertheless, the existing evidence shows
that contouring uncertainties for the CTV-THR
seem to be less pronounced than for the GTV-Tres
and the CTV-TIR (Dimopoulos et al., 2009a; Lang
et al., 2006; Petric et al., 2008; Petricˇ et al., 2013).
(d) Similar considerations as described in (c) apply
to the anterior and posterior borders in the case
of very advanced disease infiltrating these
regions. However, in the majority of cases, these
areas are not involved and therefore the borders
are clearly visible and no major uncertainties
are to be expected.
In summary, CTV-THR selection and contouring un-
certainties may at present be taken into account
during dose planning by application of dose distribu-
tions that are not completely conformal in particular
in the cranio-caudal direction. Systematic applica-
tion of uniform margins to compensate for target se-
lection and/or contouring uncertainties is strongly
discouraged, since this leads to an overall dose escal-
ation in the entire target volume [the same applies
for PTV margins, see Figure 5.16 and Section 5.5
(Tanderup et al., 2010c)].
When the image-guided approach and the high-
risk CTV definitions become more clinically vali-
dated and with improvements in imaging technol-
ogy, uncertainties in target selection and contouring
are expected to decrease and the conformality of the
planning aim and the prescribed isodose is likely to
improve significantly. Every effort should be under-
taken to reduce these uncertainties through the use
of adequate imaging, delineation guidelines, educa-
tion and training, and continuous clinical research.
To this end, it is suggested to describe these uncer-
tainties and the applied regions of non-conformality
in order to provide evidence-based guidelines on
imaging, target selection, and contouring in different
clinical situations (tumor stage, tumor response) and
their effect on clinical outcome.
5.5 Planning Target Volume (PTV-T)
5.5.1 Concept of PTV-T. The PTV is defined as
the volume that includes the CTV with a margin that
accounts for organ motion and geometrical uncertain-
ties in dose delivery. The PTV is a geometrical concept,
designed so that the CTV receives the prescribed dose
with a clinically acceptable probability (ICRU, 1993b).
The PTV may be equal to or larger than the CTV.
A PTV is defined each time radiotherapy of a CTV is
planned for curative, postoperative, or palliative intent.
Figure 5.16. Dose profiles comparing the effects of adding margins on dose distribution in the CTVand PTV in external beam therapy (left
panel) and in intracavitary cervical cancer brachytherapy (right panel). In external beam radiotherapy, adding a PTV margin increases
the volume irradiated to a high dose, but the magnitude of the CTV dose remains roughly unchanged. In contrast, application of a PTV
margin in the lateral and anterior–posterior directions in brachytherapy and a re-normalization of dose to the PTV will result in a
systematic increase of the dose throughout the CTVand organs at risk. Modified from Tanderup et al., (2010c) with permission.
PRESCRIBING, RECORDING, AND REPORTING BRACHYTHERAPY FOR CANCER OF THE CERVIX
72
atUniversityofCalifornia,IrvineonSeptember9,2016http://jicru.oxfordjournals.org/Downloadedfrom](https://image.slidesharecdn.com/icru891-190321105446/85/Icru-89-88-320.jpg)
![However, the approach to delineate the PTV, its size
and shape depend on the radiotherapy technique.
The concept of PTV was initially introduced for
external photon-beam therapy in ICRU Report 50
(ICRU, 1993b). It was developed and slightly adapted
in successive ICRU Reports (ICRU, 1999; 2004a; 2007;
2010). It has not been specified for brachytherapy ex-
plicitly (ICRU, 1985; 1997) except for endovascular
brachytherapy (ICRU, 2004b; Po¨tter et al., 2001).
5.5.2 Geometric Uncertainties in EBRT
and Brachytherapy
Delivery of the appropriate dose distribution to a
CTV leads inevitably to irradiation of normal tissue.
In earlier ICRU documents, the possibility of com-
promising margins of the PTV was suggested if they
encroached on an OAR (ICRU, 1999). It is now
recommended (ICRU, 2007; 2010) that the delinea-
tion of the primary PTV should not be compromised.
Alternatively, subdivision of the PTV with different
prescribed doses or the establishment of appropriate
dose gradients sufficient to protect the OAR is now
recommended. Regardless of the chosen approach
dose reporting should include the entire primary
PTV in order to indicate the existence of regions of
under-dosage in the PTVand possibly the CTV.
The delineation of a PTV has to take into account
two types of uncertainties:
† The CTV’s movements within the patient,
† irradiation delivery, which depends largely on the
irradiation technique.
The margin taking movement into account sur-
rounds the CTV like a shell and is called the internal
margin and defines the internal target volume
(ITV). The second set of uncertainties related to
beam delivery conditions leads to the definition of
the set-up or external margin which is again added
to the CTV. The combination of these two types of
margins around the CTV forms the PTV. ICRU
Report 62 (ICRU, 1999) recommended that, for
EBRT, internal and external margins should be
added in quadrature. The additional volume irra-
diated when adding a PTV margin to a CTV depends
on tumor location and radiation treatment tech-
nique. In some cases, such margins may be small,
such as in high-precision radiation application tech-
niques like IGRT or where the radiation applicator
is fixed relative to the target, as in intracavitary and
interstitial brachytherapy.
5.5.3 Geometric Uncertainties and PTV
Margins in Brachytherapy
In brachytherapy, dose distribution is different
from EBRT due to source characteristics with a steep
dose fall off near the sources resulting in a very in-
homogeneous dose distribution inside the GTV and
CTV and in adjacent areas. In cervix cancer brachy-
therapy, the tandem and needles as source carriers
are inside the CTV. The ability to modify the brachy-
therapy dose distribution differs in the direction of
the axis of source catheters [longitudinal direction—
(e.g., along tandem and needles)] versus in the direc-
tion perpendicular to these (orthogonal direction).
In the longitudinal direction, the dose distribu-
tion may be elongated by loading source positions
just at the edge or outside the target. In this way, a
dose distribution can be obtained which extends
beyond the CTV. This approach will make the dose
distribution more robust with respect to uncertain-
ties in the direction along source catheters. Such an
arrangement of source positions has little effect on
the dose distribution in the central region of the
application.
In the orthogonal direction, the dose distribution
cannot be elongated in a similar way. The orthogonal
dose fall off is almost exclusively determined by the
inverse square law and cannot be manipulated to
become less steep by modifying the loading pattern
without introducing additional catheters or needles.
The isodose lines can be pushed further away from
the source in the orthogonal plane only by escalating
the dose. Therefore, defining a PTV for brachyther-
apy with a fixed margin uniformly around the CTV
and prescribing to that PTV significantly increases
the dose within the whole CTV [Figure 5.16
(Tanderup et al., 2010c)]. This is fundamentally dif-
ferent from the situation in EBRT where the dose
plateau is increased in size by application of a
margin with no accompanying dose escalation
(Figure 5.16).
For endovascular brachytherapy, a detailed PTV
concept was developed (ICRU, 2004a; Po¨tter et al.,
2001), which includes adding a margin in the direc-
tion of the catheter axis compensating for move-
ments relative to the defined target. This
longitudinal-margin concept has also been applied
for intra-luminal brachytherapy for other malignan-
cies (Po¨tter et al., 2002b) and specifically for esopha-
geal cancer (Po¨tter and Van Limbergen, 2002).
Again, margins in the orthogonal direction are not
included. The longitudinal-margin approach for
intra-luminal brachytherapy has been reported to
be relevant for clinical outcome (Schmid et al., 2004)
and represents an approach similar to what is pro-
posed here for intracavitary brachytherapy.
5.5.4 Internal Margin and the ITV
The ITV is defined as the CTV plus a margin which
takes into account uncertainties and variations in
Tumor and Target Volumes and Adaptive Radiotherapy
73
atUniversityofCalifornia,IrvineonSeptember9,2016http://jicru.oxfordjournals.org/Downloadedfrom](https://image.slidesharecdn.com/icru891-190321105446/85/Icru-89-89-320.jpg)
![size and shape of the CTVand its position/movements
within the patient (ICRU, 1999).
These uncertainties in the position of the CTVresult
essentially from expected physiological movements
(e.g., respiration, organ movement) and variations in
site, size, shape, and position of the GTV, the CTV, and
organs in or adjacent to the CTV (uterine and vaginal
movement resultant from different filling of the
bladder, rectum, movements of the bowel, etc.) (Beadle
et al., 2009; Lim et al., 2008; Taylor and Powell, 2008;
van de Bunt et al., 2006; 2008).
As a result, the additional normal tissue volume
that needs to be irradiated constitutes the basis for
the internal margin (Aaltonen et al., 1997; Ekberg
et al., 1998).
5.5.4.1 External Beam Radiotherapy. In
gynecologic EBRT, there are significant spatial var-
iations both for the uterus as a tumor-bearing organ
and for the adjacent organs at risk during the course
of external beam radiotherapy and even within frac-
tions (Beadle et al., 2009; Lim et al., 2008; Taylor
and Powell, 2008; van de Bunt et al., 2006; 2008).
These variations require consideration of margins to
compensate for the internal movements of the
CTV-T and adjacent OARs, in particular when ap-
plying advanced conformal techniques like IMRT.
5.5.4.2 Brachytherapy. There may be varia-
tions in the relation between applicator and organs/
target during delivery of brachytherapy and/or
between brachytherapy planning and delivery, which
have to be addressed as intra-fraction, inter-fraction,
and/or intra-application and inter-application vari-
ation. These variations may be different for one HDR
brachytherapy application with one or two fractions
and for a protracted course of PDR/LDR brachyther-
apy, which may last from 10 h to 120 h. Furthermore,
there may be more than one application for the full
course of brachytherapy, such as in fractionated HDR
brachytherapy or in 2 fractions of PDR/LDR brachy-
therapy leading to inter-application variation. Clinical
research addressing this type of uncertainties is
ongoing [see Section 9.6 (Andersen et al., 2013; De
Leeuw et al., 2009; Hellebust et al., 2001; Jamema
et al., 2013; Kirisits et al., 2006b; Lang et al., 2013;
Mohamed et al., 2013, Morgia et al., 2013; Nesvacil
et al., 2013a)].
In intracavitary brachytherapy, a tandem com-
bined with a vaginal applicator is inserted into the
narrow cervical canal and the uterine cavity and
additionally fixed toward the cervix with a vaginal
tamponade or a vaginal mould. As a result, the
uterine cervix and the tumor have a fixed relation-
ship with the source carrier system (the applicator).
Studies of the CTV-THR for cervical cancer showed
no, or very limited, motion of the cervix and the ad-
jacent target structures relative to the applicator
(Petricˇ et al., 2013). These findings imply that in-
ternal margins as recommended for external beam
radiotherapy need not be applied for intracavitary
cervical cancer brachytherapy.
There may be clinical situations in brachytherapy,
where the applicator is not sufficiently fixed within
one fraction or within several fractions using the
same applicator implantation and treatment plan.
This could result in different positions of the appli-
cator in relation to the target. Nevertheless, such an
application technique is regarded as clinically in-
appropriate and should not be compensated for by
additional margins. Specific measures for quality
control such as re-imaging are more appropriate.
The possible development of edema or swelling of
the cervix during a protracted course of high-dose
intracavitary radiotherapy, potentially leading to
some volume changes (Morgia et al., 2013), requires
specific attention. The most appropriate way to deal
with this problem may be repeated imaging and
re-contouring and subsequent adaptation of the
treatment plan as appropriate.
When imaging, target definition and dose plan-
ning is performed for each brachytherapy fraction
or for each application (applicator insertion), the
inter-application and/or inter-fraction uncertain-
ties are taken into account by the repeated target
definition for each fraction or application, respect-
ively.
In summary, according to current knowledge in-
ternal margins need not be applied to compensate
for variations in target position from treatment to
treatment in the vast majority of cervical cancer
cases treated with intracavitary brachytherapy. On
the other hand, application of an internal margin is
needed to compensate for variations of the CTV
during the course of EBRT, in particular when ap-
plying advanced conformal techniques like IMRT
with delineation of a CTV-T which may require extra
PTV margins due to uterine movements or to varia-
tions in rectum and bladder filling.
5.5.5 Set-up Margin (External Margin)
The set-up margin is related to uncertainties in
aligning the patient relative to the radiation source,
mechanical uncertainties of the treatment delivery
equipment, as well as uncertainties introduced
during the treatment planning procedure such as
image transfer and fusion.
5.5.5.1 External Beam Radiotherapy. To
account for uncertainties in patient positioning and
alignment of therapeutic beams during treatment
PRESCRIBING, RECORDING, AND REPORTING BRACHYTHERAPY FOR CANCER OF THE CERVIX
74
atUniversityofCalifornia,IrvineonSeptember9,2016http://jicru.oxfordjournals.org/Downloadedfrom](https://image.slidesharecdn.com/icru891-190321105446/85/Icru-89-90-320.jpg)

![1997; Pierquin and Marinello, 1997) and was
applied for accessible cancer sites such as skin,
head, and neck. PTV margins to compensate for geo-
metrical uncertainties were not explicitly taken into
account (ICRU, 1997).
Another more advanced 3D image-based pre-
planning procedure has been developed for US-based
prostate brachytherapy with a 3D image-based
target concept and the application of upfront
margins for uncertainties and 3D dose planning.
This prostate pre-procedure planning has become
widely used in clinical practice (Blasko et al., 1993;
Polo et al., 2010) and is now increasingly replaced by
on-line 3D-based planning (Hoskin et al., 2013; Polo
et al., 2010).
An image-based pre-planning procedure had not
been implemented routinely in gynecologic brachy-
therapy in the past. However, application adaptation
has been a common procedure. The MD Anderson
and Paris school took into account individual
anatomy and spread of disease based on clinical
examination (Fletcher, 1980; Gerbaulet et al.,
2002a). The individual mould fabrication was devel-
oped in the Paris school long ago (Chassagne and
Pierquin, 1966; Magne et al., 2010). The introduc-
tion of the combined intracavitary and interstitial
applicators [e.g., MUPIT-applicator (Martinez et al.,
1985)] followed later for advanced disease. Their
further development has been based on clinical and
imaging information and resulted in applicators
which used the vaginal source carriers (ring/ovoids)
as a parametrial needle template(Dimopoulos et al.,
2006b, Ju¨rgenliemk-Schulz et al., 2009; Kirisits
et al., 2006a). A systematic pre-application planning
strategy, including a pre-procedure PTV, is now con-
sidered important to account for the specific clinical
situation, the selection and contouring uncertainties
in CTV and adaptive CTV, and the expected geomet-
rical and dosimetrical uncertainties for the PTV
(Fokdal et al., 2013; Petric et al., 2009; Tanderup
et al., 2010c). However, the logistics of such pre-
planning procedures remain challenging and there-
fore they have not become widespread. Pre-planning
may in future be replaced by a 3D image based
on-line approach comparable to the developments in
prostate brachytherapy as outlined above.
The quality of applicator positioning, particularly
the implantation procedure itself and how the
implantation provides adequate dose coverage, is
another important issue. The quality of the applicator
positioning should not be confused with the geometric
uncertainties as described. Quality of applicator posi-
tioning can in general not be compensated by margins
but has mainly to be optimized through clinical experi-
ence and expertise, image guidance, and appropriate
applicator availability.
5.6 Recommendations
Level 1: Minimum standard for reporting
FIGO/TNM stage
Tumor assessment is always based on initial and repeat clinical
gynecologic examination and on additional volumetric or
sectional imaging (MRI, CT, US, PET CT) as available
Initial and residual GTV:
GTVinit before any treatment
GTVres at brachytherapy
Schematic 3D documentation on a clinical diagram of the findings
on initial and repeat clinical gynecologic examination
(transverse, mid-sagittal, mid-coronal sections; speculum
view):
location of GTVinit and GTVres plus residual pathologic tissue
dimensions of GTVinit and GTVres plus residual pathologic
tissue
maximum width and thickness, height as available (in mm)
related to the endo-cervical canal (left, right, anterior,
posterior)
related to the upper vagina (fornices) (height) as appropriate
configuration of GTVinit and GTVres plus residual pathologic tissue
spread and growth pattern of GTVinit (exophytic/infiltrative)
High-risk CTV
CTVHR: GTVres at the time of brachytherapy (after response to
chemo-radiotherapy)+any pathologic residual tissue (CTVIR in the
case of prescription to CTVIR) and the whole cervix
Schematic 3D documentation on a clinical diagram for clinical
gynecologic examination
(transverse, mid-sagittal, mid-coronal sections; speculum view):
location of CTVHR
dimensions of CTVHR
maximum width and thickness, height as available (in mm)/
standard height
related to the endo-cervical canal (left, right, anterior, posterior)
related to the upper vagina (fornices) (height) as appropriate
configuration of CTVHR
volume is calculated by ellipsoid formula (optional) except for
extensive vaginal involvement
PRESCRIBING, RECORDING, AND REPORTING BRACHYTHERAPY FOR CANCER OF THE CERVIX
76
atUniversityofCalifornia,IrvineonSeptember9,2016http://jicru.oxfordjournals.org/Downloadedfrom](https://image.slidesharecdn.com/icru891-190321105446/85/Icru-89-92-320.jpg)


![6. Organs at Risk and Morbidity-Related Concepts and Volumes
6.1 Treatment-Related Morbidity and
Health-Related Quality of Life
Any oncological treatment impacts normal tissues
within the tumor (blood vessels, connective tissue),
in the vicinity of the tumor, or elsewhere (e.g., sys-
temic toxicity after chemotherapy). An effective
curative treatment is therefore associated with a
certain risk of side effects. Hence, treatment-related
morbidity and associated impairment of
health-related quality of life are essential considera-
tions in cancer treatment.
There are typical patterns in the incidence and
time course of early and/or late morbidity for any
treatment modality. Different treatment modalities
can interact and further increase the risk of toxicity.
Therefore, the choice of a certain treatment strategy
must be based on balancing the curative (or palliative)
potential of each individual modality and their combi-
nation(s) and the probability of inducing early or late
adverse effects, based on the available evidence.
For localized cervical cancer management, the
well-established curative options are surgery or radio-
therapy alone or in combination. Adding concurrent
cytotoxic chemotherapy to external-beam pelvic radio-
therapy significantly increases the probability of local
control and survival, in particular in locally advanced
disease according to several randomized controlled
trials [see Section 2 (Vale et al., 2008)].
Cervical cancer surgery has a typical morbidity
pattern, which is dependent on the extent of the pro-
cedure. Adequate surgery [e.g., Piver I, II, III (modi-
fied Wertheim)] is dependent on the spread and
stage of disease. The potential for cure is very high
for Piver I surgery in early and limited-stage disease
(IA, IB1, IIA) with low associated morbidity; hence,
surgery plays an essential role in the management
of these disease stages. Radiotherapy also has a very
high curative potential in these stages of disease,
with low associated morbidity, and therefore, radio-
therapy is a clear alternative to surgery, arguably
with less treatment-related morbidity according to a
randomized trial (Landoni et al., 1997). For more
extensive locally advanced disease (e.g., stage IB2,
IIB, III), combined EBRT plus brachytherapy and
concurrent cytotoxic chemotherapy provides a high
potential for cure with moderate and acceptable late
morbidity involving the bowel, bladder, or vagina (Eifel
et al., 1995; Perez et al., 1983; 1984; Vale et al., 2008).
On the other hand, the potential of cure even with very
radical surgery (e.g., Piver III) in extensive locally
advanced disease is low, and the treatment-associated
complications and morbidity are high, particularly the
rate of bladder incontinence. Therefore, surgery is not
regarded as a standard treatment option for these
disease stages [European Society of Medical Oncology
guidelines (Haie-Meder et al., 2010b)]. If surgery is
combined with radiotherapy, there is evidence that
treatment-related morbidity becomes more pro-
nounced, particularly for lymphatic tissues (e.g., lymph
edema) and urinary bladder (Touboul et al., 2010).
Chemotherapy, particularly cisplatinum and
5-Fluoruracil, has been shown to be effective in cervical
cancer if applied concurrently with radiotherapy (Vale
et al., 2008). The typical morbidity patterns are early
transient hematological toxicity, renal-function impair-
ment (cisplatinum), and gastro-intestinal symptoms
(5-FU) and dose-dependent chronic nerve pain, chronic
kidney function impairment and hearing loss (cisplati-
num), and reduced bowel function (5-FU). With com-
bination treatment, there is added early morbidity, and
there can also be increased late side effects (e.g., gastro-
intestinal morbidity with 5-FU, vaginal changes, skel-
etal toxicity) (Gondi et al., 2012). The mechanism
underlying treatment-related morbidities can be differ-
ent for the different treatment modalities and are cur-
rently not fully understood (Do¨rr, 2009; 2011; Trott
et al., 2012).
Impairment of quality of life in relation to treatment-
related morbidity becomes an increasingly important
concern when choosing oncological-treatment strategies
(Kirchheiner et al., 2012a). As knowledge in this field is
still limited, substantial research efforts are required to
understand the association between typical treatment-
related clinical morbidity patterns and/or individual
endpoints, and quality of life issues. Also in radiother-
apy of cervix cancer, quality-of-life research is essential
and must be based on patient-reported symptoms, for
example, in major domains such as physical, social,
and emotional quality of life, and in sexuality and
body image.
Journal of the ICRU Vol 13 No 1–2 (2013) Report 89 doi:10.1093/jicru/ndw010
Oxford University Press
# International Commission on Radiation Units and Measurements 2016
atUniversityofCalifornia,IrvineonSeptember9,2016http://jicru.oxfordjournals.org/Downloadedfrom](https://image.slidesharecdn.com/icru891-190321105446/85/Icru-89-95-320.jpg)
![In the following sections, the focus will be on the
radiation oncology-related concepts for the assess-
ment of treatment sequelae in organs at risk (OAR).
6.2 Radiation-Related Morbidity Endpoints
Organs at risk or critical normal structures are
tissues that if irradiated could suffer significant
morbidity and thus influence the treatment plan-
ning and the dose prescription (ICRU, 2010). In
principle, all non-target tissues might be considered
organs/tissues at risk. In clinical practice, however,
the consideration of normal tissues as OARs usually
depends on their radio-responsiveness and the dose
to which their total or fractional volume is exposed
for a given dose prescribed to the target.
In cervical cancer radiotherapy (EBRT with or
without chemotherapy, brachytherapy), there are
some relevant normal structures such as rectum and
anus, sigmoid colon, large and small bowel, ureter,
bladder, urethra, and vagina directly adjacent to
CTVHR, CTVIR, and CTVLR, and partly to the nodal
CTV (CTV-N). The vagina and other organs might
even be part of the CTV in advanced disease.
Furthermore, there are structures adjacent to the
tumor-related CTV, such as nerves (e.g., for bladder,
vagina, or rectum), vessels (such as in the parame-
tria), and connective tissue. Finally, there are add-
itional important normal structures in the pelvis
(and beyond) (e.g., ovaries, kidneys, bones, bone
marrow, lymphatic structures, vessels, and nerves,
some of which are of particular relevance for
external-beam radiotherapy).
There are OAR-specific or OAR-sub-volume-specific
types of morbidity, some of which are listed here only
as examples. For bladder morbidity, urgency and in-
continence can be related to the absorbed dose to the
bladder trigone and neck, which are involved in
bladder emptying and sphincter function. Increased
bladder detrusor muscle tone, bladder fibrosis, and
volume shrinkage, causing urinary frequency, can
occur when larger parts or the entire bladder (wall)
are in the moderate-to-high-dose volume. For rectal
and sigmoidal morbidity, bleeding is linked to different
grades of telangiectasia occurring even in small
volumes. A change in bowel habits is rather a conse-
quence of the circumferential absorbed dose. Rectal
urgency and continence problems appear to be a conse-
quence of damage to the overall recto-anal wall, with
the relevant muscle and nerve plexus structures regu-
lating the recto-anal discharge (Smeenk et al., 2012).
The dose to certain specific anatomically defined
OAR sub-volumes, as defined at specific points, can
also predict morbidity [e.g., rectal bleeding, ulcer-
ation, vaginal stenosis/shortening (see Figures 6.1–
6.4)]. The ICRU rectal and bladder reference points
have been used in the past in this respect (see
Sections 8.4.1 and 10.3). For the vagina, new refer-
ence points are suggested in this report in the upper,
middle, and lower part of the vagina as defined on
radiographs or on volumetric images fe.g., at the level
of posterior-inferior border of the symphysis (PIBS)
[see Sections 8.4.3 and 10.2, and Figures 6.1, 6.4, and
8.12 (Westerveld et al., 2013)]g. Also the traditional
ICRU rectum point as defined on radiographs (see
Section 10.3) or on volumetric images (see Section 9.2)
can serve as a recto-vaginal reference point correlat-
ing with vaginal stenosis/shortening (Kirchheiner
et al., 2016). Other points might be of interest, such as
an anal reference point at the anal verge (see
Figure 6.4). These anatomical reference points have
patho-physiological or dosimetric relevance for the
endpoint in question (compare rectum and bladder in
Figure 6.4 and in Section 8.4.1; vagina in Figures 6.4
and 8.10–8.12 and in Section 8.4.3). Such anatomical
reference points have the advantage of being located
at a defined position within the organ (e.g., as the
bladder point in the bladder neck and the vaginal
points in the upper, middle, and low vagina). The
bladder reference point, for example, may be com-
bined with the volume of interest (e.g., as ratio of
dose) in order to locate the high dose–volume within
the bladder [posterior bladder wall/bladder neck
(Nkiwane et al., 2015)] which may help to find out a
correlation between dose, volume, location, and a
certain endpoint specific for a location of the high
dose–volume (Mazeron et al., 2015a).
Traditionally, tissue organization has been charac-
terized as serial, parallel, or serial–parallel (ICRU,
1993b; 2010; Withers et al., 1988). Serial organs or
serial-like organs, such as the recto-sigmoid colon,
bowel, and vagina, consist of a chain of functional
units, which all need to be preserved to guarantee the
functionality of the tissue. In contrast, in organs with
a parallel organization, the functional sub-units are
functioning independent of each other, and clinical
symptoms are observed only if a certain (threshold)
number of units are inactivated. However, more re-
cently, this concept has been further developed to
address the tissue organization also within certain
organs that are a mixture of parallel and serial organ-
ization (Do¨rr and Van der Kogel, 2009). For example,
the vasculature and neural network of any “parallel”
organ represent serial targets. Also, in the lung, trad-
itionally considered a parallel-organized organ, the
airway network is organized serially, and damage to
large bronchi might result in loss of function of the
downstream bronchioli and alveoli. Kidneys also have
a mixed serial and parallel organization, with the glo-
merula considered to be parallel structures, while the
distal tubules exhibit a more serial organization.
PRESCRIBING, RECORDING, AND REPORTING BRACHYTHERAPY FOR CANCER OF THE CERVIX
80
atUniversityofCalifornia,IrvineonSeptember9,2016http://jicru.oxfordjournals.org/Downloadedfrom](https://image.slidesharecdn.com/icru891-190321105446/85/Icru-89-96-320.jpg)


![the other hollow organs. Furthermore, there has
been limited availability of automatic-contouring
support in the past, making contouring of the organ
wall time-consuming. There is also some concern,
based on consistent clinical observations, with re-
spect to certain clinical scenarios about the applic-
ability of automatically generated second contours
at selected distances from the primary contour to in-
dicate the organ wall. These practical difficulties in
contouring organ walls with variations in thickness
can still lead to major uncertainties and consequent
inaccuracies.
Small organ-wall volumes up to 2 cm3
–3 cm3
re-
present typical targets for brachytherapy-related
morbidity (see Section 6.2, Figures 6.2 and 6.3). For
these, outer contour delineation (one contour) and
wall delineation (two contours), lead to very similar
numerical absorbed-dose values (Olszewska et al.,
2001; Wachter-Gerstner et al., 2003b). Hence, this
allows organ outer-wall contouring using only one
line, which has been a major recommendation for
OAR volume reporting from the GEC ESTRO group
(Po¨tter et al., 2006). This is feasible, valid, and reli-
able in clinical practice according to published ex-
perience (Chargari et al., 2009; Charra-Brunaud
et al., 2012; Georg et al., 2009; 2011; 2012;
Haie-Meder et al., 2009; 2010b; Ju¨rgenliemk-Schulz
et al., 2010; Kang et al., 2010; Koom et al., 2007;
Lindegaard et al., 2008; Tanderup et al., 2013). This
procedure is therefore also recommended in this
report. In the case of other morbidity endpoints linked
to larger biological targets (e.g., sigmoid stricture),
larger organ-wall volumes [.2 cm3
–3 cm3
(e.g., repre-
senting the whole circumference over a considerable
length)] might have to be considered. In such cases,
the precise organ-wall definition using the inner plus
the outer contour should be performed (Olszewska
et al., 2001, Wachter-Gerstner et al., 2003b).
The tissue organization and the topographic dis-
tribution of absorbed dose and the location of the
Figure 6.3. MRI sagittal and transversal views with utero-vaginal applicator in place and a rectal probe with three transverse lines, indicating
the distal, middle, and proximal third of the rectum (a and b) and the ICRU recto-vaginal point RVICRU (a and b, blue star). Lower line is at
the level of the pelvic diaphragm, which is indicated by the PIBS (yellow star) and demonstrates also the beginning of the anal canal (see
Figure 6.4), which for this patient is not far from the vaginal sources (compare Figures 6.2 and 6.4). The 0.1 cm3
rectal volume is shown on the
anterior wall (c). The highest rectal absorbed dose is at the level of the vaginal sources below the middle line in the distal rectum. The D0:1cm3
for the rectum (arrow) is 108 Gy EQD23 and D2cm3 is 80 Gy EQD23 (see Section 8.4.1; compare examples in the Appendix). Endoscopic images
of transient, asymptomatic ulzeration (G2) of the anterior wall after 24 months (d) (modified from Georg et al., 2009).
OAR and Morbidity-Related Concepts and Volumes
83
atUniversityofCalifornia,IrvineonSeptember9,2016http://jicru.oxfordjournals.org/Downloadedfrom](https://image.slidesharecdn.com/icru891-190321105446/85/Icru-89-99-320.jpg)
![high absorbed-dose regions, also have to be taken
into account in the delineation of OARs when
addressing different morbidity endpoints. For the
transport function of a tubular-type organ such as
the rectum or sigmoid colon (morbidity endpoint:
stenosis), it is preferable to delineate the entire cir-
cumferential wall or surface. For the assessment of
mucosal/submucosal local function (telangiectasia,
ulceration), small wall volumes adjacent to the radi-
ation sources should be delineated (e.g., posterior
bladder wall, anterior rectum wall, sigmoid colon,
small bowel, lateral vaginal walls). For the bladder,
this would imply separate posterior bladder-wall
and bladder-trigone/neck contouring in order to
assess hematuria and incontinence, respectively.
To allow for comparative studies among centers, it is
essential to follow similar accepted protocols (includ-
ing strategies for a defined filling status in hollow
OARs) and contouring guidelines for OARs. These
have only been suggested, in general, within the GEC
ESTRO recommendations (Dimopoulos et al., 2012a,
Po¨tter et al., 2006). They have, however, been more
specifically recommended, for example, within the pro-
spective EMBRACE study (www.embracestudy.dk).
For bladder filling, various clinical protocols have
been suggested (Buchali et al., 1999; Lang et al.,
2013), without proven superiority of one over the
other. In any case, one of these protocols should be
selected and consistently followed, as they all provide
a constant limited bladder filling. For example, one
protocol is to keep the transurethral catheter open,
which provides an “empty” bladder (Mazeron et al.,
2014). Such an “empty” bladder usually includes some
residual urine in the inferior-posterior part of the
organ. Low-dose rate brachytherapy has a long trad-
ition using this protocol, which is also often applied
for PDR brachytherapy. Another clinical protocol is
frequently used to adjust a defined, limited filling
status (e.g., 50 cm3
) after emptying of the bladder
(Georg et al., 2012). This protocol provides a certain
specific distance between anterior and posterior
bladder wall, but does not lead to major filling of the
lateral bladder recesses.
For the recto-sigmoid and the other bowel, the filling
status is similarly important. An empty recto-sigmoid
is usually accomplished by a pre-interventional enema
and a rectal tube allowing emptying, which is mainly
used in PDR brachytherapy, but can also be suitable
for high-dose rate. In any case, gas and feces accumula-
tion has to be avoided as much as possible, during both
imaging and irradiation, as this can lead to large varia-
tions in the luminal volume and consequently in the
wall location relative to the applicator and the radi-
ation sources.
Figure 6.4. Schematic anatomical diagrams (sagittal view) showing two different positions of the vaginal part of the utero-vaginal
applicators, the cervix tumor, the uterus, and the reference volumes of OARs in two different patients. The most irradiated-tissue volumes
adjacent to the applicator, i.e., the reference volumes 0.1 cm3
, 2 cm3
, and 5 cm3
, are illustrated for the various adjacent organs such as the
bladder (neck), rectum (anus), sigmoid, and small bowel (see Section 8.4.1). The two panels show the different locations of the 0.1 cm3
and
2 cm3
reference volumes in the adjacent OARs [modified from GEC ESTRO Recommendations II; see also Westerveld et al. (2013)].
Reference points are indicated for the bladder (ICRU, 1985), the rectum and upper vagina (ICRU, 1985), and the mid- and lower vagina
(PIBS+2 cm). The vaginal reference length (VRL) (PIBS to midpoint between the vaginal sources) can serve as an indicator to assess the
varying position of the vaginal sources relative to the surrounding normal-tissue structures (Westerveld et al., 2013).
PRESCRIBING, RECORDING, AND REPORTING BRACHYTHERAPY FOR CANCER OF THE CERVIX
84
atUniversityofCalifornia,IrvineonSeptember9,2016http://jicru.oxfordjournals.org/Downloadedfrom](https://image.slidesharecdn.com/icru891-190321105446/85/Icru-89-100-320.jpg)
![The vaginal applicator together with the packing
should be well visualized in the imaging study (e.g.,
gauze packing with diluted gadolinium for MRI)
(see Figures 6.1–6.3) and provide a constant disten-
sion of the vaginal wall throughout the imaging pro-
cedure and the subsequent irradiation. Another
possibility is the individual mould applicator.
For the assessment of small OAR volumes for
brachytherapy planning and reporting (0.1 cm3
and
2 cm3
), it seems sufficient to delineate the regions adja-
cent to the applicator with one outer contour. For the
rectum, this would imply a contouring area about 5 cm
in the cranio-caudal direction related to the vaginal
sources and its circumference. If the recto-sigmoid
junction is in this area, then it should be included in
the rectum contour. The sigmoid colon should be
clearly identified, and the whole structure should be
contoured, with specific focus on the areas adjacent to
the uterus. Similarly, small-bowel loops have to be
identified and areas (i.e., wall or organ volumes) near
the uterus need to be contoured with their entire cir-
cumference. For bladder small-volume assessment,
the whole posterior, posterior-caudal (trigone), and
posterior-cranial bladder wall should be included. For
the vagina, the whole vagina may be contoured,
perhaps with specification of upper, mid, and lower
vagina (see the second paragraph of Section 6.3).
Other volumes (e.g., anus, urethra, and ureter), which
have typically not been contoured so far might become
relevant depending on the outcome of future research.
As stated above, for the assessment of absorbed
doses to OAR volumes larger than 2 cm3
–3 cm3
for
brachytherapy planning and reporting, the whole
organ wall has to be contoured. For the rectum, this
implies the entire length from the ano-rectum to the
recto-sigmoid junction and—for the sigmoid colon—its
length up to the junction with the descending colon.
Also the anal canal can be contoured as a whole. For
colon and small bowel, large-volume protocols should
be followed and modified according to available evi-
dence from clinical observations in external-beam
radiotherapy as appropriate (see Section 8.4.2).
The most appropriate 3D imaging system for OAR
delineation remains to be defined. While there is evi-
dence that MRI provides the most reliable discrimin-
ation between initial and residual GTV and adjacent
normal (uterine) tissue (see Sections 5.3.3 and 5.3.4),
there is also some evidence that OAR delineation is
improved based on the superior soft-tissue contrast of
MRI over CT (Dimopoulos et al., 2006b). This,
however, was not demonstrated in other contouring
studies, which showed CT to be comparable to MRI
(Viswanathan et al., 2007). Computed tomography
technology might provide sufficient information for a
valid and reliable delineation of OARs. Protocols ap-
plying contrast media via different routes (e.g.,
intravenous, intraluminal) might help to further
improve CT-imaging quality, in particular for OARs.
Overall contouring uncertainties in brachytherapy
are of major importance because variations in delinea-
tion of only a few millimeters lead to significant varia-
tions in absorbed dose and absorbed-dose distribution
due to the steep absorbed-dose gradient (Hellebust
et al., 2013). This also applies for point definitions
(Tanderup et al., 2013). Therefore, identification of the
most appropriate contouring approach must be a major
aim for future clinical research.
6.4 Geometrical Uncertainties in OAR
Assessment
Variations in the position of the OAR during treat-
ment must be considered in order to avoid serious
complications. The major determinant seems to be vari-
ation in organ geometry (e.g., filling status and motion
in relation to the radiation sources). These can occur
during or between fractions in external radiotherapy,
but may be even more significant in brachytherapy due
to steep absorbed-dose gradients and can result in con-
siderable variations in the absorbed dose and the
absorbed-dose distribution within the overall irradiated
volume. These uncertainties are in addition to contour-
ing uncertainties, in particular for organs such as the
mobile bowel, the urinary bladder, or the rectum.
For EBRT, the concept of the planning organ-at-risk
volume (PRV) has been developed (ICRU, 1998;
2004a; 2007; 2010) using shell-like margins that have
to be added to the OARs to compensate for variations
and uncertainties, using similar principles as for the
PTV. A margin around an OAR with a predominantly
serial-like structure and endpoint (e.g., rectum, in
which the maximum absorbed dose to a small circum-
ferential volume determines tolerance to stenosis) is
more clinically relevant than around OARs with a
largely parallel-like structure (e.g., liver, lung, parotid
gland). For the latter, it is more important to delineate
the entire organ, as tolerance, for most endpoints,
depends more on the fraction of the total volume irra-
diated to a certain absorbed dose. This, however, over-
looks variations in tissue tolerance within the organ.
For reporting OAR absorbed doses in EBRT, ICRU
Report 83 (ICRU, 2010) recommended that, similar
to the PTV, the PRV be described by including the
size of the margins applied to the OAR volume in dif-
ferent directions. As for the PTV, several authors
have proposed approaches to calculate the OAR–
PRV margins on the basis of systematic and random
uncertainties (McKenzie et al., 2000; ICRU, 2010;
van Herk et al., 2000). Planning organ-at-risk
volume margins are used mainly for serial organs in
which damage could be dramatic [e.g., the spinal
cord (Castadot et al., 2011; Mongioj et al., 2011)].
OAR and Morbidity-Related Concepts and Volumes
85
atUniversityofCalifornia,IrvineonSeptember9,2016http://jicru.oxfordjournals.org/Downloadedfrom](https://image.slidesharecdn.com/icru891-190321105446/85/Icru-89-101-320.jpg)
![A major new direction for more accurate dose–
volume assessment for the OAR during the overall
EBRT and brachytherapy treatment is repetitive
imaging in the framework of IGRT, in combination
with advanced image-registration methods [e.g.,
rigid registration (see Section 9.3)].
For brachytherapy, and in particular for the image-
guided approach, no systematic margin concept has
been developed so far to compensate for organ motion
and uncertainties in the precise location of OAR. In
principle, the same basic difficulties arise with apply-
ing shell margins for OARs as outlined for the PTV
(Section 5.5.3). Even with small millimeter-size
margins in adjacent OAR within the steep absorbed-
dose gradient, the reported absorbed doses would sig-
nificantly overestimate the absorbed dose actually
received. For these reasons, no planning shell margins
around the OAR contour are recommended at present
for image-guided gynecologic brachytherapy.
In brachytherapy, intra-fraction and inter-fraction
variations of OAR topography can be significant and
lead to uncertainties in dose reporting (Anderson
et al., 2013; De Leeuw et al., 2009; Hellebust et al.,
2001; Lang et al., 2013; Mohamed et al., 2013). If
OARs and thus the high-absorbed-dose regions
move closer to the applicator between imaging and
absorbed-dose delivery, the delivered absorbed dose
will be higher than planned. These uncertainties
are highly related to the mobility of the organs,
and—in particular—the sigmoid, small bowel, and
bladder are prone to significant organ motion. The
amount and the clinical impact of such variations
have been under investigation in multi-center GEC
ESTRO network-related activities (Kirisits et al.,
2013; Nesvacil et al., 2013a; Tanderup et al., 2013).
For assessment of accumulated dose after several
brachytherapy fractions, it is assumed in the GEC
ESTRO Recommendations II (Po¨tter et al., 2006)
that the same volume of a certain organ is irradiated
to the highest absorbed dose (hotspot) in each frac-
tion of the entire brachytherapy process. The “as-
sumption of a static hotspot” location enables the
calculation of the highest possible dose to the
defined location under a given topographical situ-
ation. The term “worst-case assumption” (Po¨tter
et al., 2006) should be avoided as this might cause
misunderstanding, because the highest possible
hotspot absorbed dose estimated from static images
might still represent an underestimation of deliv-
ered absorbed dose in case the organ moves closer to
the applicator in between imaging and absorbed-
dose delivery. The validity of this assumption of a
static hotspot position depends on the uncertainties
in organ movement and deformation, as well as on
the applicator position (see Section 9.5), which can
vary for different organs according to their
anatomical structure and fixation, and can also vary
with different treatment techniques. There is some
clinical evidence demonstrating the practical useful-
ness of this simplifying model [e.g., for the rectum
(Georg et al., 2009; 2011; 2012)], but there is also evi-
dence to question this model [e.g., for the sigmoid
colon (Jamema et al., 2013; Mahantshetty et al.,
2011a)]. Mono-institutional data suggest that
bladder D2cm3 hotspot distribution might fulfill the
static assumption, whereas D0:1cm3 is more prone to
variations (Lang et al., 2013; Mohamed et al., 2013).
However, this conclusion might be critically depend-
ent on the control of bladder filling. Further clinical
research is necessary to evaluate the validity and
the limitations of this pragmatic model.
As for IGRT in EBRT, a major clinical-research
question in image-guided brachytherapy is the
value of repetitive imaging and advanced
image-registration methods. For gynecologic image-
guided adaptive brachytherapy, this implies evalu-
ation of the impact of intra-fraction motion and thus
shortcomings of the “static hotspot assumption” ap-
proach for the various morbidity endpoints and corre-
sponding target structures in the OAR, and the
specific uncertainties of each “system,” such as
rectum and sigmoid colon. The overall aim is to min-
imize such geometric uncertainties as much as pos-
sible (Tanderup et al., 2013).
6.5 Remaining Volumes at Risk
The volume that is within the imaged region of
the patient, but outside all delineated OARs and
CTVs should be identified as the “remaining
volume” at risk (RVR). Absorbed doses to the RVR
should be reported in addition to, and in the same
way as, the absorbed doses to specifically delineated
volumes of interest are documented (e.g., as dose–
volume histograms), in order to ensure that attention
is paid to all tissues, and not just a selected subset.
This recommendation refers not only to a risk of
second cancers, but also to morbidity endpoints,
which may potentially become relevant if others are
avoided or become less frequent. In the context of
brachytherapy, such a recommendation might apply
for the various tissues as mentioned in Section 6.2
(e.g., ureter, vessels, nerves, ovaries, kidneys) which
are not specifically addressed by the current recom-
mendations for OAR and volume selection. The outer
body contour would delineate such an overall volume
of interest and has been utilized, in particular, in
regard to external-beam radiotherapy. There could
be, for example, unsuspected regions of high
absorbed dose within the patient that would go un-
detected if RVRs were not explicitly evaluated, par-
ticularly when IMRT is used.
PRESCRIBING, RECORDING, AND REPORTING BRACHYTHERAPY FOR CANCER OF THE CERVIX
86
atUniversityofCalifornia,IrvineonSeptember9,2016http://jicru.oxfordjournals.org/Downloadedfrom](https://image.slidesharecdn.com/icru891-190321105446/85/Icru-89-102-320.jpg)
![6.6 Recommendations on Morbidity-Related
Volumes and Points
6.7 Summary
Radiotherapy-related morbidity endpoints and
(sub-) volumes of OAR are selected based on the
typical morbidity profiles as known from clinical ex-
perience in cervical cancer radiotherapy. Certain
targets in the OAR are selected that correspond to the
typical pathology and morbidity patterns [e.g., rectal-
wall area (vasculature), telangiectasia/bleeding]. This
selection implies multiple targets within one organ
according to different morbidity endpoints (e.g., bleed-
ing versus urgency/frequency in the rectum). Small
absolute volumes (e.g., 2 cm3
, 0.1 cm3
) correspond to
Level 1: Minimum standard for reporting
Volumetric imaging
approximation based on:
Baseline morbidity and QoL
assessment according to
international classification
systems
Reference volumes on 3D
images:
Assessment of small organ
volumes (0.1 cm3
and 2 cm3
) for
brachytherapy-related morbidity
through outer-wall contouring
on volumetric images in the
treatment planning system:
(1) bladder contour/volume;
(2) Rectum contour/volume.
Recto-vaginal reference point
(positioned on volumetric
images)
Radiographic approximation
based on:
Baseline morbidity and QoL
assessment according to
international classification
systems
Reference point location on
radiographs or on a
treatment plan:
(1) Bladder reference point
(2) Recto-vaginal reference
point
Level 2: Advanced standard for reporting
All that is reported in level 1 plus:
Volumetric-imaging approximation
based on:
Bladder reference point (positioned on
volumetric images)
Assessment of small organ volumes
(0.1 cm3
and 2 cm3
) for
brachytherapy-related morbidity
through outer-wall contouring on
volumetric images in the
treatment-planning system:
(1) Sigmoid-colon contour/volume;
Radiographic
approximation based on:
Vagina reference points
(on radiographs):
Upper-vagina points
(5 mm lateral from
vaginal applicator
surface, right and left)
for
brachytherapy-related
morbidity
Anatomical points for
lower and mid vagina
(PIBS, PIBS+2 cm), for
morbidity from EBRT
and brachytherapy (on
radiographs)
(2) Bowel contour/volume (adjacent,
fixed)
Assessment of intermediate- and
large-organ volumes for EBRT- and
brachytherapy-related morbidity
through outer-wall contouring on
volumetric images in the
treatment-planning system:
(1) Bladder contour/volume
(2) Rectum contour/volume
(3) Sigmoid-colon contour/volume
(4) Bowel (adjacent) contour/volume
Vagina reference points (all contoured
on volumetric images):
(1) Upper-vagina points (5 mm lateral
from vaginal applicator surface,
right and left) for
brachytherapy-related morbidity;
Level 3: Research-oriented reporting
All that is reported in Level 1 and 2 plus:
Volumetric-imaging approximation
based on:
(1) Volumes or surface for vagina;
(2) Vaginal reference length/volume
(3) Bladder sub-volumes, for
example, the neck or wall;
(4) Small volumes for anus; anal
reference point;
(5) Remaining volume of interest:
body outline;
(6) Other sub-volumes of potential
interest
Radiographic
approximation based on:
(1) Other bladder points;
(2) Anatomical anal
reference point;
(3) Sigmoid-colon and
small/large bowel
reference points;
(4) Vaginal reference
length
OAR and Morbidity-Related Concepts and Volumes
87
atUniversityofCalifornia,IrvineonSeptember9,2016http://jicru.oxfordjournals.org/Downloadedfrom](https://image.slidesharecdn.com/icru891-190321105446/85/Icru-89-103-320.jpg)

![7. Radiobiological Considerations
7.1 Introduction
7.1.1 Dose Distributions
Historically, variation in dose is kept to a minimum
inside each CTV and planning target volume (PTV)
in external-beam treatments, with the aim of achiev-
ing a homogeneous dose distribution with the dose
varying between 95 % and 107 % of the prescribed
dose (ICRU, 1993b; 2000). However, with new techni-
ques [such as intensity-modulated radiation therapy
(IMRT)], some dose inhomogeneity (dose painting)
may be specifically planned (ICRU, 2010).
For intracavitary brachytherapy (ICBT), the dose
may be prescribed to a point but more typically to a
CTV with a volume of 10 cm3
to 200 cm3
(Po¨tter
et al., 2006). Dose to a CTV may be prescribed as a
D98 or other dose–volume value or to other clinical
volumes as discussed in Sections 5 and 6. Even in the
smaller CTVs, the dose distribution is heterogeneous
with relatively low doses near the margin of the CTV
and two to three times greater dose rates and doses
delivered immediately adjacent to the radioactive
sources. The average dose and dose rate within the
CTV is consequently much higher than the dose and
dose rate at the periphery. In external beam therapy,
because of dose–volume–effect relationships, these
high doses would not be tolerated by normal tissues,
given the larger volumes commonly exposed. A study
by De Brabandere et al. (2008) shows that the GTV
receives on average 146 % (108 % to 273 %) of the dose
to the periphery of the CTV. Outside of the CTV, there
is a steep decrease in dose rate and dose.
7.1.2 Time-Dose Patterns
In addition to the difference in the spatial dose
distribution, the second major difference between
brachytherapy and external-beam radiation therapy
(EBRT) is the time–dose characteristics: dose per
fraction, dose rate, and the overall treatment dur-
ation (Joiner, 2009; van der Kogel, 2009).
In conventional EBRT, the treatment is typically
delivered with many (25 to 35) fractions of 1.8 Gy to
2.0 Gy. Each fraction is delivered in a few minutes
and fractions are usually separated by sufficient
time to allow for (near) full normal tissue recovery
between fractions. The overall duration of treatment
usually extends over 4 to 7 weeks. Hypofractionated
treatment schedules deliver the total dose in fewer
larger fractions (.2.2 Gy) and are used e.g. for the
curative treatment of melanoma (Bentzen et al.,
1989a) and liposarcoma (Thames and Suit, 1986), and
more recently for prostate (Vogelius and Bentzen,
2013) and sub-clinical breast cancer (Bentzen et al.,
2008). Hypofractionation is increasingly used in IMRT
and stereotactic photon or hadron therapy, and in
some palliative treatments. Hyperfractionated radio-
therapy applies doses per fraction ,1.8 Gy, mostly
in the range of 1.2–1.5 Gy. Accelerated protocols
deliver the total dose with a rate of dose accumulation
exceeding an EQD2 of 10 Gy week21
. In some
instances, combination protocols, i.e., accelerated-
hyperfractionated schedules, are applied.
Currently, in brachytherapy, the dose is delivered
either at a continuous low-dose rate (LDR), typically
0.5 Gy h21
, or a pulsed-dose rate (PDR), typically of
0.5 Gy to 1 Gy h21
, in an overall treatment time of a
few days, or in a few large (e.g., 7 Gy), high-dose
rate (HDR) fractions delivered over a few days or
weeks.
ICRU Report 38 (ICRU, 1985) was written in the
context of classical LDR brachytherapy. As a result of
new technological developments such as stepping-
source brachytherapy, different time–dose patterns
have been introduced into clinical practice. Hence,
agreement is necessary on definitions of terms such
as dose, dose rate, fraction (or pulse) size, overall
treatment time relevant for biological effects, how to
report these treatment parameters, the predicted
tumor response, and the incidence of normal tissue
reactions for different treatment conditions.
7.2 Time–Dose Patterns: Definitions
Different time–dose patterns are used in clinical
brachytherapy practice; these different patterns
evolved with the introduction of various kinds of
remote afterloading devices (Section 3.6). Some defini-
tions of time–dose parameters are given in ICRU
Report 58 (ICRU, 1997). The specifics of the time–dose
pattern used should always be clearly and completely
Journal of the ICRU Vol 13 No 1–2 (2013) Report 89 doi:10.1093/jicru/ndw011
Oxford University Press
# International Commission on Radiation Units and Measurements 2016
atUniversityofCalifornia,IrvineonSeptember9,2016http://jicru.oxfordjournals.org/Downloadedfrom](https://image.slidesharecdn.com/icru891-190321105446/85/Icru-89-105-320.jpg)


![dose rates above 1 Gy h21
in head and neck cancers
(Mazeron et al., 1991; Pernot et al., 1994; 1997) as
well as in gynecological brachytherapy (Haie-Meder
et al., 1994; Leborgne et al., 1996; Rodrigus et al.,
1997). At higher dose rates and depending on the
clinical situation, a reduction in total dose or use of
fractionated MDR should be considered (Hunter and
Davidson, 2002; Leborgne et al., 1999; Mazeron
et al. 2002; Newman, 1996; Patel et al., 1998, Stout
and Hunter, 1989; Wilkinson et al., 1980).
7.3.2 Medium-Dose-Rate Brachytherapy
According to ICRU 38, MDR is defined as lying
between 2 and 12 Gy h21
but, as discussed above,
it is in this report redefined as ranging between 1
and 12 Gy h21
. Again it has to be stressed that the
biological effects of a given dose change gradually
from the LDR to the MDR region, as well as from the
MDR to the HDR region and that these boundaries
are defined by convention. Medium-dose rate is deliv-
ered as fractionated or hypo-fractionated irradiation.
7.3.3 High-Dose-Rate Brachytherapy
High-dose rate has been and is now defined as
a dose rate higher than 12 Gy h21
which is delivered
as accelerated hypo-fractionated irradiation. Again
the boundary with MDR is set arbitrarily. But when
the dose rate decreases below 12 Gy h21
, for example,
due to decaying sources that are not replaced in time
(e.g., in developing countries), estimation of the loss
in biological effect should take account the recovery
processes during the prolonged irradiation time (see
Section 7.6.2).
7.4 Other Time–Dose Pattern-Related
Radiobiological Processes
In addition to recovery processes (dose-rate or
fractionation effects), repopulation, reoxygenation,
and redistribution in the cell cycle may influence the
outcome of a radiation schedule.
7.4.1 Repopulation
For a 6 to 7-week irradiation protocol, repopula-
tion does not depend on overall treatment time with
the exception of late effects that may arise as a
consequence of very pronounced early side effects
(Do¨rr, 2009; Dorr and Hendry, 2001). But overall
treatment time does play a role for early reactions
and tumor control. Repopulation has little effect in
many tumors—as studied so far—for treatment
times shorter than 3 to 4 weeks, but beyond this
time, accelerated repopulation can be observed
(Bentzen and Thames, 1991). Total treatment times
exceeding 52 to 60 days have been correlated with
decreased tumor control in cervix cancer with a
decline of 0.7 % to 1 % per day when exceeding 55
days (Chen et al., 2003; Girinski et al., 1989;
Mazeron et al., 2015b; Perez et al., 1995; Petereit
et al., 1995; Tanderup et al., 2016).
Figure 7.2. Cell survival data for a human melanoma cell line
irradiated at three different dose rates. Data are fit by a
mathematical model from which the survival is derived in the
complete absence of recovery (Line A) or for complete recovery
(Line B) (Steel, 1991).
Figure 7.3. Schematic diagram of total absorbed dose producing a
given biological effect as a function of dose rate based on the
incomplete repair model (Thames, 1985) DEquiE37 is the dose that
in the experiments led to a 37 % cell survival rate.
[Figure modified after Hall (1972).]
PRESCRIBING, RECORDING, AND REPORTING BRACHYTHERAPY FOR CANCER OF THE CERVIX
92
atUniversityofCalifornia,IrvineonSeptember9,2016http://jicru.oxfordjournals.org/Downloadedfrom](https://image.slidesharecdn.com/icru891-190321105446/85/Icru-89-108-320.jpg)

![† dose and dose rate distribution
† radiation quality (linear energy transfer, LET)
† other Therapeutic Interventions (e.g., chemother-
apy, hyperthermia, etc.)
† Patient-related factors (e.g., comorbidities)
† Tumor-related factors (e.g., hypoxia)
Therefore, in radiation therapy, when exchanging
clinical information, comparing or combining (adding)
treatments performed under different technical
conditions (i.e., when altering treatment protocols or
designing new protocols), the transformation of
absorbed dose into biologically equieffective dose is
necessary to estimate the probability of a given bio-
logical effect. The transformation function should
in principle take into account all factors that could
influence the clinical outcome of the treatments
compared. It is very important to note that the nu-
merical values of parameters used in these trans-
formation functions may vary significantly with
tissue type and with the endpoint considered (indi-
vidual early or late effects, cancer induction, etc.).
They may also be influenced by physico-chemical
conditions such as oxygenation, temperature, previ-
ous and/or concomitant chemotherapy, and patient
factors (e.g., anemia, comorbidities).
In general, late-responding tissues are more sensi-
tive than early-responding tissues or tumors to a
change in dose per fraction, dose rate, or LET. The
overall treatment time is less important in these
tissues with the exception of consequential late effects.
7.6.2 Mathematical Modeling of the Effects of
Dose Rate and Dose per Fraction,
Recovery Capacity, and Half-Time of
Recovery
Mathematical models have been developed to
compare the effects of different doses, dose rates,
and fraction sizes and inter-fraction intervals. In
EBRT, the linear-quadratic (LQ) model is commonly
used. The LQ model assumes that the effect of a
single irradiation is determined by absorbed dose
and two parameters, a and b, and their ratio a/b
[see Equations (7.1 and 7.2)] that depend on tissue,
endpoint, and radiation quality and are usually
determined at HDRs. In EBRT with fractionation
intervals greater than 6 h to 8 h, it is usually
assumed that there is recovery between fractions
and that the LQ feature of the response curve
repeats for each fraction [see n in Equation (7.1)].
The a/b value [see Equation (7.2)] quantifies the
sensitivity to changes in fraction size, with low a/b
(1 Gy to 6 Gy) indicating a high sensitivity to frac-
tionation typical of many late effects, while higher
a/b values (7 Gy to 20 Gy) are typical of early effects
and tumor control showing lower effects of fraction-
ation. These concepts are shown mathematically as:
E ¼ n ða d þ b d2
Þ ð7:1Þ
Where E is a measure or predictor of biological effect
that requires a dose–response relationship, n the
number of fractions, and d the dose per fraction.
Note that D is the total dose and is equal to nÂd.
The dependence on a/b is more explicitly shown as:
E ¼ nd b
a
b
þd
¼ bD
a
b
þd
ð7:2Þ
In brachytherapy using LDRs, the LQ model needs to
be modified, by addition of a recovery factor g [see
Equation (7.3) based upon a recovery time constant
T1/2 to take into account incomplete mono-
exponential recovery of sublethal damage during ir-
radiation (Thames, 1985)].
It must be pointed out that E in Equations (7.1)
and (7.2) is a mathematical construct, easily related to
cell survival studies, but it may not be easily related
to the severity of clinically observable phenomena
such as erythema, stenosis, fibrosis, necrosis, etc. It is
assumed, however, that protocols giving rise to equal
values of E, i.e., equieffective doses, for a given tissue
will lead to equivalent biological or clinical outcomes.
Reasonable estimates of fractionation sensitivity
(a/b values) of many normal tissue endpoints are
available (Bentzen and Joiner, 2009). Values of 7 Gy
to 10 Gy have been reported for early responding
normal tissues and between 1 Gy and 6 Gy for late
responding normal tissues. The a/b values for
human tumors vary considerably among tumor
histologies and have been reported as similar to
early responding tissues or higher (7 Gy to 20 Gy)
for many tumors, but to be much lower in melan-
oma, sarcomas, breast, and prostate cancer.
Less is known of the recovery kinetics, i.e., the
time frame in which recovery takes place (T1/2 of
recovery) (Bentzen and Joiner, 2009).
7.6.2.1 HDR Irradiation. Except for effects
related to their inhomogeneous dose distributions,
the radiobiological effects of HDR brachytherapy are
similar to those in fractionated EBRT.
No correction need be made for dose-rate effects.
Total dose and fraction size determine the radiobio-
logical effect, when full recovery is assumed to occur
between fractions (an interval of at least 6 h to 8 h).
Hence Equations (7.1) and (7.2) apply.
Although there is some controversy of the validity
of the LQ formalism at large doses per fraction
(Brenner, 2008; Kirkpatrick et al., 2008), it is
believed to quantify adequately the biological effects
PRESCRIBING, RECORDING, AND REPORTING BRACHYTHERAPY FOR CANCER OF THE CERVIX
94
atUniversityofCalifornia,IrvineonSeptember9,2016http://jicru.oxfordjournals.org/Downloadedfrom](https://image.slidesharecdn.com/icru891-190321105446/85/Icru-89-110-320.jpg)

![Roberts et al. (2004), that when a second component
is considered, there is a possibility of a longer recovery
half-time co-existing with the short one. However,
with an assumed a/b value of 3 Gy, this longer recov-
ery half-time could not be longer than about 1 h.
For tumor control in cervical cancer, a short recov-
ery half-time of 0.25 h was calculated by Roberts
et al. (2004). These short half-times that were found
in comparisons between LDR and MDR series are
probably not applicable to larger HDR fractions, if
the repartition coefficient (being the relative amount
of the fast to slow components of the recovery
process) is fraction size-dependent.
7.6.2.3 PDR Irradiation. Pulsed dose rate
brachytherapy was developed to mimic the biological
effects of continuous LDR brachytherapy, using the
stepping-source equipment developed for HDR
brachytherapy but with an initial source strength of
about 37 MBq (instead of 370 MBq for HDR). Total
dose is delivered in the same total time as with con-
tinuous LDR treatment, but with a large number of
“pulses” (see definitions in Section 7.2), typically one
per hour, with incomplete recovery assumed during
and between pulses.
The stepping PDR point source irradiates a
volume the size of a golf ball (3 cm3
) (Fowler and
Van Limbergen, 1997) at instantaneous dose rates
higher than 10 Gy h21
in the target. Twenty gray
per hour is delivered at 14.6 mm by a 37 GBq 192
Ir
source and still at 10 Gy h21
at the same distance at
the time the source decayed to 18.5 GBq (1 half-time
of decay). Most of the target dose is thus delivered as
accelerated HDR, with incomplete recovery between
pulses. The biological effect of a PDR schedule can
be expressed as:
EPDR ¼ nða d þ gb d2
Þ ð7:5Þ
where the incomplete recovery function g for PDR
[note that this “g” is different from g in Equation
(7.4)] is calculated as:
gðPDRÞ ¼
2
mt
1 À
NY À SY2
N mt
ð7:6Þ
where Y ¼ 1 – e2mt
and K ¼ e2mx
. Thus
S ¼
NK À K À NK2
eÀmt
þ KNþ1
eÀNmt
ð1 À KeÀmtÞ2
#
ð7:7Þ
where t is the time of duration of each pulse, x the
time between pulses without irradiation and N the
total number of pulses.
The lack of knowledge about T1/2 values for
human tissues in situ is probably the largest source
of uncertainty in PDR brachytherapy biological
effect estimations. However, treatment schedules
with pulse sizes of 0.5 Gy to 1.5 Gy repeated every
1 h to 3 h have been estimated to reproduce the
effects of an LDR irradiation with an increase in bio-
logic effect not exceeding 10 %, except for very short
values of T1/2 in late reacting normal tissues (see
Figure 7.4) (Fowler and Van Limbergen, 1997).
Figure 7.4 shows the biological effects of four dif-
ferent PDR schedules (0.5 Gy every hour, 1 Gy every
2 h, 1.5 Gy every 3 h, and 2 Gy every 4 h) calculated
as the ratio to the effect of a continuous LDR sched-
ule (CLDR) at 0.5 Gy h21
. It demonstrates that at
small pulse sizes (0.5 Gy every hour), the PDR/
CLDR ratio (when the instantaneous HDR is taken
into account), the ratio is maximally 1.1 (i.e.,
maximum 10 % more toxic for PDR in a broad range
of assumed half-times of recovery). The ratio
increases, however, strongly with increasing pulse
sizes and decreasing half-times of recovery. This
leads to high PDR/CLDR ratios when the pulse size
increases from 0.5 Gy to 2 Gy and T1/2 decreases
from 1.5 h to less than 6 min.
Since pulse sizes can easily be changed, PDR
allows easy “biological optimization” of a treatment
plan. Pulse sizes to organ at risk can be decreased
below 0.6 Gy per pulse to lower the risk for late bladder
and bowel complications. It can be assumed that for
organs with a low a/b value, the pulse size reduction
will result in a reduced rate of complications, with a
smaller decrease in efficacy for a tumor with a higher
a/b value (De Brabandere et al., 2008). To reach a
similar biological optimization effect within an HDR
schedule, by lowering the fraction size, extra fractions
(and possibly applications) have to be administered.
7.6.3 The Equieffective Absorbed Dose
Concept, EQDX
The “equieffective” absorbed dose concept has
been developed exclusively for radiation-therapy
applications for comparing the clinical effects of
physical doses delivered to the PTV and organs at
risk using two or more different fractionation sche-
dules (Bentzen et al., 2012). Equieffective doses are
defined as absorbed doses that, when delivered
under specified but different conditions produce the
same probability of a specific radiation effect or
endpoint.
In brachytherapy, total dose, dose rate, fraction-
ation, overall time, and temporal dose distribution,
as currently used, are the main factors that have to
be taken into account (Figure 7.5). Separately,
spatial dose distribution of the absorbed dose may
need to be considered in the form of dose–volume
relationships.
PRESCRIBING, RECORDING, AND REPORTING BRACHYTHERAPY FOR CANCER OF THE CERVIX
96
atUniversityofCalifornia,IrvineonSeptember9,2016http://jicru.oxfordjournals.org/Downloadedfrom](https://image.slidesharecdn.com/icru891-190321105446/85/Icru-89-112-320.jpg)

![where d2 ¼ 2 Gy per fraction. In the common case
when both radiations are photons given at similar
dose rates, b1 ¼ b2 and a1/b1 ¼ a2/b2. Equation
(7.12) becomes
EQD2 ¼ D
a=b þ d
a=b þ 2
ð7:13Þ
The values of a/b used in the calculations should
be given in subscript, EQD2a/b. In the case of an
EQD2 of a radiation schedule carried out with a ra-
diation quality other than photons, the appropriate
a/b and b values for that particular radiation
quality have to be used in the EQD2 formalism. [See
Equation (7.12).]
The LQ approach is assumed to give an adequate es-
timate of equieffective doses of fractionated EBRT and
HDR brachytherapy in fractions up to 5 Gy to 6 Gy, as-
suming that all sublethal damage is recovered
between fractions and repopulation and redistribution
processes are similar between the different protocols.
For translating continuous LDR into an equieffec-
tive fractionated HDR dose, the use of the Liversage
formula (Liversage, 1969) has been suggested:
N ¼
mt=2
1 À ð1=ðmtð1 À eÀmtÞÞÞ
ð7:14Þ
where N is the number of fractions into which the
HDR treatment must hypothetically be divided in
Figure 7.5. Transformation of the absorbed dose, D, to equieffective dose, EQDX, applicable to all types of radiation therapy techniques.
The concept of EQDX includes the combined effects of recovery capacity and recovery kinetics. *The effect of radiation quality or LET is
indirectly included via the a/b-value for a given endpoint. **The treatment conditions selected for the comparison,—including overall
treatment time or other factors—have to be specified in the context; however, their effects are not currently factors included in the
equieffective dose formalism (Bentzen et al., 2012).
PRESCRIBING, RECORDING, AND REPORTING BRACHYTHERAPY FOR CANCER OF THE CERVIX
98
atUniversityofCalifornia,IrvineonSeptember9,2016http://jicru.oxfordjournals.org/Downloadedfrom](https://image.slidesharecdn.com/icru891-190321105446/85/Icru-89-114-320.jpg)
![order to have an effect equivalent to the LDR treat-
ment lasting t hours if both total time and total
dose are kept constant for both approaches when t
considerably exceeds the recovery half-time, the ex-
ponential term becomes negligible and the formula
reduces to:
N ¼
mt=2
1 À ð1=mtÞ
ð7:15Þ
When t approaches 100 h, the last term in the de-
nominator becomes negligible and the formula can
be simplified again such that:
N % mt=2 and d % 2:9 T1=2DR ð7:16Þ
where DR is the dose rate in Gy h21
.
The EQD2 value of this LDR treatment then cor-
responds to:
EQD2 ¼ D
a=b þ 2:9 T1=2DR
ða=bÞ þ 2
ð7:17Þ
The value of a/b and T1/2 used in the calculations
should be given in subscripts, EQD2a/b, T1/2.
EQD2 values computed for external beam therapy
and brachytherapy can be added assuming that the
volumes or points of interest for brachytherapy
receive the stated external beam dose. This estimate
serves as a static hotspot assumption for organs at
risk. It is reasonable for the target volume of brachy-
therapy, which is a boost volume within the PTV of
external beam treatment.
In practice, the calculation of EQD2 values of a given
treatment plan can be facilitated by the use of the
GEC-ESTRO EQD2 spread sheet (http://icru.org/
content/reports/prescribing-recording-and-reporting-
brachytherapy-for-cancer-of-the-cervix-report-no-89).
In the spread sheet, the effects due to the total dose
and fraction size administered by EBRT can easily be
combined with the effects due to the total dose and frac-
tion size administered by HDR, or pulse size of PDR or
dose rate using LDR or MDR delivered using brachy-
therapy, using appropriate a/b ratios and T1/2 values
for tumor control and organs at risk. However, the un-
certainties in these endpoint-specific parameters
should always be carefully considered. Bioeffect calcu-
lations may be useful for decision support but should
not replace sound clinical judgment.
Numerical values of equieffective doses are mean-
ingful only to the extent that the following conditions
are fulfilled:
† the irradiation conditions selected for comparison
are accurately and completely specified. This
includes in particular: fractionation, dose rate, time
between fractions, overall time, radiation quality.
† the biological systems and endpoints for which
equieffective doses are estimated, are specified.
Different numerical values for equieffective doses
could be obtained for different biological systems or
effects and endpoints (e.g., late versus early effects).
† the tissue volume [e.g., GTV, HR CTV, IRCTV,
PTV, (see Section 5)] selected for evaluation of
the equieffective doses should be the same for
the compared techniques and should be specified.
Comparison of equieffective doses in a PTV or
OAR may be relevant for comparing the efficacies
of two treatments.
† the method used for prescribing or reporting the
dose is the same for the compared techniques and
is specified [e.g., the dose at a reference point or a
dose value specified on the DVH curve (e.g., D50,
D90, D98, or others)].
† the biological model used is valid for the dose and
fractionation schedule that is evaluated.
The assumption and methods used to fulfill these
five conditions should be clearly, precisely, and com-
pletely specified and reported, thus permitting the
evaluation of equieffective doses using different
biological and clinical hypotheses.
The determination of equieffective doses should
ideally include the effects of ALL treatment para-
meters and conditions (see Figure 7.5). When the
treatment is delivered using X Gy per fraction, the
formalism EQDX is adopted (Bentzen et al., 2012).
At present, the effects of fraction size, dose rate,
and, with higher uncertainties, interval between
pulses or fractions, and radiation quality are consid-
ered in the EQDX formalism. Even more uncertain-
ties become present, when the overall treatment
time is significantly changed since overall treatment
time is not included in the EQDX formalism; hence
this must be corrected for independently of the
EQDX formalism (Bentzen et al., 2012). The effect of
radiation quality is indirectly included via the a/b
value for a given endpoint.
Chemotherapy and biologically targeted response
modifiers may have an additive, synergistic, or pro-
tective effect and may have a differential effect on
tumors, early and late responding tissues and end-
points. These effects are not independent from each
other and their impact depends on the biological
system and endpoint under consideration. Although
attempts to include chemotherapy have been pub-
lished, none of these methods are currently safely to
be used in clinical practice (Bentzen et al., 1989b;
Jones and Dale, 2005).
7.6.4 Equieffective Dose and EQD2
Historically, the majority of patients treated cura-
tively with external photon beams receive fractions
Radiobiological Considerations
99
atUniversityofCalifornia,IrvineonSeptember9,2016http://jicru.oxfordjournals.org/Downloadedfrom](https://image.slidesharecdn.com/icru891-190321105446/85/Icru-89-115-320.jpg)
![of 2 Gy, 5 times a week. Considerable clinical experi-
ence has been accumulated with this schedule. It is
widely accepted as a reference by the radiation-
oncology community. Many relationships between
dose and the probability of a specific clinical outcome
are well established. This broad clinical experience
should not be neglected. Therefore, in external
photon-beam therapy for the majority of patients,
2 Gy photon fractions, 5 fractions per week has been
recommended (IAEA and ICRU, 2008) as a relevant
universal reference treatment schedule. However,
the use of the historical term iso-effective dose should
be discouraged and replaced by Equieffective Dose at
2 Gy per fraction or EQD2 (Bentzen et al., 2012).
EQD2 implies that when comparing two or more
radiation schedules, the reference treatment is
delivered using 2 Gy per fraction. It also presumes
that the LQ model (7.6.5) can be used safely to calcu-
late EQD2. For instance, for doses in excess of 6 Gy
to 10 Gy per fraction, the LQ model might not be
applicable.
The potential effect of variations in the overall
time is not taken into account in the EQD2 concept,
i.e., near similar overall treatment times are assumed.
When equieffective doses are calculated, it is
always necessary to indicate apart from physical
time-absorbed dose pattern also the parameters
(such as a/b values and T1/2) used for the mathemat-
ical modeling (see Section 7.6.5).
Absorbed dose D, equieffective dose, EQDX, and
EQD2 are all parameters expressed in Gy. Therefore,
when a dose is reported, the corresponding quantity,
unit, and parameters have all to be clearly specified
to avoid possible confusion (e.g., 10 Gy EQD2a/b, T1/2).
7.6.5 Combination of EBRT and
brachytherapy
Except for preoperative ICBT of cervix cancer
Stage Ib–IIb and radical ICBT in inoperable Stage
Ia, ICBT is always used as a boost treatment com-
bined with EBRT to the pelvis. Time–dose patterns
of both treatments should be taken into account to
calculate the combined effects to the tumor and
organs at risk. The EQD2 or EQDX formalism allows
for the addition of the effects of both techniques.
Figure 7.6 shows examples of the integration of
various HDR, LDR, and PDR ICBT schedules with
EBRT to the pelvis. The five examples that are pre-
sented are typical time–dose patterns used for the
treatment of locally advanced cervix carcinoma. In
all cases, the treatment includes 25 fractions of
1.8 Gy delivered in 5 fractions per week. The total
absorbed dose of 45 Gy delivered using 1.8 Gy frac-
tions corresponds to an EQD2 of 43.2 Gy assuming
a/b ¼ 3 Gy and 44.3 Gy assuming a/b ¼ 10 Gy.
External-beam radiation therapy is followed by or
mixed with different schedules of ICBT.
In two examples [Figure 7.6a and b], four ICBT
fractions of 7 Gy are delivered; they correspond to an
EQD2 of 56 Gy assuming a/b ¼ 3 Gy and 39.7 Gy
assuming a/b ¼ 10 Gy, respectfully.
In two examples [Figure 7.6c and d], PDR brachy-
therapy delivers 40 Gy in 80 pulses of 0.5 Gy in one
or two fractions. When two PDR courses of 40 pulses
are given (Figure 7.6c), the EQD2 values are
40.6 Gy for a/b ¼ 3 Gy, and 40.2 Gy for a/b ¼ 10 Gy
and T1
2 ¼ 1.5 h. When only one course of 80 pulses is
given (Figure 7.6d), the EQD2 of the single PDR is
41 Gy assuming a/b ¼ 3 Gy and 40.4 Gy assuming
a/b ¼ 10 Gy. This small increase in EQD2 when
compared with the 2 PDR course schedule is due to
the fact, that there is no full repair after pulse 40,
while this is the case after the first PDR course
when two courses are given.
In the fifth example (Figure 7.6e), continuous
LDR brachytherapy delivers 40 Gy at 0.5 Gy h21
.
This corresponds to an EQD2 of 40.8 Gy for a/b ¼
3 Gy and 40.4 Gy for a/b ¼ 10 Gy, the same T1
2 ¼
1.5 h value being assumed. The EQD2 values for
PDR and LDR are thus very close to each other if
the same T1
2 value is assumed.
As the EQD2 delivered by EBRT and brachyther-
apy are additive, when 4 fractions of 7 Gy are deliv-
ered, the total EQD2 is 99.2 Gy assuming a/b ¼
3 Gy and 84 Gy assuming a/b ¼ 10 Gy. For PDR, in
two courses, the total EQD2 is 83.8 Gy assuming a/
b ¼ 3 Gy, 84.5 Gy assuming a/b ¼ 10 Gy and for
PDR in 1 course, the total EQD2 is 84.2 Gy assum-
ing a/b ¼ 3 Gy, 84.7 Gy assuming a/b ¼ 10 Gy with
T1
2 ¼ 1.5. For LDR, the EQD2 are 84 and 84.7 Gy, re-
spectively.
The total EQD2 doses are thus similar for the five
schedules that are compared. The numerical values
of the EQD2 however strongly depend on (1) the
assumed a/b values and (2) in PDR and LDR also
on the assumed T1
2 value.
7.7 Recommended Common Terminology for
Reporting Dose–Time Parameters of
Combined EBRT and ICBT
In order to compare the biological effects of the
different dose rate and fractionation schedules that
are used in HDR, PDR, and LDR brachytherapy,
and also to make possible the comparison of the
absorbed doses delivered with brachytherapy and
external beam radiotherapy and allow them to be
simply added, the GEC-ESTRO recommendations
(Po¨tter et al., 2006) promote the use of the
EQD2 formalism proposed by Steel (Bentzen and
Baumann, 2002; Joiner and Bentzen, 2002; Steel,
PRESCRIBING, RECORDING, AND REPORTING BRACHYTHERAPY FOR CANCER OF THE CERVIX
100
atUniversityofCalifornia,IrvineonSeptember9,2016http://jicru.oxfordjournals.org/Downloadedfrom](https://image.slidesharecdn.com/icru891-190321105446/85/Icru-89-116-320.jpg)


![dose to the CTVIR. D98 % and D90 % are relevant dose
parameters for the GTVres. The equieffective dose cal-
culations for D50 % for the GTVres become unreliable
because they exceed the limits of the models currently
in use (see Section 7.6.4). As the experience with dose
values reported for the GTVres is limited, it is recom-
mended to keep D98 % as the primary parameter and
D90 % in the case of research-oriented analysis.
8.3.4 PTV for Brachytherapy
In photon EBRT, the common approach is to pre-
scribe the absorbed dose to the PTV with the as-
sumption that the margins included in the PTV will
result in the CTV receiving the prescribed absorbed
dose. In the case of homogeneous EBRT absorbed-
dose distributions, the absorbed dose in the CTV will
be similar to the absorbed dose in the PTV if CTV
movements are within the PTV. However, in brachy-
therapy, the situation is different due to the very
heterogeneous absorbed-dose distribution. If a PTV
margin is used around a CTV in intracavitary brachy-
therapy, the absorbed dose would be systematically
lower than the CTV absorbed dose because the PTV
represents a larger volume, part of which is more
distant from the sources (Tanderup et al., 2010c).
Also, uncertainties are different in intracavitary
brachytherapy (see Sections 5.4.6 and 5.5). Currently,
there appear no compelling reasons to introduce PTV
dose reporting in routine brachytherapy practice.
On the other hand, a pre-implantation PTV
concept could be used during implantation to ensure
that the applicator geometry results in a dose distri-
bution covering the entire brachytherapy CTV with
the appropriate absorbed dose (see Section 5.5.6). A
PTV in the cranio-caudal direction could also be used
for prescription to avoid a too-tight coverage at the
upper CTVHR, which might result in a geographical
miss due to applicator movements between imaging
and during absorbed-dose delivery (see Figure 5.17).
Further research might provide additional support to
use the PTV concept for dedicated treatment situa-
tions. However, for reporting, the CTV and not the
PTV is the primary target volume in intracavitary
brachytherapy because it represents a better esti-
mate of the dose delivered.
8.3.5 Lymph Nodes (D98 %)
Lymph nodes can or cannot receive significant
absorbed doses in brachytherapy, and that absorbed
dose can be of particular interest for analysis of recur-
rences. There is a significant brachytherapy absorbed-
dose gradient along the lymph-node chains, and
therefore, the brachytherapy absorbed dose is vari-
able within each lymph-node region (see also Section
10.1.5). It has been shown that the average absorbed
dose to the obturator and internal iliac lymph-node
regions is about from 15 % to 30 % of the absorbed
dose to Point A, while it is about from 10 % to 20 % in
the external iliac chain (Gebara et al., 2000; Lee et al.,
2009). In terms of EQD2, this amounts to from 4 Gy
to 8 Gy for obturator and internal iliac nodes and from
2 Gy to 6 Gy for external iliac lymph nodes in HDR
brachytherapy schedules with four brachytherapy
fractions, and total EQD2 dose of 85 Gy to the CTVHR.
If the CTVHR is treated by increasing the TRAK, than
this also leads to an increase in the dose in the lymph
nodes. The current recommendation is to report the
near-minimum dose, D98 %, for pathological lymph
nodes even if the relevance of such reporting has not
been validated. The median dose, D50 %, can be used
for research purposes.
For radiographic approximation, the concepts of
the lymphatic trapezoid and pelvic wall points can
be used as described in Section 10.1.5.
8.4 OAR: Dose-Point and Dose–Volume
Parameters
In the past, OAR dose constraints have often been
based on relative fractions of a prescribed absorbed
dose [e.g., two-third of the prescribed absorbed dose
at Point A allowed as maximum absorbed dose in the
rectum (Stitt et al., 1992)], or 150 % to the lateral
vaginal surface of the applicator (Nag et al., 2002). As
noted by the authors of these reports, such relative
absorbed-dose constraints cannot be used universally,
as changing the total target absorbed dose or chan-
ging the fractionation schedule directly influences
absorbed-dose constraints for OARs. To reach the
most valid, reliable, and reproducible OAR dose as-
sessment, dose-point, and dose–volume reporting of
dose values to absolute volumes is strongly suggested
in this report.
Analysis of the 3D dose distribution in an OAR
has been based on two approaches: using a relative
DVH in which the entire organ is contoured and the
doses relate to the fraction of the contoured volume,
and an absolute DVH in which the doses relate to
absolute volumes. Local pathologic-tissue altera-
tions in gynecologic brachytherapy, such as circum-
scribed inflammation and fibrosis, telangiectasia,
ulceration, necrosis, or fistula, occur mainly in those
volumes of hollow organs adjacent to the applicator
and exposed to high EQD2 (.from 70 Gy to 80 Gy)
to small volumes. Organ complications such as stric-
ture, stenosis, and functional impairments occur
mainly after irradiation of large organ volumes—
predominantly those including the whole circumfer-
ence of hollow organs—with intermediate-to-high
EQD2 (from 40 Gy to 65 Gy, or more) (see Sections
6.2 and 6.3).
PRESCRIBING, RECORDING, AND REPORTING BRACHYTHERAPY FOR CANCER OF THE CERVIX
110
atUniversityofCalifornia,IrvineonSeptember9,2016http://jicru.oxfordjournals.org/Downloadedfrom](https://image.slidesharecdn.com/icru891-190321105446/85/Icru-89-126-320.jpg)


![portion of the treatment alone (Lim et al., 2009). This
might be true also even for IMRT. Therefore, the V60
Gy is then very limited (see Figure 8.8 at the 10 %
volume level).
For strategies with inhomogeneous EBRT ab-
sorbed doses, such as with tumor boost, parametrial
boost, or simultaneous integrated lymph-node boost,
the sigmoid and rectum can receive significant add-
itional EBRT absorbed dose, increasing the amount
of the organ irradiated to intermediate doses [see
Figure 8.8 and Fenkell et al. (2011)]. Irradiated
volumes and intermediate absorbed-dose levels
should then be reported, such as VD starting from
45 Gy to 60 Gy and greater, or conversely to report
DV with V from 5 cm3
to 30 cm3
or as a fraction of
organ volume. These volumes are often spread over
the whole organ circumference and over a long part
of the rectum or sigmoid.
For the bladder, the situation is even less clear, and
the majority of studies have found no clear dose–
volume relationship for intermediate doses of EBRT in
bladder and prostate cancer (Viswanathan et al., 2010).
The bladder shape and volume is highly variable, with
changes in position, volume, and shape occurring
during a course of radiotherapy and even during ad-
ministration of a single fraction. This causes uncertain-
ties in the dose delivered, and the DVH from treatment
planning cannot be assumed to represent accurately
the absorbed dose delivered by EBRT (Lim et al., 2009).
However, in combinations of EBRT and brachytherapy
in cervical cancer, certain volume levels VD (D ! 40 Gy)
or certain dose levels DV (V ! 10 cm3
or V as a fraction
of the organ volume) can be indicated based on the
treatment–planning CT and ignoring the daily
changes during fractionated EBRT. This would at least
allow the determination of the amount of dose, mainly
from EBRT, given with some certainty to large bladder
volumes in different treatment schedules with varying
contributions from EBRT and brachytherapy. In the
future, IGRT with repetitive imaging in combination
with protocols for bladder filling and CT protocols simu-
lating the potential bladder-volume changes (Ahmad
et al., 2012) will contribute to reduce uncertainties.
As there is limited evidence for the validity of most
of these considerations with regard to intermediate
dose- and volume-assessment for combined EBRT
and brachytherapy in cervical cancer, the proposed
dose–volume parameters should be used with great
caution in routine clinical practice. They are elabo-
rated here to suggest routes for future clinical re-
search. It is desirable at present to report a variety of
dose–volume parameters in the intermediate-dose
regions and in larger organ volumes and to correlate
them with specific morbidity endpoints in order to de-
termine valid and predictive morbidity parameters
for treatment planning.
8.4.3 Vagina High-, Intermediate-, and Low-
Dose Regions, Points, Small and Large
Volumes
Radiotherapy-associated vaginal morbidity has been
investigated only to a limited extent. Recto-vaginal and
vesico-vaginal fistula, extensive vaginal stenosis, and
complete vaginal obliteration have represented the
major Grade 3 and Grade 4 events occurring in a
limited number of patients (Hintz et al., 1980).
Extensive stenosis and obliteration has been observed
in patients mainly with extensive vaginal disease
treated with brachytherapy to a large part of the
vagina (Barillot et al., 2000). On the other hand, in the
upper vagina near the vaginal sources, morbidity such
as adhesions, telangectasia, fragility (contact bleeding),
mucosal pallor, fibrosis, shortening, and partial obliter-
ation (Grade1 and 2 toxicity) have been described in a
large proportion of patients (see Figure 6.1)
(Kirchheiner et al., 2012b; 2014).
The vagina points located at the lateral vaginal-
applicator surface and at 5 mm depth into the lateral
walls of the vagina have traditionally been used for
vaginal-dose reporting. Dose–effect relationships
based on these points have not been well established,
and the points have served mainly as tools for pre-
scribing absorbed-dose constraints (Lee et al., 2012;
Viswanathan and Thomadsen, 2012; Viswanathan
et al., 2012b). There is evidence from evaluations of
patient cohorts from the EMBRACE trial that the
ICRU rectal point can be reliably used for a dose–re-
sponse analysis for vaginal shortening and therefore
can serve as surrogate point (recto-vaginal reference
point) to predict vaginal morbidity (Kirchheiner
et al., 2016).
Implementation and evaluation of valid and reliable
dose–volume parameters for the high-absorbed-dose
region in the vagina (D0:1cm3 and D2cm3 ) are challenging
due to the very high absorbed-dose gradients near the
vaginal sources and the difficulties of precisely delin-
eating and reconstructing the thin organ walls on 3D
images with the applicator in place, using the currently
available treatment–planning systems (Berger et al.,
2007). No clear recommendations for dose–volume
parameters relevant for morbidity in the vagina have
been developed so far. The dose–volume parameter
D2cm3 does not correlate with vaginal side effects in in-
dividual patients with cervical cancer treated within a
defined treatment protocol with very high brachyther-
apy doses (Fidarova et al., 2010). Dose–volume para-
meters for larger vaginal volumes (e.g., 5 cm3
or
10 cm3
) have not been investigated so far.
Despite limited evidence and progress in vaginal-
morbidity analysis so far, a dose–volume or a dose–
surface concept for treatment planning and reporting
is, in principle, suggested here based on contouring
Dose and Volume Parameters
115
atUniversityofCalifornia,IrvineonSeptember9,2016http://jicru.oxfordjournals.org/Downloadedfrom](https://image.slidesharecdn.com/icru891-190321105446/85/Icru-89-131-320.jpg)
![the whole vagina as a wall structure with a certain
thickness or as a surface structure. It can be assumed,
for obvious reasons, that late vaginal morbidity is
related to the different doses applied to different
vaginal parts, areas, and volumes. Figure 8.10 shows
an example of an absorbed-dose plot for the vaginal
surface. As for other OAR, it is recommended that re-
search should aim at the implementation of a dose–
surface histogram (DSH) approach, with absolute
values for planning and reporting vaginal dose based
on an appropriate vaginal contouring, both for high
doses in small volumes and intermediate and lower
doses in larger volumes related to anatomical vaginal
regions. VD parameters with D from 5 Gy to 150 Gy
EQD2, DV parameters with V from 0.1 cm3
to 10 cm3
,
or certain fractions can serve to quantify the DVH. In
cases in which DSHs are applied, DAwith A indicating
representative areas can be reported.
Research and development have to provide the ap-
propriate approaches to reduce relevant uncertain-
ties both in contouring and in dose and volume
assessment. Such approaches might be in the form
of software-based methods to automatically delin-
eate a surface around the vaginal packing, which
can be used to calculate DSHs and dose maps, and
which would then include the entire dose informa-
tion for the vaginal wall.
Following a long tradition, it is recommended to
report the absorbed dose at points at a 5 mm depth
lateral at the level of the vaginal sources, identical
to the approach recommended for dose reporting
when using radiographic localization (see Section
10.2). A high correlation between absorbed dose to
the surface and absorbed-dose points 5 mm deep
and absorbed-dose parameters for limited volumes
(e.g., D0:1cm3 and D2cm3 ), has been described based on
automatic contouring around the vaginal sources,
assuming a certain thickness of the vaginal wall
(Trnkova´ et al., 2014). Therefore, it is likely that
these points will provide reasonable information for
the high-dose area around the vaginal sources.
Because of the inhomogeneous absorbed-dose dis-
tribution around the vaginal sources, the absorbed
dose to the lateral dose points is usually very differ-
ent from absorbed doses to points located in the an-
terior or posterior direction from the vaginal sources
(see Figure 8.10). For ring applicators, the absorbed
dose at anterior and posterior points will usually be
lower, due to the lateral loading. In ovoids, the
absorbed dose on the anterior or posterior vaginal
surface might be higher than in the lateral direction,
depending on the contribution and position of the
tandem and the distance from the active dwell posi-
tions to the anterior or posterior ovoid surface. Thus,
points, while useful for dosimetric control, serve as
poor surrogates for the entire vaginal-surface
absorbed-dose distribution. This might explain the
lack of definitive relations between the absorbed
dose to vaginal points and toxicity endpoints.
In conclusion, future research should aim to develop
automatically generated contours around the vaginal
applicators and along the whole vaginal surface, ex-
cluding the packing, for DSH/DVH evaluation. Such
methods would detect all locations of high and low
dose throughout the vagina. The whole of this dosi-
metric and volumetric information, together with
topographic correlation, might be critical for finding
parameters to predict vaginal morbidity.
Based on radiographic localization, the length of
the vagina irradiated to certain absorbed-dose levels
has been shown to be a surrogate for the vaginal
volume and has been reported to predict major
vaginal morbidity (Barillot et al., 2000). Therefore, it
is recommended to analyze the dose profile from
EBRT and brachytherapy along the vaginal axis. An
example of such a dose profile is shown in Figure 8.11.
The length along the vaginal axis corresponding to
a certain dose can be measured from such dose pro-
files. In order to further assess the intermediate- and
low-dose regions in the vagina, anatomical reference
points along the vaginal axis can serve as surrogates
for the dose distribution in the vaginal wall: one at
the mid-vagina [posterio-inferior border of the sym-
physis (PIBS) þ 2 cm], one at the transition from
mid- to lower vagina (PIBS), and one at the lower
Figure 8.10. Plot of brachytherapy surface absorbed dose for the
vagina using a ring applicator, frontal view. The absorbed-dose
variation is high around the circumference at the level of the
vaginal sources (ring: from 200 % to 100 % lateral in small areas,
50 % to 70 % anterior and posterior in large areas) and along the
axis in the cranio-caudal direction, with from 30 % to 80 % in the
mid-vagina and less than from 10 % to 30 % in the lower vagina
(compare Figure 8.11).
PRESCRIBING, RECORDING, AND REPORTING BRACHYTHERAPY FOR CANCER OF THE CERVIX
116
atUniversityofCalifornia,IrvineonSeptember9,2016http://jicru.oxfordjournals.org/Downloadedfrom](https://image.slidesharecdn.com/icru891-190321105446/85/Icru-89-132-320.jpg)
![region of the vagina (PIBS – 2 cm) (Westerveld et al.,
2013). These points have been defined anatomically
and reproducibly both for EBRT and for brachyther-
apy. Figure 8.12 shows a schematic diagram for this
approach. These points serve as anatomical reference
points both for brachytherapy and for EBRT and
should be reported separately, and the doses added.
For the mid-vaginal point that is at from 3 cm to 5 cm
into the dose profile (see Figure 8.11), the dose from
EBRT is constant (prescribed dose), and variations
are determined by the brachytherapy dose. The dose
to the lower vaginal points (PIBS and PIBS22 cm)
depends mainly on the location of the lower field
border of EBRT and inter-fraction variations, and is
constantly low and almost independent of brachy-
therapy if the vaginal length during brachytherapy is
!5 cm–6 cm and is not treated explicitly by brachy-
therapy. However, the impact of brachytherapy dose
to the lower parts of the vagina can increase substan-
tially if the vagina is short (see Figure 6.4), the
vaginal source is not placed at the vaginal apex, or if
the vagina is treated due to involvement of disease.
The situation is very different if the mid- and lower
vagina form part of the CTVHR due to suspected re-
sidual disease, and the usual vaginal applicators have
to be replaced with cylinders. In these cases, while the
target dose is included in CTVHR dose reporting, the
vaginal-surface dose along the applicator has to be
given with much more detail in the spatial distribution,
including high-dose regions along the circumference of
the cylinder surface (see Figure 8.12, cross sections).
8.4.4 Other OAR
In addition to the OARs discussed above, there
are other normal-tissue structures of interest, such
as ureter, anal canal, ovaries, urethra, large vessels,
large nerves, connective tissue, bone and bone marrow,
lymph vessels, and lymph nodes. Due to limitations in
imaging and knowledge, identifying and contouring
and defining dose–volume constraints of these struc-
tures is not straightforward. Consequently, further
imaging, contouring, treatment planning, and clinical
research is needed to link potential dose–volume para-
meters to morbidity outcome.
Figure 8.11. Illustration of vaginal dose profiles for two different cases, showing the contribution of EBRT and brachytherapy dose to the
total EQD2. The x-axis starts at the upper vaginal surface and continues in the caudal direction along the central axis of the vagina.
Posterio-inferior border of the symphysis (PIBS) and PIBS+2 cm points are shown. At the level of the ring-source path, a point (green) at
5 mm depth is indicated. The left case (PIBS) illustrates a representative situation with the lower field border of EBRT located close to PIBS.
The right case shows a situation with PIBS very close to the ring applicator. Definition of PIBSþ2 cm is not applicable anymore.
External-beam radiation therapy dose is substantially higher at PIBS as well as PIBS22 cm compared with the case at the left [from
Westerveld et al. (2013)].
Dose and Volume Parameters
117
atUniversityofCalifornia,IrvineonSeptember9,2016http://jicru.oxfordjournals.org/Downloadedfrom](https://image.slidesharecdn.com/icru891-190321105446/85/Icru-89-133-320.jpg)
![8.5 Specific Issues in Dose–Volume
Reporting for the Combination of EBRT
and Brachytherapy
The simple addition of absorbed doses from EBRT
and from brachytherapy is not meaningful because of
the different biological effectiveness associated with
their delivery. Therefore, assessment of the total
equieffective dose from EBRT and brachytherapy
involves two steps: (1) the calculation of absorbed
dose to points, volumes, voxels, or regions from each
fraction of EBRT and brachytherapy; (2) the applica-
tion of the EQD2 or some other appropriate formal-
ism on a point-by-point basis for dose summation (see
Section 7.6). In principle, deformable registration
could match each tissue voxel irradiated by each frac-
tion of external-beam radiation with the correspond-
ing voxel irradiated by each fraction of brachytherapy
(see Section 9.4). However, currently no deformable-
registration program is capable of tracking the loca-
tion and dose-exposure history of relevant biological
structures within the target volumes and OAR.
Currently, some simplifications and assumptions are
therefore suggested, which can be replaced by more
appropriate approaches as this becomes technically
feasible. These assumptions are suited for several
scenarios for typical treatment conditions. First, it
can be assumed that the organ walls adjacent to the
applicator receiving a high brachytherapy absorbed
dose (such as D0:1cm3 and D2cm3 ) are irradiated with
the full absorbed dose of external-beam therapy, if an
EBRT technique is applied with a homogeneous
absorbed-dose plateau (e.g., a four field box). Such an
assumption is not necessarily valid for the parts of
organ walls at a greater distance from the brachy-
therapy applicator. Furthermore, the assumption
might be less valid for techniques such as IMRT or
intensity-modulated arc therapy (IMAT or VMAT)
that can produce more-pronounced absorbed-dose
gradients in those regions of OARs irradiated to high
absorbed dose during brachytherapy. It follows that
care should be taken that hot spots from IMRT/IMAT
treatment plans should not coincide with the high-
dose regions from brachytherapy. If boosts are given
as part of the EBRT, a specific analysis of possible
overlap of brachytherapy and EBRT dose distribu-
tions must be performed, as additional dose to
CTVHR, CTVIR, or OAR structures can be significant
(Van de Kamer et al., 2010). Evaluation of total dose
is particularly challenging when a midline block or
parametrial boost is used, because large gradients in
the absorbed dose from both the EBRT and brachy-
therapy are present in the same regions (Tamaki et
al., 2015). It has been shown that midline-blocked
fields do not predictably protect OARs (D2cm3 ), nor do
they predictably contribute absorbed dose to the
CTVHR or CTVIR (Fenkell et al., 2011).
A second assumption used for combining doses
from EBRTand brachytherapy is related to accumula-
tion of dose from succeeding brachytherapy fractions.
Figure 8.12. Sagittal views showing the vagina at the time of EBRT and at brachytherapy with an intracavitary applicator in place. At the
level of the vaginal source, dose points lateral to the rings or ovoids can be defined at 0 mm and 5 mm from the applicator surface. Three
additional points are defined along the central axis of the vagina in the cranio-caudal direction. The PIBS vaginal-dose point was defined
2 cm posterior from the posterior-inferior border of the pubic symphysis and for brachytherapy at the point of this line where it crosses the
applicator tandem. From there, two additional points 2 cm up and down along the vaginal axis are defined with PIBSþ2 representing the
mid of the vagina and PIBS22 representing the introitus level [from Westerveld et al. (2013)].
PRESCRIBING, RECORDING, AND REPORTING BRACHYTHERAPY FOR CANCER OF THE CERVIX
118
atUniversityofCalifornia,IrvineonSeptember9,2016http://jicru.oxfordjournals.org/Downloadedfrom](https://image.slidesharecdn.com/icru891-190321105446/85/Icru-89-134-320.jpg)


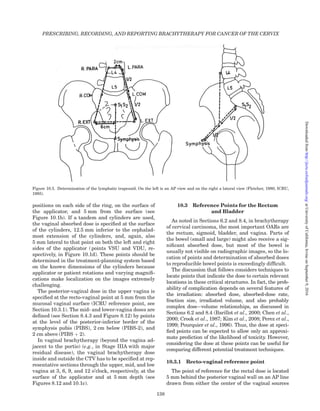
![or the inferior extremity of the uterine source, which-
ever location gives the higher absorbed dose (see
Figure 10.6). This point can be determined in the
treatment-planning system (see Section 9.3) or on or-
thogonal radiographic images. The posterior vaginal
wall can be visualized with an intravaginal mold, by
opacification of the vaginal cavity with radio-opaque
gauze used for packing, or by a retractor. As noted in
Section 10.1, localization of this point on stereo-shift
images is ambiguous.
Contrast in the rectum assists in verifying the
point selected. A common practice is to inject a 50 %
diluted solution of barium contrast and then with-
drawing as much as possible, leaving the rectal wall
semiopacified.
Radio-opaque markers in the rectum are not recom-
mended. Flaccid markers, such as chains, lie against
the posterior rectal wall, which is not of interest, and
rigid markers tend to distort the rectal-wall position.
In vivo dosimetry has problems similar to radio-
opaque markers in keeping the dosimeter in contact
with the anterior rectal wall. Also, due to the thick-
ness of the dosimeter, the in vivo absorbed dose will
also not reflect the absorbed dose to the most irra-
diated part of the anterior rectal wall (Tanderup et al.,
2006).
As indicated in Section 10.2, this point is also rep-
resentative for the upper vaginal absorbed dose, and
becomes therefore the recto-vaginal reference point.
10.3.2 Bladder reference point
The bladder reference point is related to a caudally
retracted Foley balloon in the trigone of the bladder.
Recommendations are that the balloon be filled with
approximately 7 cm3
of diluted radio-opaque fluid
with the catheter pulled outwards and fixed to bring
the balloon in reproducible contact with the bladder
neck. If the balloon is nearly in the center of patient,
the reference point is taken as the posterior-most
point on the surface of the balloon (see Figure 10.6).
This can be accomplished either in the treatment-
planning system or on orthogonal radiographic
images; again, localization on stereo-shift images is
difficult due to the ambiguities in finding the identical
point on each of the images.
The aggregate experience with this bladder point
comes from patients for whom most often the balloon
is situated close to the midline. If the balloon is lateral
to the centers of the colpostats, the absorbed dose at
the point as described is likely to be less than else-
where on the balloon surface closer to the applicator.
The bladder point does not necessarily represent the
maximum absorbed dose in the trigone of the bladder
in a given patient.
10.3.3 Clinical relevance of the bladder and
rectal reference points
Although they are not identical, there is in general
a significant correlation between the ICRU reference-
point absorbed dose for the rectum and the rectal
D2cm3 : however, a considerable variation exists among
individual patients, which means that ICRU point
absorbed doses are not a good predictor of D2cm3 in the
individual patient (Figure 10.7). Based on data from
400 patients treated at 19 different institutions
[EMBRACE study (EMBRACE, 2015)], the ICRU
rectal absorbed dose is, on average, approximately 20
% larger than the rectum D2cm3 with a standard devi-
ation of 40 %. The absorbed dose at the ICRU bladder
point is on average approximately 20 % smaller than
the bladder D2cm3 and is associated with a standard
deviation of 32 %. Because of these findings, dose con-
straints based on the reference dose points cannot be
translated directly into D2cm3 constraints.
A significant number of clinical observations
support a correlation between rectal complications
and the absorbed dose at the ICRU rectal reference
point (Barillot et al., 2000; Crook et al., 1987; Georg
et al., 2011; Koom et al., 2007; Perez et al., 1999;
Pourquier et al., 1996; Stryker et al., 1988). A correl-
ation was also shown between the absorbed dose at
Point A and the absorbed dose at the rectal reference
point and rectal complications (Perez et al., 1999). In
contrast, the ICRU bladder reference point, although
simple to find and easily reproducible, does not correl-
ate well with bladder complications (Stryker et al.,
1988). Many, but not all, of the reports concluded that
the orthogonal-film technique was adequate for asses-
sing the maximum rectal absorbed dose but that for
Figure 10.6. Determination of the reference points for the
bladder and rectum (Chassagne and Horiot, 1977; ICRU, 1985).
The ICRU-rectum reference point (ICRU, 1985) is in this report
called the ICRU-recto-vaginal reference point.
Radiographic Dose Assessment
139
atUniversityofCalifornia,IrvineonSeptember9,2016http://jicru.oxfordjournals.org/Downloadedfrom](https://image.slidesharecdn.com/icru891-190321105446/85/Icru-89-155-320.jpg)


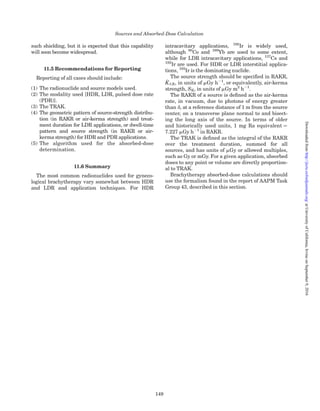


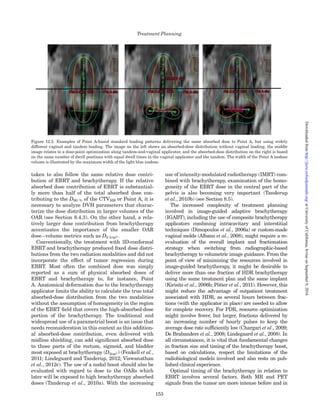


![Evaluated at r
: ð11:7Þ
When using sources for which the orientation is
unknown, for example, permanent sources for which
no current imaging modality can distinguish the
axial direction, the point approximation would be
appropriate. In that case, the absorbed-dose equa-
tion becomes
_DpðrÞ ¼ _Kd;R Â 1m2
 L Â
1 cm2
ðrÞ2
 gpðrÞ
 fðrÞ; ð11:8Þ
where the radial dose function is calculated using
the point-source approximation for the geometry
function,
gpðrÞ ¼
_DðrÞ ðrÞ2
_Dðr ¼ 1 cmÞ
; ð11:9Þ
and f(r) represents the 4p average of the anisotropy
function,
fðrÞ ¼
Ðp
0
_Dðr; uÞ Â sinðuÞ Â du
2 _Dðr; u ¼ p=2Þ
: ð11:10Þ
With gynecological brachytherapy, the point ap-
proximation applies in very few situations, and the
line model is used in most situations.
11.4.2 Inhomogeneity Correction and
Applicator Influences on the Absorbed Dose
The absorbed-dose-calculation formalism pre-
sented above assumes all space is filled with water.
Other approaches to dose calculation account for the
true composition of the patient’s anatomy and of the
applicators. Although used in research for decades,
they are just beginning to be incorporated into com-
mercial treatment–planning systems. Examples of
such approaches include Monte Carlo simulations
and discrete-ordinance methods. Thomadsen et al.
(2008) present a concise summary of inhomogeneity
corrections in brachytherapy, and the American
Association of Physicists in Medicine have issued a
report on the topic (Beaulieu et al., 2012). In a
patient, most of the tissues differ little from water
except for the bone and lung, which largely fall
outside the volume of greatest interest in cervical
cancer. Anatomic variations produce little change in
the absorbed-dose distributions from the high-
energy sources used in cervical brachytherapy.
However, many applicators contain metal parts with
high-atomic-number components that can distort
distributions compared with calculations assuming
a water medium. At the time of this writing, most
treatment-planning systems have just introduced
the capability to make corrections for inhomogene-
ities. The effect of attenuation by the applicator and/
or by the sources might be more noticeable in the
regions close to the axis of the applicator, for
example, at rectum reference points close to the axes
of vaginal ovoid sources. In practice, the attenuation
by a thin applicator wall has a limited effect.
Applicators containing shielding material to reduce
the absorbed dose in normal tissues [e.g., tungsten
disks in ovoid applicators, are used to limit the rectum
or bladder absorbed dose (see Section 3.4.3) and mark-
edly perturb the absorbed-dose distributions]. At the
time of this writing, only two known commercial treat-
ment–planning systems can make corrections for
PRESCRIBING, RECORDING, AND REPORTING BRACHYTHERAPY FOR CANCER OF THE CERVIX
148
atUniversityofCalifornia,IrvineonSeptember9,2016http://jicru.oxfordjournals.org/Downloadedfrom](https://image.slidesharecdn.com/icru891-190321105446/85/Icru-89-174-320.jpg)
![such shielding, but it is expected that this capability
will soon become widespread.
11.5 Recommendations for Reporting
Reporting of all cases should include:
(1) The radionuclide and source models used.
(2) The modality used [HDR, LDR, pulsed dose rate
(PDR)].
(3) The TRAK.
(4) The geometric pattern of source-strength distribu-
tion (in RAKR or air-kerma strength) and treat-
ment duration for LDR applications, or dwell-time
pattern and source strength (in RAKR or air-
kerma strength) for HDR and PDR applications.
(5) The algorithm used for the absorbed-dose
determination.
11.6 Summary
The most common radionuclides used for gyneco-
logical brachytherapy vary somewhat between HDR
and LDR and application techniques. For HDR
intracavitary applications, 192
Ir is widely used,
although 60
Co and 169
Yb are used to some extent,
while for LDR intracavitary applications, 137
Cs and
192
Ir are used. For HDR or LDR interstitial applica-
tions, 192
Ir is the dominating nuclide.
The source strength should be specified in RAKR,
_Kd;R, in units of mGy h21
, or equivalently, air-kerma
strength, SK, in units of mGy m2
h21
.
The RAKR of a source is defined as the air-kerma
rate, in vacuum, due to photons of energy greater
than d, at a reference distance of 1 m from the source
center, on a transverse plane normal to and bisect-
ing the long axis of the source. In terms of older
and historically used units, 1 mg Ra equivalent ¼
7.227 mGy h21
in RAKR.
The TRAK is defined as the integral of the RAKR
over the treatment duration, summed for all
sources, and has units of mGy or allowed multiples,
such as Gy or mGy. For a given application, absorbed
doses to any point or volume are directly proportion-
al to TRAK.
Brachytherapy absorbed-dose calculations should
use the formalism found in the report of AAPM Task
Group 43, described in this section.
Sources and Absorbed-Dose Calculation
149
atUniversityofCalifornia,IrvineonSeptember9,2016http://jicru.oxfordjournals.org/Downloadedfrom](https://image.slidesharecdn.com/icru891-190321105446/85/Icru-89-175-320.jpg)


![This section focuses on several steps of treatment
planning, both at the overall strategic level and for
optimization of the individual brachytherapy appli-
cation. As illustrated in Figure 12.1, decisions at
each step are critically linked to all previous levels of
treatment planning. Pre-defined planning aims and
dose constraints for the entire treatment (EBRT and
brachytherapy) are essential to guide the specific
treatment planning of each brachytherapy applica-
tion for which (1) a set of target volumes and
intended dose aims together with dose constraints
for the OAR are defined, (2) the brachytherapy
implant geometry is established, and (3) the
absorbed-dose distribution is optimized to finally
arrive at a dose prescription.
Brachytherapy offers many opportunities to
achieve defined dose-planning aims. Variations of
the time–dose pattern (absorbed-dose rate, fraction-
ation) allow modification of the therapeutic window
to deliver an optimal absorbed dose for the targets
while sparing the OAR. Absorbed-dose delivery is
performed via applicators, which provide the possi-
bility for remote afterloading of the radioactive
sources. Treatment planning is specific to the appli-
cator type and location. The decision on the implant
geometry and the definition of the dose-fractionation
schedule are closely linked. Knowledge about
the OAR close to the target volume can influence
the choice of a specific fractionation schedule.
After planning the time–dose pattern and the appli-
cation geometry, the next step for stepping-source
brachytherapy [both pulsed dose rate (PDR) and
high-dose rate (HDR)] includes the determination of
dwell positions inside the applicators and their
respective dwell times. For low-dose-rate (LDR)
brachytherapy, the choices for such optimization are
often fairly limited, with the treatment time being
the same for sets of sources.
12.1 Combining EBRT and Brachytherapy:
Dose and Fractionation Strategies
Clinical evidence supports the concept that defini-
tive radiotherapy in gynecological malignancies
should involve a combination of EBRT and brachy-
therapy to ensure optimal regional and local control
and survival (Barraclough et al., 2008; Beadle et al.,
2010; Gerbaulet et al., 2002a; Han et al., 2003; Lim
and Sia, 2012). The whole pelvis is often treated
with EBRT to 45 Gy–50 Gy at 1.7 Gy/fraction–
2.0 Gy/fraction, sometimes with midline blocking
after about 30 Gy of the portion of the field irradiat-
ing tissues assumed to receive high absorbed doses
from the brachytherapy. Brachytherapy is added to
reach total EQD2 values in the range of from 75 Gy
to 95 Gy for the D90 % of the CTVHR (Gerbaulet
et al., 2002a; Haie-Meder et al., 2005; Po¨tter et al.,
2006).
Within many traditional approaches, the contri-
bution to Point A from brachytherapy was most
pronounced in early disease, whereas, in advanced
disease, EBRT delivered a higher proportion of the
dose. Current evidence from image-guided adaptive
brachytherapy questions this approach because the
relative dose contribution from EBRT and brachy-
therapy seems to give an optimal therapeutic ratio
if approximately half the EQD2 contribution is
delivered by each modality, reaching a D90 % in the
CTVHR of about 90 Gy EQD2 (Lindegaard et al.,
2013; Logsdon and Eifel, 1999; Po¨tter et al., 2011).
Attempts to replace the brachytherapy boost with
advanced robotic EBRT or particle therapy have so
far not produced a similarly favorable dose distri-
bution, generally struggling to achieve the high
dose in the center of the cervix without a signifi-
cant increase in the pelvic volume outside the
primary tumor target receiving a high dose
(Assenholt et al., 2008; Georg et al., 2008). The
relative dose contribution from EBRT and brachy-
therapy is also important when selecting EQD2
constraints for certain volumes of OAR, as chan-
ging the dose contribution of EBRT compared with
brachytherapy will significantly influence the
dose–effect curves for an OAR, mostly because of
volume effects. Thus, if dose–volume histograms
(DVH) constraints for total-EQD2 values are
applied directly from the literature, care should be
Figure 12.1. Hierarchy of action levels involved in the planning
and prescription of combined EBRT and brachytherapy in locally
advanced cervical cancer.
PRESCRIBING, RECORDING, AND REPORTING BRACHYTHERAPY FOR CANCER OF THE CERVIX
152
atUniversityofCalifornia,IrvineonSeptember9,2016http://jicru.oxfordjournals.org/Downloadedfrom](https://image.slidesharecdn.com/icru891-190321105446/85/Icru-89-178-320.jpg)


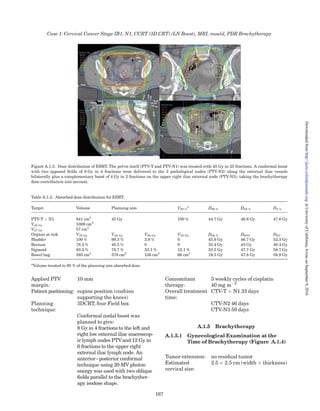


![13. Summary of the Recommendations
A short summary of the report recommendations
in tabular form is provided below as an overview
of the most essential conditions and parameters fun-
damental for reporting. More detailed tabular sum-
maries are provided at the end of the Sections 5
through 8, 10, and 11. Recommended reporting is
structured using a “level” approach:
Level 1 describes the minimum requirements that
should be followed at all centers, for all patients, and
represents the minimum standard of treatment;
Level 2 indicates advanced standards of dose planning
and treatment that allows a more comprehensive
and standardized exchange of information between
centers and is based on a more complete set of para-
meters;
Level 3 describes new forms of planning and treat-
ment largely related to research and develop-
ment for which reporting criteria are yet to be
established.
Level 1: Minimum standard for reporting
Volumetric-imaging approximation based on: Radiographic approximation based on:
† Comprehensive clinical gynecologic examination
† Volumetric imaging (MR, CT, US, PET–CT) at the time of
diagnosis and brachytherapy
† Comprehensive clinical gynecologic examination
† Radiographic imaging (plus additional volumetric 3D imaging
if available)
FIGO/TNM stage
Baseline morbidity and QoL assessment
Schematic 3D documentation on a clinical diagram indicating
dimensions (width, thickness, height) and volumes for:
† GTVinit (the GTVat diagnosis)
† GTVres (the GTVat brachytherapy)
† CTVHR [the GTVres (if present) plus residual pathologic tissue
(if present) plus whole cervix]
† (CTVIR: area of GTVinit and/or CTVHR plus safety margin if
used for prescription)
Dose reporting:
† TRAK
† Point A dose
† Recto-vaginal reference-point dose
† D0:1cm3 and D2cm3 for the bladder and rectum
Dose delivery pattern:
† Absorbed-dose rate/dose per fraction
† Number of fractions
† Time between fractions
† (Pulse number, size, time, if PDR)
† Overall treatment time
† Total EQD2 dose
Source and dose calculation:
† Radionuclide and source model
† Source strength
† Dose-calculation algorithm
FIGO/TNM stage
Baseline morbidity and QoL assessment
Schematic 3D documentation on a clinical diagram indicating
dimensions [width, thickness, (height)] and volumes for:
† GTVinit (the GTVat diagnosis)
† GTVres (the GTVat brachytherapy)
† CTVHR [the GTVres (if present) plus residual pathologic tissue
(if present) plus whole cervix]
† (CTVIR: area of GTVinit and/or CTVHR plus safety margin if
used for prescription)
Dose reporting:
† TRAK
† Point A dose
† Recto-vaginal reference-point dose
† Bladder reference-point dose
Dose delivery pattern:
† Absorbed-dose rate/dose per fraction
† Number of fractions
† Time between fractions
† (Pulse number, size, time, if PDR)
† Overall treatment time
† Total EQD2 dose
Source and dose calculation:
† Radionuclide and source model
† Source strength
† Dose-calculation algorithm
Journal of the ICRU Vol 13 No 1–2 (2013) Report 89 doi:10.1093/jicru/ndw015
Oxford University Press
# International Commission on Radiation Units and Measurements 2016
atUniversityofCalifornia,IrvineonSeptember9,2016http://jicru.oxfordjournals.org/Downloadedfrom](https://image.slidesharecdn.com/icru891-190321105446/85/Icru-89-187-320.jpg)


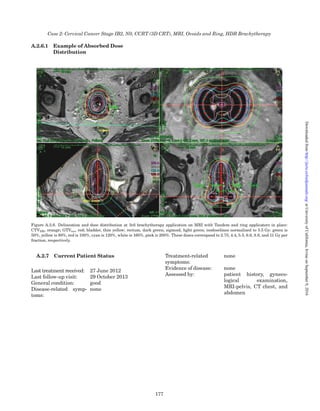


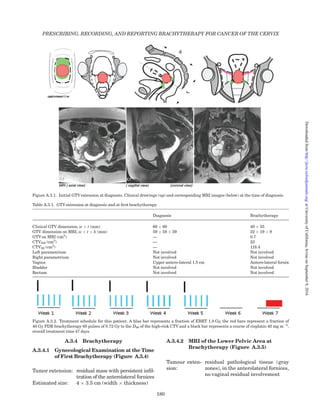


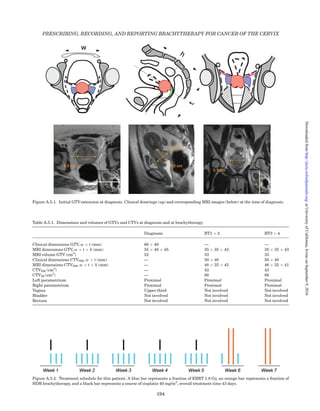


![and intracavitary radiation sources. II. Mathematical
and computational aspects,” Am. J. Roentgenol.
Radium Ther. Nucl. Med. 102, 673–676.
BCRU (1984). “British Committee on Radiation Units and
Measurements. Specification of brachytherapy sources,”
Br. J. Radiol. 57, 941–942.
Beadle, B.M., Jhingran, A., Salehpour, M., Sam, M., Iyer,
R.B. and Eifel, P.J. (2009). “Cervix regression and
motion during the course of external beam chemoradia-
tion for cervical cancer,” Int. J. Radiat. Oncol. Biol.
Phys. 73, 235–241.
Beadle, B.M., Jhingran, A., Yom, S.S., Ramirez, P.T. and
Eifel, P.J. (2010). “Patterns of regional recurrence
after definitive radiotherapy for cervical cancer,”
Int. J. Radiat. Oncol. Biol. Phys. 76, 1396–1403.
Beaulieu, L., Carlsson Tedgren, A., Carrier, J-F., Davis,
S.D., Mourtada, F., Rivard, M.J., Thomson, R.M.,
Verhaegen, F., Wareing, F.T. and Williamson, J.F.
(2012). “Report of the Task Group 186 on Model-Based
Dose Calculation Methods in Brachytherapy Beyond
The TG-43 Formalism: Current Status and
Recommendations for Clinical Implementation.” Med.
Phys. 39, 6208–6236.
Bedford, J.S. and Hall, E.J. (1966). “Threshold hypoxia:
its effect on the survival of mammalian cells irradiated
at high and low dose-rates,” Br. J. Radiol. 39, 896–900.
Beiner, M.E. and Covens, A. (2007). “Surgery insight:
radical vaginal trachelectomy as a method of fertility
preservation for cervical cancer,” Nat. Clin. Pract.
Oncol. 4, 353–361.
Benedetti-Panici, P., Maneschi, F., Scambia, G., Greggi, S.,
Cutillo, G., D’Andrea, G., Rabitti, C., Coronetta, F.,
Capelli, A. and Mancuso, S. (1996). “Lymphatic spread
of cervical cancer: an anatomical and pathological study
based on 225 radical hysterectomies with systematic
pelvic and aortic lymphadenectomy,” Gynecol. Oncol.
62, 19–24.
Bentivegna, E., Uzan, C., Gouy, S., Leboulleux, S., Duvillard,
P., Lumbroso, J., Haie-Meder, C., Schlumberger, M. and
Morice, P. (2010). “Correlation between [18f]fluorodeoxy-
glucose positron-emission tomography scan and histology
of pelvic nodes in early-stage cervical cancer,” Anticancer
Res. 30, 1029–1032.
Bentzen, S.M. (1993). “Quantitative clinical radiobiology,”
Acta Oncol. 32, 259–275.
Bentzen, S.M. and Baumann, M. (2002). “The linear-
quadratic model in clinical practice,” pp. 134–146 in
Basic Clinical Radiobiology, 3rd ed., Steel, G.G., Ed.
(Oxford University Press, London).
Bentzen, S.M. and Joiner, M.C. (2009). “The linear quad-
ratic approach in clinical practice,” pp. 120–134 in
Basic Clinical Radiobiology, 4th ed., Joiner, M.C. and
van der Kogel, A., Eds. (CRC Press, Boca Raton,
Florida).
Bentzen, S.M. and Thames, H.D. (1991). “Clinical evi-
dence for tumor clonogen regeneration: interpretations
of the data,” Radiother. Oncol. 22, 161–166.
Bentzen, S.M., Overgaard, J., Thames, H.D., Overgaard,
M., Vejby Hansen, P., von der Maase, H. and Meder, J.
(1989a). “Clinical radiobiology of malignant melanoma,”
Radiother. Oncol. 16, 169–182.
Bentzen, S.M., Overgaard, M., Thames, H.D.,
Christensen, J.J. and Overgaard, J. (1989b). “Early and
late normal-tissue injury after postmastectomy radio-
therapy alone or combined with chemotherapy,”
Int. J. Radiat. Biol. 56, 711–715.
Bentzen, S.M., Saunders, M.I. and Dische, S. (1999). “Repair
halftimes estimated from observations of treatment-
related morbidity after CHART or conventional radiother-
apy in head and neck cancer,” Radiother. Oncol. 53,
219–226.
Bentzen, S.M., Agrawal, R.K., Aird, E.G., Barrett, J.M.,
Barrett-Lee, P.J., Bliss, J.M., Brown, J., Dewar, J.A.,
Dobbs, H.J., Haviland, J.S., Hoskin, P.J., Hopwood, P.,
Lawton, P.A., Magee, B.J., Mills, J., Morgan, D.A., Owen,
J.R., Simmons, S., Sumo, G., Sydenham, M.A., Venables,
K. and Yarnold, J.R. (2008). “The UK Standardisation of
Breast Radiotherapy (START) Trial A of radiotherapy
hypofractionation for treatment of early breast cancer: a
randomised trial,” Lancet Oncol. 9, 331–341.
Bentzen, S.M., Constine, L.S., Deasy, J.O., Eisbruch, A.,
Jackson, A., Marks, L.B., Ten Haken, R.K. and Yorke,
E.D. (2010). “Quantitative analyses of normal tissue
effects in the clinic (QUANTEC): an introduction to the
scientific issues,” Int. J. Radiat. Oncol. Biol. Phys. 76,
S3–S9.
Bentzen, S.M., Dorr, W., Gahbauer, R., Howell, R.W.,
Joiner, M.C., Jones, B., Jones, D.T., van der Kogel, A.J.,
Wambersie, A. and Whitmore, G. (2012). “Bioeffect mod-
eling and equieffective dose concepts in radiation oncol-
ogy—terminology, quantities and units,” Radiother.
Oncol. 105, 266–268.
Berger, D., Dimopoulos, J., Georg, P., Georg, D., Po¨tter, R.
and Kirisits, C. (2007). “Uncertainties in assessment of the
vaginal dose for intracavitary brachytherapy of cervical
cancer using a tandem-ring applicator,” Int. J. Radiat.
Oncol. Biol. Phys. 67, 1451–1459.
Berger, D., Dimopoulos, J., Po¨tter, R. and Kirisits, C.
(2009). “Direct reconstruction of the Vienna applicator
on MR images,” Radiother. Oncol. 93, 347–351.
Berger, D., Po¨tter, R., Dimopoulos, J.A. and Kirisits, C.
(2010). “New Vienna applicator design for distal para-
metrial disease in cervical cancer,” Brachytherapy 9,
S51–S52.
Beriwal, S., Bhatnagar, A., Heron, D.E., Selvaraj, R.,
Mogus, R., Kim, H., Gerszten, K., Kelley, J. and
Edwards, R.P. (2006). “High-dose-rate interstitial brachy-
therapy for gynecologic malignancies,” Brachytherapy 5,
218–222.
Beriwal, S., Demanes, D.J., Erickson, B., Jones, E., De Los
Santos, J.F., Cormack, R.A., Yashar, C., Rownd, J.J. and
Viswanathan, A.N. (2012a). “American Brachytherapy
Society consensus guidelines for interstitial brachyther-
apy for vaginal cancer,” Brachytherapy 11, 68–75.
Beriwal, S., Rwigema, J.C., Higgins, E., Kim, H., Houser,
C., Sukumvanich, P., Olawaiye, A., Richard, S., Kelley,
J.L., Edwards, R.P. and Krivak, T.C. (2012b). “Three-
dimensional image-based high-dose-rate interstitial
brachytherapy for vaginal cancer,” Brachytherapy 11,
176–180.
Bipat, S., Glas, A.S., van der Velden, J., Zwinderman,
A.H., Bossuyt, P.M. and Stoker, J. (2003). “Computed
PRESCRIBING, RECORDING, AND REPORTING BRACHYTHERAPY FOR CANCER OF THE CERVIX
234
atUniversityofCalifornia,IrvineonSeptember9,2016http://jicru.oxfordjournals.org/Downloadedfrom](https://image.slidesharecdn.com/icru891-190321105446/85/Icru-89-260-320.jpg)
![tomography and magnetic resonance imaging in
staging of uterine cervical carcinoma: a systematic
review,” Gynecol. Oncol. 91, 59–66.
Bipat, S., van den Berg, R.A., van der Velden, J., Stoker, J.
and Spijkerboer, A.M. (2011). “The role of magnetic res-
onance imaging in determining the proximal extension
of early stage cervical cancer to the internal os,”
Eur. J. Radiol. 78, 60–64.
Bjo¨rkholm, E. (1997). “The development of brachytherapy
and complementary external irradiation in the treat-
ment of cervical carcinoma Radiumhemmet, Stockholm
1910–1996,” pp. 71–76 in Integration of External Beam
Therapy and Brachytherapy in the Treatment of Cervix
Cancer: Clinical, Physical and Biological Aspects
(European Society for Radiotherapy and Oncology,
Brussels, Belgium).
Blasko, J.C., Grimm, P.D. and Ragde, H. (1993).
“Brachytherapy and organ preservation in the manage-
ment of carcinoma of the prostate,” Semin. Radiat.
Oncol. 3, 240–249.
Bosch, F.X., Lorincz, A., Munoz, N., Meijer, C.J. and Shah,
K.V. (2002). “The causal relation between human papil-
lomavirus and cervical cancer,” J. Clin. Pathol. 55,
244–265.
Boyle, P., Golia, S., Daly, P., Johnston, P.G. and Robertson,
C. (2003). “Cancer mortality in Ireland, 1926–1995,”
Ann. Oncol. 14, 323–332.
Brenner, D.J. (2008). “The linear-quadratic model is an ap-
propriate methodology for determining isoeffective
doses at large doses per fraction,” Semin. Radiat. Oncol.
18, 234–239.
Brixey, C.J., Roeske, J.C., Lujan, A.E., Yamada, S.D.,
Rotmensch, J. and Mundt, A.J. (2002). “Impact of
intensity-modulated radiotherapy on acute hematologic
toxicity in women with gynecologic malignancies,”
Int. J. Radiat. Oncol. Biol. Phys. 54, 1388–1396.
Brock, K.K. (2010). “Results of a multi-institution deform-
able registration accuracy study (MIDRAS),”
Int. J. Radiat. Oncol. Biol. Phys. 76, 583–596.
Brooks, S., Bownes, P., Lowe, G., Bryant, L. and Hoskin,
P.J. (2005). “Cervical brachytherapy utilizing ring appli-
cator: comparison of standard and conformal loading,”
Int. J. Radiat. Oncol. Biol. Phys. 63, 934–939.
Brooks, R.A., Rader, J.S., Dehdashti, F., Mutch, D.G.,
Powell, M.A., Thaker, P.H., Siegel, B.A. and Grigsby,
P.W. (2009). “Surveillance FDG-PET detection of asymp-
tomatic recurrences in patients with cervical cancer,”
Gynecol. Oncol. 112, 104–109.
Buchali, A., Koswig, S., Dinges, S., Rosenthal, P., Salk, J.,
Lackner, G., Bohmer, D., Schlenger, L. and Budach, V.
(1999). “Impact of the filling status of the bladder and
rectum on their integral dose distribution and the move-
ment of the uterus in the treatment planning of gynae-
cological cancer,” Radiother. Oncol. 52, 29–34.
Buijsen, J., van den Bogaard, J., van der Weide, H.,
Engelsman, S., van Stiphout, R., Janssen, M., Beets, G.,
Beets-Tan, R., Lambin, P. and Lammering, G. (2012).
“FDG-PET-CT reduces the interobserver variability in
rectal tumor delineation,” Radiother. Oncol. 102,
371–376.
Burghardt, E., Hofmann, H.M., Ebner, F., Haas, J.,
Tamussino, K. and Justich, E. (1989). “Magnetic reson-
ance imaging in cervical cancer: a basis for objective
classification,” Gynecol. Oncol. 33, 61–67.
Burke, T.W. (2008). “The origins of multidisciplinary
cancer care,” Gynecol. Oncol. 110, S2–S3.
Castadot, P., Lee, J.A., Geets, X. and Gregoire, V. (2010).
“Adaptive radiotherapy of head and neck cancer,”
Semin. Radiat. Oncol. 20, 84–93.
Castadot, P., Geets, X., Lee, J.A. and Gregoire, V. (2011).
“Adaptive functional image-guided IMRT in pharyngo-
laryngeal squamous cell carcinoma: is the gain in dose
distribution worth the effort?,” Radiother. Oncol. 101,
343–350.
Castelnau-Marchand, P., Chargari, C., Maroun, P.,
Dumas, I., Del Campo, E.R., Cao, K., Petit, C.,
Martinetti, F., Tafo-Guemnie, A., Lefkopoulos, D.,
Morice, P., Haie-Meder, C. and Mazeron, R. (2015).
“Clinical outcomes of definitive chemoradiation followed
by intracavitary pulsed-dose rate image-guided adap-
tive brachytherapy in locally advanced cervical cancer,”
Gynecol. Oncol. 139, 288–294.
Cavalli, F. (2006). “Cancer in the developing world: can we
avoid the disaster?,” Nat. Clin. Pract. Oncol. 3,
582–583.
CFMRI (1983). Center for Functional Magnetic Resonance
Imaging. Recommendations pour la Determination des
Doses Absorbees en Curietherapie (San Diego,
California).
Chajon, E., Dumas, I., Touleimat, M., Magne, N., Coulot,
J., Verstraet, R., Lefkopoulos, D. and Haie-Meder, C.
(2007). “Inverse planning approach for 3-D MRI-based
pulse-dose rate intracavitary brachytherapy in cervix
cancer,” Int. J. Radiat. Oncol. Biol. Phys. 69, 955–961.
Chargari, C., Magne, N., Dumas, I., Messai, T., Vicenzi, L.,
Gillion, N., Morice, P. and Haie-Meder, C. (2009).
“Physics contributions and clinical outcome with
3D-MRI-based pulsed-dose-rate intracavitary brachy-
therapy in cervical cancer patients,” Int. J. Radiat.
Oncol. Biol. Phys. 74, 133–139.
Charra-Brunaud, C., Harter, V., Delannes, M.,
Haie-Meder, C., Quetin, P., Kerr, C., Castelain, B.,
Thomas, L. and Peiffert, D. (2012). “Impact of 3D image-
based PDR brachytherapy on outcome of patients
treated for cervix carcinoma in France: results of the
French STIC prospective study,” Radiother. Oncol. 103,
305–313.
Chassagne, D. and Horiot, J.C. (1977). “[Proposals for
common definitions of reference points in gynecological
brachytherapy (author’s transl)],” J. Radiol. Electrol.
Med. Nucl. 58, 371–373.
Chassagne, D. and Pierquin, B. (1966). “[Plesiocurietherapy
of vaginal cancers by plastic mold with iridium 192 (non-
radioactive preparation). (Preliminary note)],” J. Radiol.
Electrol. Med. Nucl. 47, 89–93.
Chen, S.W., Liang, J.A., Yang, S.N., Liu, R.T. and Lin, F.J.
(2000). “The prediction of late rectal complications fol-
lowing the treatment of uterine cervical cancer by
high-dose-rate brachytherapy,” Int. J. Radiat. Oncol.
Biol. Phys. 47, 955–961.
References
235
atUniversityofCalifornia,IrvineonSeptember9,2016http://jicru.oxfordjournals.org/Downloadedfrom](https://image.slidesharecdn.com/icru891-190321105446/85/Icru-89-261-320.jpg)
![Chen, S.W., Liang, J.A., Yang, S.N., Ko, H.L. and Lin, F.J.
(2003). “The adverse effect of treatment prolongation in
cervical cancer by high-dose-rate intracavitary brachy-
therapy,” Radiother. Oncol. 67, 69–76.
Chen, C.C., Lin, J.C., Jan, J.S., Ho, S.C. and Wang, L.
(2011). “Definitive intensity-modulated radiation
therapy with concurrent chemotherapy for patients
with locally advanced cervical cancer,” Gynecol. Oncol.
122, 9–13.
Chou, H.H., Chang, T.C., Yen, T.C., Ng, K.K., Hsueh, S., Ma,
S.Y., Chang, C.J., Huang, H.J., Chao, A., Wu, T.I., Jung,
S.M., Wu, Y.C., Lin, C.T., Huang, K.G. and Lai, C.H.
(2006). “Low value of [18F]-fluoro-2-deoxy-D-glucose posi-
tron emission tomography in primary staging of early-
stage cervical cancer before radical hysterectomy,” J. Clin.
Oncol. 24, 123–128.
Christensen, G.E., Carlson, B., Chao, K.S., Yin, P.,
Grigsby, P.W., Nguyen, K., Dempsey, J.F., Lerma, F.A.,
Bae, K.T., Vannier, M.W. and Williamson, J.F. (2001).
“Image-based dose planning of intracavitary brachy-
therapy: registration of serial-imaging studies using de-
formable anatomic templates,” Int. J. Radiat. Oncol.
Biol. Phys. 51, 227–243.
Coia, L., Won, M., Lanciano, R., Marcial, V.A., Martz, K. and
Hanks, G. (1990). “The Patterns of Care Outcome Study
for cancer of the uterine cervix. Results of the Second
National Practice Survey,” Cancer 66, 2451–2456.
Compton, C.C., Byrd, D.R., Garcia-Aguilar, J., Kurtzman,
S.H., Olawaiye, A. and Washington, M.K., Eds. (2012).
AJCC Cancer Staging Atlas. A Companion to the
Seventh Editions of the AJCC Cancer Staging Manual
and Handbook (Springer: New York).
Corn, B.W., Hanlon, A.L., Pajak, T.F., Owen, J. and Hanks,
G.E. (1994). “Technically accurate intracavitary inser-
tions improve pelvic control and survival among
patients with locally advanced carcinoma of the uterine
cervix,” Gynecol. Oncol. 53, 294–300.
Croke, J.M. and El-Sayed, S. (2012). “Multidisciplinary
management of cancer patients: chasing a shadow or
real value? An overview of the literature,” Curr. Oncol.
19, e232–e238.
Crook, J.M., Esche, B.A., Chaplain, G., Isturiz, J.,
Sentenac, I. and Horiot, J.C. (1987). “Dose–volume ana-
lysis and the prevention of radiation sequelae in cer-
vical cancer,” Radiother. Oncol. 8, 321–332.
Cunningham, D.E., Stryker, J.A., Velkley, D.E. and Chung,
C.K. (1981). “Routine clinical estimation of rectal, recto-
sigmoidal, and bladder doses from intracavitary brachy-
therapy in the treatment of carcinoma of the cervix,”
Int. J. Radiat. Oncol. Biol. Phys. 7, 653–660.
Cuzick, J. (2010). “Long-term cervical cancer prevention
strategies across the globe,” Gynecol. Oncol. 117(2
Suppl.), S11–S14.
Cuzick, J., Arbyn, M., Sankaranarayanan, R., Tsu, V., Ronco,
G., Mayrand, M.H., Dillner, J. and Meijer, C.J. (2008).
“Overview of human papillomavirus-based and other novel
options for cervical cancer screening in developed and devel-
oping countries,” Vaccine 26(Suppl. 10), K29–K41.
Daisne, J.F., Duprez, T., Weynand, B., Lonneux, M.,
Hamoir, M., Reychler, H. and Gregoire, V. (2004).
“Tumor volume in pharyngolaryngeal squamous cell
carcinoma: comparison at CT, MR imaging, and FDG
PET and validation with surgical specimen,” Radiology
233, 93–100.
Dale, R.G., Coles, I.P., Deehan, C. and O’Donoghue, J.A.
(1997). “Calculation of integrated biological response in
brachytherapy,” Int. J. Radiat. Oncol. Biol. Phys. 38,
633–642.
Datta, N.R., Kumar, S., Das, K.J., Pandey, C.M., Halder, S.
and Ayyagari, S. (2001). “Variations of intracavitary appli-
cator geometry during multiple HDR brachytherapy
insertions in carcinoma cervix and its influence on report-
ing as per ICRU Report 38,” Radiother. Oncol. 60, 15–24.
Datta, N.R., Das, K.J., Basu, R. and Singh, U. (2003).
“Total reference air kerma: to what extent can it predict
intracavitary volume enclosed by isodose surfaces during
multiple high-dose rate brachytherapy?,” Brachytherapy
2, 91–97.
Davidson, M.T., Yuen, J., D’Souza, D.P., Radwan, J.S.,
Hammond, J.A. and Batchelar, D.L. (2008). “Optimization
of high-dose-rate cervix brachytherapy applicator place-
ment: the benefits of intraoperative ultrasound guidance,”
Brachytherapy 7, 248–253.
De Brabandere, M., Mousa, A.G., Nulens, A., Swinnen, A.
and Van Limbergen, E. (2008). “Potential of dose opti-
misation in MRI-based PDR brachytherapy of cervix
carcinoma,” Radiother. Oncol. 88, 217–226.
Delclos, L., Fletcher, G.H., Sampiere, V. and Grant, W.H.,
III. (1978). “Can the Fletcher gamma ray colpostat
system be extrapolated to other systems?,” Cancer. 41,
970–979.
Delclos, L., Fletcher, G.H., Moore, E.B. and Sampiere, V.A.
(1980). “Minicolpostats, dome cylinders, other additions
and improvements of the Fletcher-suit afterloadable
system: indications and limitations of their use,”
Int. J. Radiat. Oncol. Biol. Phys. 6, 1195–1206.
De Leeuw, A.A., Moerland, M.A., Nomden, C., Tersteeg,
R.H., Roesink, J.M. and Jurgenliemk-Schulz, I.M.
(2009). “Applicator reconstruction and applicator shifts
in 3D MR-based PDR brachytherapy of cervical cancer,”
Radiother. Oncol. 93, 341–346.
Delgado, G., Bundy, B., Zaino, R., Sevin, B.U., Creasman,
W.T. and Major, F. (1990). “Prospective surgical-
pathological study of disease-free interval in patients
with stage IB squamous cell carcinoma of the cervix: a
Gynecologic Oncology Group study,” Gynecol. Oncol. 38,
352–357.
Demanes, D.J., Rodriguez, R.R., Bendre, D.D. and Ewing,
T.L. (1999). “High dose rate transperineal interstitial
brachytherapy for cervical cancer: high pelvic control
and low complication rates,” Int. J. Radiat. Oncol. Biol.
Phys. 45, 105–112.
Denny, L. (2012). “Cervical cancer prevention: new oppor-
tunities for primary and secondary prevention in the
21st century,” Int. J. Gynaecol. Obstet. 119(Suppl. 1),
S80–S84.
DeWerd, L.A., Ibbott, G.S., Meigooni, A.S., Mitch, M.G.,
Rivard, M.J., Stump, K.E., Thomadsen, B.R. and
Venselaar, J.L. (2011). “A dosimetric uncertainty ana-
lysis for photon-emitting brachytherapy sources: report
of AAPM Task Group No. 138 and GEC-ESTRO,” Med.
Phys. 38, 782–801.
PRESCRIBING, RECORDING, AND REPORTING BRACHYTHERAPY FOR CANCER OF THE CERVIX
236
atUniversityofCalifornia,IrvineonSeptember9,2016http://jicru.oxfordjournals.org/Downloadedfrom](https://image.slidesharecdn.com/icru891-190321105446/85/Icru-89-262-320.jpg)


The document is an International Commission on Radiation Units and Measurements (ICRU) report that provides recommendations for prescribing, recording, and reporting brachytherapy for cancer of the cervix. The ICRU aims to develop internationally accepted recommendations regarding quantities and units of ionizing radiation, procedures for measurement and application in clinical radiology and radiobiology, and physical data needed for these procedures. This report focuses specifically on providing standardized guidelines for brachytherapy treatment of cervical cancer.


![Arc therapy [autosaved] [autosaved]](https://cdn.slidesharecdn.com/ss_thumbnails/arctherapyautosavedautosaved-150423125828-conversion-gate01-thumbnail.jpg?width=640&height=640&fit=bounds)


