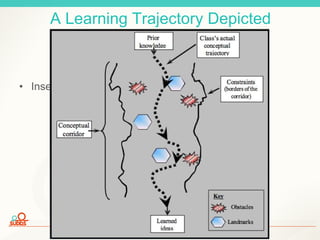
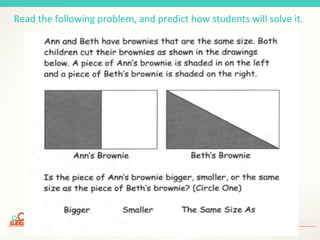
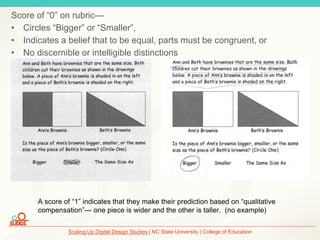
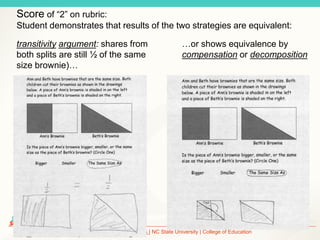
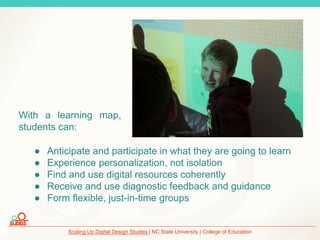
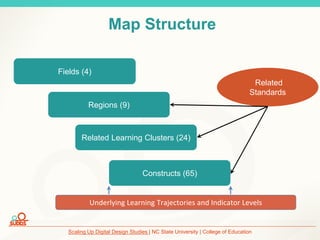
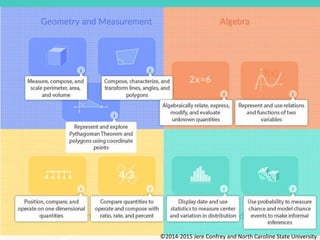
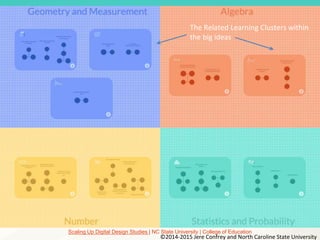
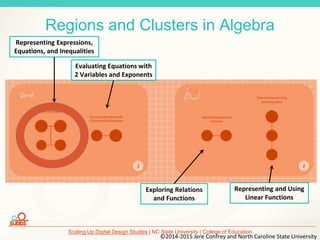
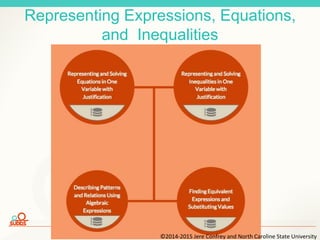
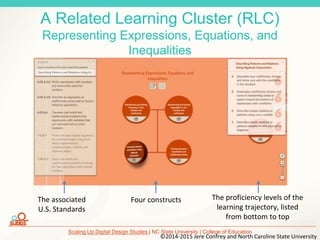
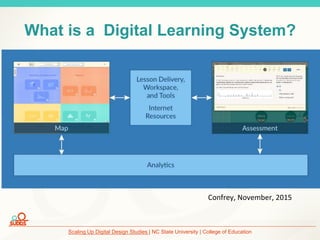
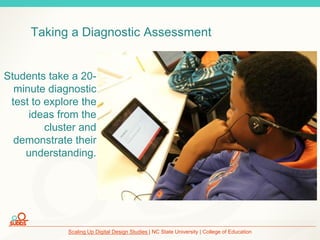
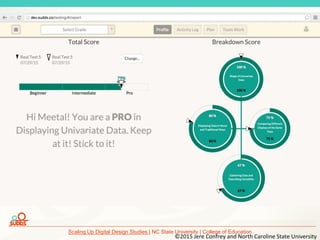
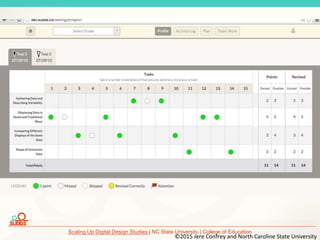
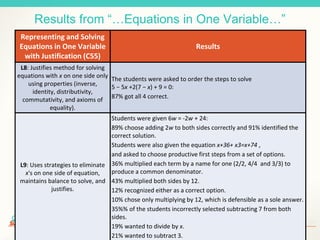
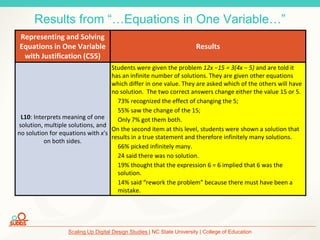
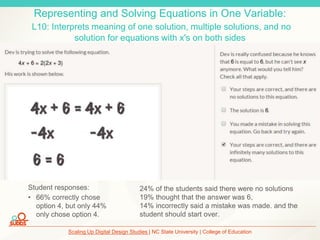
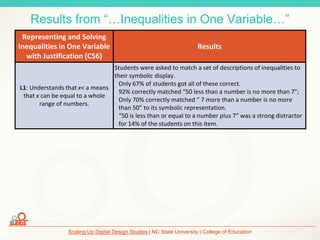
A learning trajectory connects what students bring to instruction, to a target concept, and delineates a set of landmarks and obstacles that students are likely to encounter as they move from naïve to sophisticated understandings.
Slides from Keynote presentation at the University of Southern California's 2015 Teaching with Technology annual conference.
"9:15 am – ANN Auditorium
Key Note: What Do We Mean by Learning Analytics?
Leah Macfadyen, Director for Evaluation and Learning Analytics, University of British Columbia
Executive Board, SoLAR (Society for Learning Analytics Research)
Leah Macfadyen will define and explore the emerging and interdisciplinary field of learning analytics in the context of quantified and personalized learning. Leah will use actual examples and case studies to illustrate the range of stakeholders learning analytics may serve, the diverse array of questions they may be used to address, and the potential impact of learning analytics in higher education."
Nurturing the Connections: The Role of Quantitative Ethnography in Learning A...Dragan Gasevic
This talk will explore connections between two emerging fields focused on harnessing the potential of data – learning analytics and quantitative ethnography. Learning analytics is focused on the analysis of data collected from user interactions with technology with the goal of advancing our understanding of and enhancing human learning. Despite some early success stories and widespread interest, producing meaningful and actionable results is still a top open research challenge for learning analytics. The talk will first explore how quantitative ethnography can offer promising approaches that can address this open challenge in learning analytics. The talk will next discuss how progress in learning analytics can be used to accelerate the development of the field of quantitative ethnography. The talk will finally outline promising directions for future research at the intersection of learning analytics and quantitative ethnography.
Technologies to support self-directed learning through social interactionDragan Gasevic
This talk will describe underlying principles, design, and experience gained with ProSolo, a platform that supports personalized, competency-based learning through social interaction. Traditional educational models are primarily focused on classroom education and training typically associated with the notion of credit hours as the (only) route towards formal credentials. This limits opportunities for creating personalized learning pathways in the changing educational context. ProSolo provide users with the ability to unbundle education programs, courses, and units into discrete yet inter-related competencies, allowing learners to construct their education pathway in a manner that better reflects their interests and future career motivations and requirements. ProSolo is developed with the intention of providing learners with opportunities to customize, modify, and personalize their self-directed learning journey. ProSolo supports the development of skills for self-directed learning by allowing learners to control the planning, learning, and presentation of outcomes associated with their learning. To support learners with different levels of prior knowledge, study skills, and cultural backgrounds, ProSolo offers features for supporting self-directed learning through three types of scaffolds, including instructional, social, and technological. Learning in ProSolo occurs within a socially rich environment that aggregates learners’ information created and shared in their existing online spaces. ProSolo makes use of learning analytics to empower learners and instructors in this new model of education. ProSolo was used in the Data, Learning, and Analytics MOOC and is currently being piloted at several university sites.
Scalable, Actionable, and Ethical Learning Dashboards: a reality checkTinne De Laet
Keynote presentation at Edmedia 2018 conference: https://www.aace.org/conf/edmedia/speakers/.
Results of Erasmus+ projects ABLE (www.ableproject.eu) and STELA (www.stela-project.eu) on learning dashboards for supporting first-year students.
Self-motivation and Academic Performance In Computer Programming Language Usi...CSCJournals
The advancement in artificial intelligence (AI) and Machine learning (ML) have made it easier to foreknown feature happens from current and past trends. Once Self-efficacy and self-confidence are believed to be, an individual trait associated with academic brilliance. Using a hybridised Random Forest and Support Vector Machine (RFSVM) ML model we predicted students' academic performance in computer programming courses, based on their self-confidence, self-efficacy, positive thinking, focus, big goals, a motivating environment and demographic data. Benchmarking our RFSVM model against Decision Tree (DT) and K-Nearest Neighbour (K-NN) model, the RFSVM recorded and accuracy of 98% as against 95.45% for DT and 36.36% for K-NN. The error between actual values and predicted values of the RFSVM model was better (RMSE = 0.326401, MAE = 0.050909) and compared with the K-NN (RMSE = 2.671397, MAE = 1.954545) and DT models (RMSE = 0.426401, MAE = 0.090909). The results further revealed that students with a high level of self-confidence, self-efficacy and positive thinking performed well in computer programming courses.
[Extended] Bottom-up growth of learning analytics at two Australian universit...Danny Liu
Presented at the University of New South Wales Learning Analytics and Educational Data Science research group meeting, April 2016.
This presentation will outline two approaches to learning analytics at the University of Sydney and Macquarie University, where staff are closely involved in the coevolution and development of two bespoke learning analytics tools to personalise student-staff interactions at scale. The University of Sydney system, called the Student Relationship Engagement System (SRES), is a highly-customisable web-based tool that supports the efficient capture and collation of student datasets. A companion mobile app helps staff quickly collect and access student data. Through an embedded messaging system, teaching staff can set up fully customisable rules to contact students via personalised emails and text messages. A nascent feature allows staff to leverage machine learning to uncover hidden patterns and relationships within and between datasets. The Macquarie University system is an enhancement of an existing Moodle plug-in, the Moodle Engagement Analytics Plugin (MEAP). MEAP can readily access data on student assessments, completions, login activity, forum activity, and the gradebook, amongst others, which are customisably represented as ‘risk indicators’. MEAP allows flexible and customisable interrogation of these data, and provides staff the ability to send personalised emails to students based on these risk indicators. At both institutions, these learning analytics approaches have grown from the grassroots to address pressing staff needs, highlighting the importance of this bespoke coevolution process of design, development, and implementation. The systems have enjoyed substantial organic adoption and are associated with positive student outcomes. As open source developments, we are very interested in working together to open up accessible learning analytics to teachers and students.
Strijker & Fisser (2019-06-26) A new curriculum for the netherlands including...Saxion
In 2018 the Netherlands started the development of a new curriculum framework for primary, lower and upper secondary education. New themes in curriculum are Digital Literacy, citizenship and a strong focus on 21st century skills. Digital Literacy is defined as a combination of ICT skills, media literacy, information literacy and Computational Thinking. Starting with a vision on a theme such as Digital Literacy and using this vision as a starting point for describing big ideas. For Digital Literacy eight big ideas were described: data and information, safety and privacy, using and controlling, communication and cooperation, digital citizenship, digital economy, applying and designing, and sustainability. Computational Thinking is integrated in each of these big ideas. The underlying framework for Computational Thinking is based on ISTE and CSTA and each big idea is specified as a learning trajectory describing learning objectives leading to a new legal curriculum framework in 2022.
Learning Analytics (or: The Data Tsunami Hits Higher Education)Simon Buckingham Shum
Keynote Address to The Impact of Higher Education: Addressing the Challenges of the 21st CenturyEuropean Association for Institutional Research (EAIR) 35th Annual Forum 2013, Erasmus University, Rotterdam, the Netherlands, 28-31 August 2013. http://www.eair.nl/forum/rotterdam
Data-Driven Education 2020: Using Big Educational Data to Improve Teaching an...Peter Brusilovsky
Modern educational settings from regular classrooms to MOOCs produce a a rapidly increasing volume of data that captures individual learning progress of millions of students at different level of granularity. This presence of this data opens a unique opportunity to re-engineer traditional education and build and develop a range of efficient data-driven approaches to support teaching and learning. In my talk, I will present several ways to use big educational data explored in our lab. The focus will be on open social learning modeling and identifying individual differences through sequential pattern mining, but several other approaches will be mentioned. Open social learning modeling and sequential pattern mining provides two considerably different examples on using educational data. One offers an immediate use of class interaction history to develop more engaging content access while another shows how big data could be used to uncover important individual differences that could be used to optimize the process for individual leaners.
Personalized Online Practice Systems for Learning ProgrammingPeter Brusilovsky
Computer programming is quickly transitioning from being just a key competency in computer and information science majors to being a desired skill for students in a wide range of fields. Yet, it is also one of the most challenging subjects to learn. While learning by doing is a critical component in mastering programming skills, neither the traditional educational process nor standard learning support tools provide sufficient opportunities for programming practice. In this talk, I will present our research on personalized programming practice systems for Java, Python, and SQL, which attempt to bridge this known gap in learning programming. A programming practice system engages students in practicing programming skills beyond a relatively small number of graded assignments and exams. To support learning by doing, an online practice system offers a range of interactive “smart content” such as program animations, worked examples, and various kinds of programming problems with an automatic assessment. The main challenges for online practice systems are to motivate students to practice and to guide them to the most appropriate smart content given their course goals and knowledge levels. In this talk, I will review a range of AI technologies, such as student modeling, navigation support, social comparison, and content recommendation, which support efficient programming practice. I will also discuss how personalized practice system could support COVID-19-influenced switch to online learning while maintaining an extensive level of feedback expected from an efficient learning process.
Jurgen Schulte is an award-winning academic at UTS who has been using an adaptive learning platform (WileyPLUS Orion) in combination with post processing of the data. In this talk he shares some of his experiences
Three theoretical approaches to gender: Implications for creating effective p...ADVANCE-Purdue
In recent decades, there have been increasing national, state, local and institutional efforts to increase the representation of women in Science, Technology, Engineering and Mathematics (STEM) disciplines and careers. For example, many Colleges and Universities have established programs to recruit female students, and increase female students’ persistence in STEM majors. While some of these programs have been successful in their efforts, a major limitation is that most of the programs do not address the underlying socio-psychological factors that may inhibit the representation of women in STEM disciplines. This presentation provides a discussion of three socio-psychological theoretical perspectives of gender and how these theories highlight some misleading societal explanations for the gender disparity in STEM majors and careers. Specifically, this presentation will discuss the essentialist approach, socialization approach and social constructionist approach, and their implications for creating effective programs to increase the participation of women in the STEM pipeline.
Essentialist perspective holds that behavioral differences between men and women result from innate biological differences that are culturally stable, and not susceptible to the influences of socio-cultural factors. Sex and gender are thought to be “isomorphic” and “conceptualized as stable, innate, bipolar property of individuals” (Howard and Hollander, p. 27). Although the essentialist perspective is no longer considered valid in recent social psychological research, this presentation will highlight some of its underlying assumptions that still prevail in the explanation of gender disparities in STEM. For example, the gender gap in STEM is often explained as a result of the biological and psychological differences between men and women. Men are thought of as “wired” for STEM disciplines while women are viewed as lacking the “intelligent capacity” needed to be successful scientists and engineers.
Socialization perspective holds that gendered behaviors are not biologically determined, but, are learned through a myriad of social learning processes. That is, children learn to be ‘male’ or ‘female’ by observing and imitating their parents and other members of the society, and by internalizing the gender norms of the society. This approach argues that children, through the process of socialization, learn and fulfill the gender stereotypes and role expectations (e.g., career choices) embedded in the norms of their societies. For example, parents are likely to encourage and stir their sons to engineering careers and girls to education and liberal arts. Similarly, boys are viewed as capable of succeeding in STEM careers because the requirements and qualities associated with these professions (e.g., strength and confidence) are consistent with societal views of male roles. This presentation will discuss how gender focused STEM programs can effectively address the effects of the socialization process on the participation of women in STEM careers.
Social constructionist perspective views gendered behaviors as the result of complex and dynamic processes, external to the individual. The basic argument of the social constructionist approach is that gendered behaviors are created by the daily lived experiences of people, the complex interactions between people and by the discourse of a culture. Social constructionists opine that men and women often act in gender-defined ways because they face different societal constraints and expectations. For example, women may not choose full time research careers in STEM disciplines because of other time demanding roles (e.g., parenting and other family responsibilities.) This presentation will provide some insights to how effective programs can address the societal constraints that hinder women’s participation in STEM careers.
In summary, this presentation will examine the impact of each of these
التعرف على أدوات التسويق الإلكتروني 15 دقائق.
مزايا التسويق الإلكتروني 10 دقائق.
أهم 3 استراتيجيات في قياس أثر الحملات التسويقية. 10 دقائق
أهم 3 أسئلة قبل نشر أي محتوى.10 دقائق
تعرف على بعض الأدوات التي يحتاجها العاملون في العمل الخيري 20 دقيقة
أهم 5 مفاهيم تسويقية واحصائية 15 دقيقة.
أسئلة واستفسارات 20 دقيقة.
Drs. Jere Confrey and Seth Jones present "Linking Math Standards and Diagnostic Assessments around Learning Trajectories" at the Middle School Math Summit, in Greensboro, NC.
Enhancing and Assessing Your Work-Based Learning PlanNAFCareerAcads
Does your academy’s work-based learning plan need to be fine-tuned? Participants will learn how to integrate a four-year, sequenced work-based learning plan into the curriculum, involve advisory boards to enhance the plan
and measure quality and effectiveness.
Presenter:
Laura Fidler,
National Academy Foundation
Ellen Wagner, Executive Director, WCET.
Putting Data to Work
This session explores changing data sensibilities at US post-secondary institutions with particular attention paid to how predictive analytics are changing expectations for institutional accountability and student success. Results from the Predictive Analytics Reporting Framework show that predictive modeling can identify students at risk and that linking behavioral predictions of risk with interventions to mitigate those risks at the point of need is a powerful strategy for increasing rates of student retention, academic progress and completion.
presentation at the 15th annual SLN SOLsummit February 27, 2014
http://slnsolsummit2014.edublogs.org/
[DSC Europe 22] Machine learning algorithms as tools for student success pred...DataScienceConferenc1
The goal of higher education institutions is to provide quality education to students. Predicting academic success and early intervention to help at-risk students is an important task for this purpose. This talk explores the possibilities of applying machine learning in developing predictive models of academic performance. What factors lead to success at university? Are there differences between students of different generations? Answers are given by applying machine learning algorithms to a data set of 400 students of three generations of IT studies. The results show differences between students with regard to student responsibility and regularity of class attendance and great potential of applying machine learning in developing predictive models.
07 18-13 webinar - sharnell jackson - using data to personalize learningDreamBox Learning
Learning and competency data can be useful tools in assessing a student’s individual learning needs. In this month’s Blended Learning webinar, presenters Sharnell Jackson and Tim Hudson shared best practices for organizing and using student data in order to better meet student needs. They also discussed processes for using and analyzing data at the student, classroom, and district levels.
Similar to Learning Trajectory-Aligned Diagnostic Assessments for Early Algebra, Grades 6-8 (20)
Palestine last event orientationfvgnh .pptxRaedMohamed3
An EFL lesson about the current events in Palestine. It is intended to be for intermediate students who wish to increase their listening skills through a short lesson in power point.
Introduction to AI for Nonprofits with Tapp NetworkTechSoup
Dive into the world of AI! Experts Jon Hill and Tareq Monaur will guide you through AI's role in enhancing nonprofit websites and basic marketing strategies, making it easy to understand and apply.
Synthetic Fiber Construction in lab .pptxPavel ( NSTU)
Synthetic fiber production is a fascinating and complex field that blends chemistry, engineering, and environmental science. By understanding these aspects, students can gain a comprehensive view of synthetic fiber production, its impact on society and the environment, and the potential for future innovations. Synthetic fibers play a crucial role in modern society, impacting various aspects of daily life, industry, and the environment. ynthetic fibers are integral to modern life, offering a range of benefits from cost-effectiveness and versatility to innovative applications and performance characteristics. While they pose environmental challenges, ongoing research and development aim to create more sustainable and eco-friendly alternatives. Understanding the importance of synthetic fibers helps in appreciating their role in the economy, industry, and daily life, while also emphasizing the need for sustainable practices and innovation.
Honest Reviews of Tim Han LMA Course Program.pptxtimhan337
Personal development courses are widely available today, with each one promising life-changing outcomes. Tim Han’s Life Mastery Achievers (LMA) Course has drawn a lot of interest. In addition to offering my frank assessment of Success Insider’s LMA Course, this piece examines the course’s effects via a variety of Tim Han LMA course reviews and Success Insider comments.
Unit 8 - Information and Communication Technology (Paper I).pdfThiyagu K
This slides describes the basic concepts of ICT, basics of Email, Emerging Technology and Digital Initiatives in Education. This presentations aligns with the UGC Paper I syllabus.
Francesca Gottschalk - How can education support child empowerment.pptxEduSkills OECD
Francesca Gottschalk from the OECD’s Centre for Educational Research and Innovation presents at the Ask an Expert Webinar: How can education support child empowerment?
Operation “Blue Star” is the only event in the history of Independent India where the state went into war with its own people. Even after about 40 years it is not clear if it was culmination of states anger over people of the region, a political game of power or start of dictatorial chapter in the democratic setup.
The people of Punjab felt alienated from main stream due to denial of their just demands during a long democratic struggle since independence. As it happen all over the word, it led to militant struggle with great loss of lives of military, police and civilian personnel. Killing of Indira Gandhi and massacre of innocent Sikhs in Delhi and other India cities was also associated with this movement.
Acetabularia Information For Class 9 .docxvaibhavrinwa19
Acetabularia acetabulum is a single-celled green alga that in its vegetative state is morphologically differentiated into a basal rhizoid and an axially elongated stalk, which bears whorls of branching hairs. The single diploid nucleus resides in the rhizoid.
Learning Trajectory-Aligned Diagnostic Assessments for Early Algebra, Grades 6-8
1. Scaling Up Digital Design Studies | NC State University | College of Education
Seminar on formative assessment tasks in mathematics
January 5-7, 2016
Weizmann Institute of Science
The Challenge of Building and Implementing
Learning Trajectory-Aligned Diagnostic
Assessments for Early Algebra, Grades 6-8
Jere Confrey
Joseph D. Moore Distinguished University Professor
North Carolina State University
Research funded by:
2. Scaling Up Digital Design Studies | NC State University | College of Education
3. Scaling Up Digital Design Studies | NC State University | College of Education
The Team
Jere Confrey, Project Director
Ryan Seth Jones, Learning Scientist
Garron Gianopulos, Psychometrician
Basia Coulter, Visual Designer
Yungjae Kim, Lead Software Engineer
Pedro Larios, Software Engineer
Doug Ivers, Software Engineer
Meetal Shah, Graduate Student
4. Scaling Up Digital Design Studies | NC State University | College of Education
Scaling Up Digital Design Studies:
• How we work
– Research-based
– Rapid Prototyping
– Agile Methods
– Partnerships with
Teachers and Students
– Design Research
5. Scaling Up Digital Design Studies | NC State University | College of Education
Success of the Future
• A Stanford-hosted panel of highly successful, scientific technology
entrepreneurs--Astro Teller, inventor (Google), Christina Smolke,
bioengineer (Stanford), and Steve Jurvetson, venture capitalist (DFJ
General Partner), reflected on what learning is essential for success in
tomorrow’s technology world. They agreed on the importance of problem
selection, successful work in interdisciplinary teams, outstanding
communication skills, and the ability to learn quickly. They also called for
learners who are able to reconstruct knowledge from first principles and to
pivot as needed to adjust to new possibilities and options.
• In a nutshell, Teller advised students about the nature of their future
pursuits saying, “…if you plan for static stability, you are going to be really
frustrated. But if you build the skills of dynamic stability, it is going to be
awesome…”
• Jurvetson summarized their views of learning up saying “Iterative learning,
that is, focusing on the process learning that correlates with success, will be
the increasing locus of learning.”
(http://ecorner.stanford.edu/authorMaterialInfo.html?mid=3554)
6. Scaling Up Digital Design Studies | NC State University | College of Education
How to leverage
student thinking to
strengthen
instruction?
The
Challenge
7. Scaling Up Digital Design Studies | NC State University | College of Education
The SUDDS approach
• Create a digital system that:
– Represents the big ideas in a learning map
– Specifies the landmarks and obstacles in learning big ideas over
time and across grades based on research on learning
trajectories
– Periodically diagnoses student progress accurately in real time
– Allows teachers to address key conceptions based on student
thinking patterns
– Allows teachers to flexibly create fluid groups, based on student
learning profiles
8. Scaling Up Digital Design Studies | NC State University | College of Education
• A learning trajectory connects what students bring to
instruction, to a target concept, and delineates a set of
landmarks and obstacles that students are likely to
encounter as they move from naïve to sophisticated
understandings.
A Key Concept: A Learning Trajectory
9. Scaling Up Digital Design Studies | NC State University | College of Education
• Insert corridor picture
A Learning Trajectory Depicted
10. Scaling Up Digital Design Studies | NC State University | College of Education
Read the following problem, and predict how students will solve it.
11. Scaling Up Digital Design Studies | NC State University | College of Education
Score of “0” on rubric—
• Circles “Bigger” or “Smaller”,
• Indicates a belief that to be equal, parts must be congruent, or
• No discernible or intelligible distinctions
A score of “1” indicates that they make their prediction based on “qualitative
compensation”--- one piece is wider and the other is taller. (no example)
12. Scaling Up Digital Design Studies | NC State University | College of Education
transitivity argument: shares from
both splits are still ½ of the same
size brownie)…
Score of “2” on rubric:
Student demonstrates that results of the two strategies are equivalent:
…or shows equivalence by
compensation or decomposition
13. Scaling Up Digital Design Studies | NC State University | College of Education
PEEQ: Property of Equality of
Equipartitioning
• If two congruent shapes are each split for the same
number of persons, then the size of each share from
one of the shapes is equal to the size of each share
from the other shape, regardless of the shape of the
shares.
14. Scaling Up Digital Design Studies | NC State University | College of Education
Equipartitioning a Rectangle for 4 people
• Discuss the following solution to the task “Share a rectangle
(i.e. rectangular cake) for 4 people.” Did each person receive
a fair share?
• How do you know?—Justify your answer.
15. Scaling Up Digital Design Studies | NC State University | College of Education
Learning Trajectories
• Are not simply logical deconstructions of a math concept
• Surface as a result of use of appropriate tasks, tools,
and forms of discourse in classrooms
• Not just erroneous, but have roots of productive thinking
• Can be transformative, leading to new possible insights
• Sometimes have to be unearthed, sensed, and pursued
16. Scaling Up Digital Design Studies | NC State University | College of Education
Epistemological Objects of LTs
• What is observed or heard has a meaning to the child as
a means to make sense of experience, and is a form of
knowledge claim; therefore from the child’s perspective,
it is an epistemological object. It permits the observer to
imagine how the child is interpreting the problem and
what follows from that.
17. Scaling Up Digital Design Studies | NC State University | College of Education
• creating a need for the idea
• connections to prior or related ideas
• misconceptions and alternative conceptions
• student built representations and coordinating
representations
• mental models
• strategies
• sets of cases
• generalizations and formalizations
Types of Epistemological Objects of
LTs
18. Scaling Up Digital Design Studies | NC State University | College of Education
What is the difference between this…?
19. Scaling Up Digital Design Studies | NC State University | College of Education
…and this?
20. Scaling Up Digital Design Studies | NC State University | College of Education
Leveraging LTs
• What structure is needed for digital curricula?
• Can we use learning trajectories to create such a
structure?
21. Scaling Up Digital Design Studies | NC State University | College of Education
What is the SUDDS 6-8 Learning Map?
● A Learning Map is a navigational system that helps
students to explore the content to be learned organized
in a learner-centered way.
22. Scaling Up Digital Design Studies | NC State University | College of Education
● Anticipate and participate in what they are going to learn
● Experience personalization, not isolation
● Find and use digital resources coherently
● Receive and use diagnostic feedback and guidance
● Form flexible, just-in-time groups
With a learning map,
students can:
23. Scaling Up Digital Design Studies | NC State University | College of Education
Map Structure
Fields (4)
Regions (9)
Related
Standards
Related Learning Clusters (24)
Constructs (65)
Underlying Learning Trajectories and Indicator Levels
29. Scaling Up Digital Design Studies | NC State University | College of Education
• Access to the map: www.sudds.co
• Make an account
30. Scaling Up Digital Design Studies | NC State University | College of Education
What is a Digital Learning System?
Internet Links
Confrey, November, 2015
31. Scaling Up Digital Design Studies | NC State University | College of Education
Digital Learning Systems
• Not just components
• Relationship among components
• Relationship among users (students, teachers, parents,
administrators, researchers)
• Prediction (planning forward: anticipation)
• Feedback (results to different users for different
purposes )
• Analytics and experimentation
33. Scaling Up Digital Design Studies | NC State University | College of Education
Purpose of Diagnostics
• To identify in students and classes the patterns of
performance that are known from research to block
progress
• To place results in a taxonomy to ease interpretation
• To make actionable information available in real time
• To guide subsequent instructional decisions
• To support formative practices
34. Scaling Up Digital Design Studies | NC State University | College of Education
Taking a Diagnostic Assessment
Students take a 20-
minute diagnostic
test to explore the
ideas from the
cluster and
demonstrate their
understanding.
37. Scaling Up Digital Design Studies | NC State University | College of Education
Results for Algebra Field Testing
• Describe the field-testing setting
• Describe the kinds of items used for algebra
• Show results for each of the four constructs in the select
RLC
• Draw some conclusions and implications
38. Scaling Up Digital Design Studies | NC State University | College of Education
Field-Testing 2015-16
• Site: High-performing district in New Jersey
• Two middle schools, each with ~700 students
• These data are from 7th graders (13-14 year olds)
• Data are collected near the end of instruction on units
• Results are used formatively only
• Current forms of items limited to multiple choice, numeric
and select all.
• (this work is in its infancy→we welcome suggestions)
39. Scaling Up Digital Design Studies | NC State University | College of Education
Epistemological objects in Early Algebra
Epistemological objects
of Learning Trajectories
Examples from the first Algebra RLC
misconceptions 2(x + 3)= 2x + 3; (x + 3)/(x + 2) = 3/2
Representations and their
coordination
Number lines, set notation, intervals, expressions, equations, drawn
images; coordinating equations and number line and figural images
models Solving equations as “pan balances”; variables as unknowns.
strategies Guess and check, adjust; substitution
cases
x + a = c,
bx = c
ax + b = c
a(x + b) − c
ax + b = cx
a(x + b) + c = dx + e, etc.
outliers
-x = a; 1/x = b; -x < -b; a − (x−b) = c;
b – x = c
generalizations Initial amount + (rate times number of stages) = total
formalizations Term, coefficient, range, all the properties
40. Scaling Up Digital Design Studies | NC State University | College of Education
Results from “Describing Patterns and Relations…”
Describing Patterns and
Relations Using Algebraic
Expressions (C53)
Results
L1: Describes simple patterns
(relation or function) verbally
or with pictures or diagrams
(g.6)
67% matched a verbal description using x with the correct pattern
relating number of tables and people.
L2: Describes simple patterns
(relation of function) using x as
a variable (g.6)
A simple growing L was shown.
94% choose the correct algebraic expression.
L3: Associates coefficients,
factors, and terms in
interpreting verbal or pattern-
based descriptions of
expressions with conditions
(g.6)
86% mistakenly said 5 + 3x + 2 + x/3 had six terms.
46% correctly identified 3 as the coefficient of the second term
while 67% also agreed that it was 3x, revealing some confusion.
For coefficient of x/3, 46% incorrectly called it 3, while 29%
correctly called it 1/3.
L4: Describes how coefficients,
factors, and terms vary with
the conditions in the situation
(g.6)
For a given algebraic description of a growing pattern
(arrangements of tables and chairs), 65% selected new expression
that added chairs in certain positions. (They were also provided a
figure of the new patterns, so could have figured it out from
those.)
41. Scaling Up Digital Design Studies | NC State University | College of Education
• 67% of students correctly found the verbal description associated
with the pattern (L1). Cognitive challenge: extend pattern or explain
rate of change. One more table adds two more seats.
42. Scaling Up Digital Design Studies | NC State University | College of Education
Results from “Finding Equivalent Expressions, etc.”
Finding Equivalent
Expressions and
Substituting Values (C54)
Data Summary
L1: Interprets situations
algebraically with simple
expressions without
parentheses.
Overall the students could translate simple expressions into
algebra, but performance dropped to ~80% correct for
subtraction (3 less than x) and division (the quotient of x and 4).
L2: Realizes that different
forms of simple expressions,
including those with
parentheses, may produce
equivalent results.
80% correct: recognize equivalence to x only for simple
expressions (x × 1) + 0;
Performance drops to 60-70% correct for slightly more
complicated expressions ( x + 7) − 7 and 4x/4.
One third incorrectly chose 2(2x) − 4x as equal to x.
L3: Substitutes for x and
evaluates, applying order of
operations on simple
expressions, including those
with parentheses.
Perimeter problem with two stated constraints, one using
expressions:
77% of the students were able to select the one correct solution.
55% of students also identified a compelling distractor meeting
only the first condition.
For two other distractors meeting only the second constraint,
each was selected by about 15% of the students.
43. Scaling Up Digital Design Studies | NC State University | College of Education
Finding Equivalent
Expressions and
Substituting Values (C54)
Data Summary
L4: Interprets situations
algebraically or substitutes
values systematically to test
whether complex expressions
are equivalent, including:
combining like terms and
distributing positive factors into
parentheses.
For the expression 2(x + 1.50):
73% choose the correct match;
13% chose the wrong match indicating a failure to understand the
meaning of the coefficient 2.
L5: Interprets situations
algebraically, or simplifies and
evaluates complex expressions,
including: combining like terms
and distributing positive factors.
In a matching exercise at this level, students were asked to match a
complicated algebraic expression with its written description.
14% got three correct;
individually on those three, 47%, 60% and 34% got each individual
one correct.
In a similar problem, 72% identified the correct expression if two
parts were expressed separately;
Only 40% saw the equivalence of other expressions.
In two items linked to perimeter, performance feel to around 30%.
Results from “Finding Equivalent Expressions, etc.”
44. Scaling Up Digital Design Studies | NC State University | College of Education
Finding Equivalent
Expressions and
Substituting Values (C54)
Data Summary
L6: Interprets situations
algebraically, or simplifies and
evaluates complex expressions,
including: combining like terms
and distributing positive and
negative factors.
Task: select all equivalent expressions from a list for -2(-3x − 5):
92% select correctly one answer of -6x − 10;
Only 67% also recognized the alternative -6x + -10.
19% chose 6x − 10.
These demonstrate some weakness in multiplying with negative
numbers within expressions.
Task: solve 8 − 2(3x − 1):
37% were correct;
41% choosing none of the above.
21% did not distribute or added the x’s incorrectly.
Results from “Finding Equivalent Expressions, etc.”
45. Scaling Up Digital Design Studies | NC State University | College of Education
Finding Equivalent Expressions and Substituting Values: Sample item--
L3 Substitutes for x and evaluates, applying order of operations on
simple expressions, including those with a parentheses,
• A triangle has a perimeter of 7. Two of the sides have
integer lengths equal to x and x+1. Check all that could
be lengths of three sides of the triangle.
(55% of students selected this
incorrect choice-adds to 7)
(77% of students selected this correct
answer)
(14%of students selected this incorrect
choice – has consecutive values)
(15%of students selected this incorrect
choice- has consecutive values)
1) 1,1,5
1) 2,2,3
1) 1,3,4
1) 6,7,8
46. Scaling Up Digital Design Studies | NC State University | College of Education
The Role of Context
• An interesting question for the LTs and items is when to
include context in the problems.
• Sometimes context facilitates; sometimes it adds
difficulty
• Our approach to this has varied. Sometimes we see it
as inherent to the LT (in patterns, in translating
expressions); sometimes we make it, its own level at a
complex stage to check for integration of ideas.
• Needs future experimentation to inform its proper role in
diagnostics.
47. Scaling Up Digital Design Studies | NC State University | College of Education
Results from “…Equations in One Variable…”
Representing and Solving
Equations in One Variable
with Justification (C55)
Results
L1: Understands x stands for a
number that makes the equation
true.
Given the equation, 2(x + 4) = 3x, the, students were asked to choose
one of four answers that solved the equation.
80% answered the problem correctly;
11% believed there was no correct answer provided;
7% answered 4, which might imply a failure to distribute.
L2: Solves simple equations by
inspection and guess, check, and
adjust.
Students were asked to predict what number to try next.
98% responded by suggestion a number between the two given values.
For similar but more difficult equation, 3x-5 = 2 (x-5), students are told
the results for x = 12, x = 5 and x = 0, and each time the differences
between the two sides of the equality are smaller.
38% recommended correctly that the next number should be less than
zero;
19% recommended trying number between 0 and 5;
38% recommended trying number between 5 and 12.
48. Scaling Up Digital Design Studies | NC State University | College of Education
Results from “…Equations in One Variable…”
Representing and Solving
Equations in One Variable
with Justification (C55)
Results
L3: Maintains balance of
equation in order to solve
equations of the form x + p = q
(p, q, and x are rational
numbers).
In the given problem, students are told the equation in the form of
x+1.5 = total time. They are asked how to find x, the number of
hours worked.
73% of them answered correctly to subtract 1.5;
19% suggested adding it;
5% wanted to divide by 1.5.
L4: Maintains balance of
equation in order to solve
equations of the form px = q (p,
q, and x are rational numbers).
Given the formula d × v = m, with values for volume (v) and mass
(m), students were asked to find density.
83% correctly knew to divide by volume, but
8% produced their answer by incorrectly multiplying the two
numbers.
Students were asked to convert the length of a marathon into
kilometers and round.
50% were correct;
33% more were within one kilometer suggesting they rounded
incorrectly;
7% incorrectly multiplied, getting a smaller number of kilometers.
49. Scaling Up Digital Design Studies | NC State University | College of Education
Results from “…Equations in One Variable…”
Representing and Solving
Equations in One Variable
with Justification (C55)
Results
L5: Justifies solutions to simple
equations using inverses and
identity properties to maintain
balance.
For the problem 124/x = 4,
just under 50% could identify both steps of the solution.
Nearly 20% suggested dividing both sides by 124. (This approach could
work, producing 1/x = 1/31.)
At this level, 65% of students thought adding the same amount to both
sides was justified as an additive inverse rather than an additive axiom
of equality
L6: Uses strategies to isolate x on
one side of equation in two or
more operations and maintains
balance to solve.
Students were asked to solve for an unknown using a representation of
a pan balance. When given unknowns on one side and a
representation of the equation (3x+ 6 = 12),
94% got them correct.
When given the figures only and a problem representing 3 x+ 7= 5x+ 1,
the percentage correct dropped to 84%.
L7: Describes situations using
linear equations and solves.
Students were given an isosceles triangle with a base of n and told the
other two sides were congruent and one was labeled 3n+4 equal to 28:
58% solved it correctly;
32% said there was not enough information, perhaps indicating a
failure to use the information about congruent sides.
50. Scaling Up Digital Design Studies | NC State University | College of Education
Results from “…Equations in One Variable…”
Representing and Solving
Equations in One Variable
with Justification (C55)
Results
L8: Justifies method for solving
equations with x on one side only
using properties (inverse,
identity, distributivity,
commutativity, and axioms of
equality).
The students were asked to order the steps to solve
5 − 5x +2(7 − x) + 9 = 0:
87% got all 4 correct.
L9: Uses strategies to eliminate
x's on one side of equation,
maintains balance to solve, and
justifies.
Students were given 6w = -2w + 24:
89% choose adding 2w to both sides correctly and 91% identified the
correct solution.
Students were also given the equation x+36+ x3=x+74 ,
and asked to choose productive first steps from a set of options.
36% multiplied each term by a name for one (2/2, 4/4 and 3/3) to
produce a common denominator.
43% multiplied both sides by 12.
12% recognized either as a correct option.
10% chose only multiplying by 12, which is defensible as a sole answer.
35%% of the students incorrectly selected subtracting 7 from both
sides.
19% wanted to divide by x.
21% wanted to subtract 3.
51. Scaling Up Digital Design Studies | NC State University | College of Education
Results from “…Equations in One Variable…”
Representing and Solving
Equations in One Variable
with Justification (C55)
Results
L10: Interprets meaning of one
solution, multiple solutions, and
no solution for equations with x's
on both sides.
Students were given the problem 12x −15 = 3(4x − 5) and are told it
has an infinite number of solutions. They are given other equations
which differ in one value. They are asked which of the others will have
no solution. The two correct answers change either the value 15 or 5.
73% recognized the effect of changing the 5;
55% saw the change of the 15;
Only 7% got them both.
On the second item at this level, students were shown a solution that
results in a true statement and therefore infinitely many solutions.
66% picked infinitely many.
24 said there was no solution.
19% thought that the expression 6 = 6 implied that 6 was the
solution.
14% said “rework the problem” because there must have been a
mistake.
52. Scaling Up Digital Design Studies | NC State University | College of Education
Representing and Solving Equations in One Variable:
L10: Interprets meaning of one solution, multiple solutions, and no
solution for equations with x's on both sides
L7 Describes situations using linear equations and solves
Student responses:
• 66% correctly chose
option 4, but only 44%
only chose option 4.
24% of the students said there were no solutions
19% thought that the answer was 6,
14% incorrectly said a mistake was made. and the
student should start over.
53. Scaling Up Digital Design Studies | NC State University | College of Education
Results from “…Inequalities in One Variable…”
Representing and Solving
Inequalities in One Variable
with Justification (C56)
Results
L1: Understands that x< a means
that x can be equal to a whole
range of numbers.
Students were asked to match a set of descriptions of inequalities to
their symbolic display.
Only 67% of students got all of these correct.
92% correctly matched “50 less than a number is no more than 7”;
Only 70% correctly matched “ 7 more than a number is no more
than 50” to its symbolic representation.
“50 is less than or equal to a number plus 7” was a strong distractor
for 14% of the students on this item.
54. Scaling Up Digital Design Studies | NC State University | College of Education
Results from “…Inequalities in One Variable…”
Representing and Solving
Inequalities in One Variable
with Justification (C56)
Results
L2: Identifies contexts in which
inequalities apply.
Students were asked to identify which of a set of solutions that
completely represent x ≤ 8. The solutions included two correct
answers:
32% chose one that used the infinity symbol;
68% chose a graph of a number line.
The incorrect solutions included a variety discrete set of values ≤ 8,
chosen by 60%, 31%, and 25% of the students.
8% misread the inequality sign choosing values greater than 8.
In the second item, students were asked to identify which solution
sets contain values that make an inequality true:
79% chose the complete answer as one option.
Shown four correct discrete-valued options,
65% identified all correct integer values,
17% chose the graph with an open circle,
30% used the infinity sign,
60% chose 8 (which was on the boundary),
46% chose the single value of 3.5.
In a third example, the inequality 5 > x:
86% choose values correctly,
14% misread the direction of the relationship.
55. Scaling Up Digital Design Studies | NC State University | College of Education
Results from “…Inequalities in One Variable…”
Representing and Solving
Inequalities in One Variable
with Justification (C56)
Results
L3: Solves simple inequalities by
inspection, guess, check, and
adjust to find a range of solutions.
Students were given |x| > 5, and were asked to select all numbers
that made the inequality true.
85% chose 6.
62% chose -6.
(23% more students chose 6 than -6)
58% choose 23/4.
Overall, only 42% got full credit.
Given 3x − 4 ≥ 8,
Only 42% chose the correct solution.
39% of incorrect responders chose x≤ 8.
L4: Maintains balance of equation
in order to solve Inequalities of
the form x + p = q (p, q, and x are
rational numbers).
No items at this level
56. Scaling Up Digital Design Studies | NC State University | College of Education
Results from “…Inequalities in One Variable…”
Representing and Solving
Inequalities in One Variable
with Justification (C56)
Results
L5: Maintains balance of equation
in order to solve Inequalities of the
form px <> q (p, q, and x are
rational, including switching
inequality for negative multipliers).
Students were highly successful for b/3 ≥ 12:
96% correctly chose b>36, 91% selected b = 36. In inequalities, it may
be the case that this form is easier than the x+p.
For the item -y < 16, the problem requires students to multiply or
divide by -1 and know to reverse the sign, unless they figure out the
solution by trial and error.
Only 16% answered this item correctly;
63% answered incorrectly y < 16.
10% chose y > 16 (a partial solution but students have to understand
the item demands a complete solution.
11% choose y < -16.
L6: Justifies solutions to simple
inequalities using inverses and
identity properties to maintain
balance.
No items at this level
L7: Uses strategies to isolate x for
inequalities with x on one side of
Inequality and maintains balance
to solve.
No items at this level
57. Scaling Up Digital Design Studies | NC State University | College of Education
Results from “…Inequalities in One Variable…”
Representing and Solving
Inequalities in One Variable
with Justification (C56)
Results
L8: Describes situations using
linear inequalities and solves.
In the tee-shirt canon item, the majority of students found the
correct values to solve the given equation (10x + 15 ≥ 45).
93% selected the boundary condition correctly, but 85-88%
answered completely correct, suggesting difficulty with selecting
the interval and not just the boundary value.
When requested to identify the correct inequality in a context of
attending a fair, student performance dropped.
30% got full credit for identifying two possible inequalities—
77% chose one correct option, 54% chose the other.
For an item about bungee jumping, (2x + 6 + 20 < 300), 56%
correctly answered the problem.
31% incorrectly gave the solution that the bungee was < 300 (giving
as the solution the right side of the original equation).
58. Scaling Up Digital Design Studies | NC State University | College of Education
Results from “…Inequalities in One Variable…”
Representing and Solving
Inequalities in One Variable
with Justification (C56)
Results
L9: Justifies method for solving
inequalities with x on one side
only using properties (inverse,
identity, distributive property,
commutativity, and axioms of
inequality.
When students were given a set of steps solving an inequality using
properties:
89% correctly chose the distributive property,
only 28% correctly chose the additive property of inequality for the
second step.
58% chose the additive inverse incorrectly.
Only 32% correctly chose the additive identity;
63% correctly chose the division axiom of equality.
When students were asked to debug a student solution for finding x
for -4(p+3) + 6 ≥ 22:
55% correctly found the error in the first step on distributing a
negative number;
22% mistakenly said the last step, where the inequality was
reversed, represented the error.
59. Scaling Up Digital Design Studies | NC State University | College of Education
Results from “…Inequalities in One Variable…”
Representing and Solving
Inequalities in One Variable
with Justification (C56)
Results
L10: Uses strategies to eliminate x
on one side of inequality,
maintaining balance to solve, and
justifies.
For 4x + 40 < -8x – 8:
61% solved correctly;
21% failed to correctly reverse the inequality sign.
For 3x + 1 > 5x – 3:
79% correctly solved,
but 18% chose either x > 4 or x < 4.
60. Scaling Up Digital Design Studies | NC State University | College of Education
Student Difficulties with Ranges and Intervals in
Inequalities
Two examples
EX. 1: which solution set contain values that make the
inequality true
EX 2: which of the following represents a complete solution
61. Scaling Up Digital Design Studies | NC State University | College of Education
Student responses:
• 79% chose the complete answer as one option.
• 65% identified all correct integer values.
• 17% chose the graph with an open circle.
• 30% recognized the use of the infinity sign.
• 60% selected the value of 8 on the boundary.
• 46% chose the single value of 3.5
62. Scaling Up Digital Design Studies | NC State University | College of Education
Student responses:
• 32%: the choice using the infinity symbol.
• 68%: the number-line graph with a closed circle.
• 60%: (incorrectly) selected {…, -2, -1, 0, 1, 2, 3, 4,
5, 6. 7, 8}, (integer domain)
• 31%: the single value 8.
• 25%: the single value 3.5.
• Only 2 of 62 students selected both correct
answers with no incorrect answers.
63. Scaling Up Digital Design Studies | NC State University | College of Education
Overall Results for RLC
Summary Table for Results for Four Constructs
Representing and Solving Equations in
One Variable with Justification
Can substitute to solve showing some weakness on
distributivity.
Understands the pan balance model.
Need work on atypical equations with x in
denominator of a direct variation or with
fractional terms.
Showed weakness applying to geometric context
Need work on multiple or no solutions.
Representing and Solving Inequalities in
One Variable with Justification
Can solve simple inequalities.
Have difficulty with flipping the sign.
Need work on distributivity and axioms of
inequality.
Need practice on writing inequalities in applied
contexts.
Describing Patterns and Relations Using
Algebraic Expressions
Can solve only simple patterns.
Lack knowledge of formal terminology associated
with the structure of the expressions that
support later parameterization of expressions.
Demonstrate only rudimentary understanding of
how to adjust parameters in patterns and explain
structural changes.
Finding Equivalent Expressions and
Substituting Values
Translates easy expressions showing weakness in
subtraction.
Substitutes values successfully.
Recognizes equivalent expressions only in simple
cases and misses distributivity and multiplication
by negatives.
Has some difficulty associating expressions with
complex diagrams and contexts.
64. Scaling Up Digital Design Studies | NC State University | College of Education
Implications of the Diagnostic Cycle
• It functions in support of a set of formative assessment
practices:
– Process oriented and criterion-oriented
– Occurs in real time
– It supports discourse
– Shares responsibility with students
• Adds to formative assessment:
– Personalizes results to students
– Shows representativeness for whole class
– Supports the creation of flexible groups
– Documents progress over time
65. Scaling Up Digital Design Studies | NC State University | College of Education
The Great Challenge
• What to do with this information?
• We will be studying this in partnership with our districts
and schools next.
• Invite me back in 2-3 years???
66. Scaling Up Digital Design Studies | NC State University | College of Education
Conclusions
• Important to systematically make the results of research on
students’ learning trajectory accessible to students and
teachers;
• Learning trajectories are useful ways to encapsulate empirical
results on learning;
• Learning Maps can help students and teachers visualize
content to be learned around big ideas and anticipate
reasoning patterns;
• Diagnostic assessments tied to proficiency levels in LT can
provide just in time information to guide instruction; and
• Diagnostic information can help know what to reteach, how to
target information for individual needs, how to promote
formative discussions, and how to form flexible groups.
• Much work remains, to translate into instructional actions.
67. Scaling Up Digital Design Studies | NC State University | College of Education
• Thank you for your time and attention.