Download as PDF, PPTX
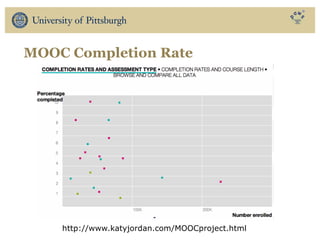
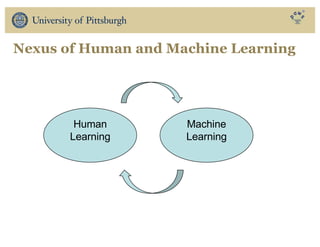


The document discusses the use of educational data mining and visual learning analytics to enhance teaching and learning through data-driven education, particularly in Massive Open Online Courses (MOOCs). It highlights techniques for predicting student dropouts, personalizing learning processes, and utilizing past learners' data to improve future educational experiences. Additionally, it showcases research results on behavior patterns, individual differences, and the effectiveness of open social student modeling in increasing student engagement and success.