Download to read offline


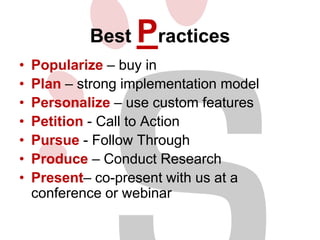
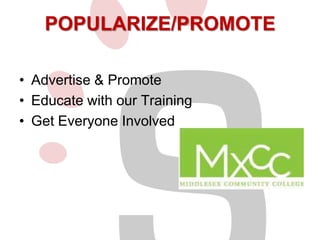
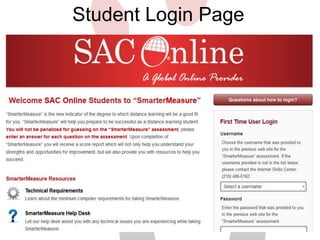
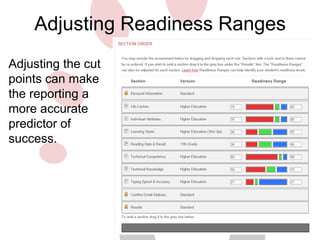
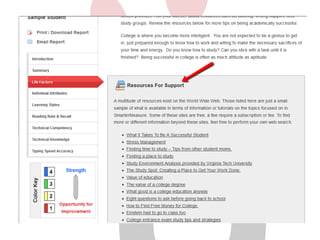
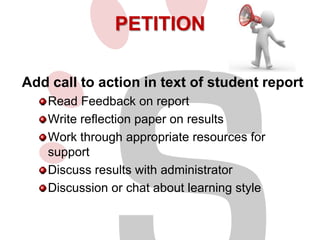
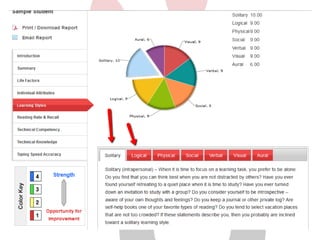
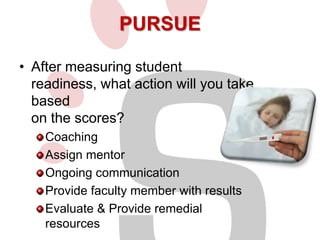
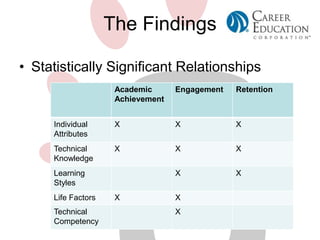
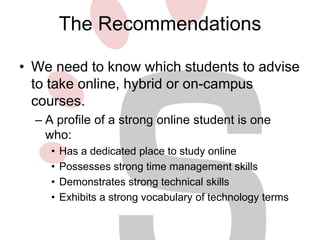
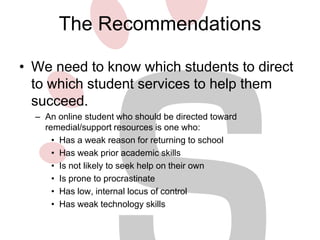
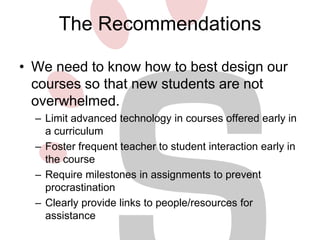
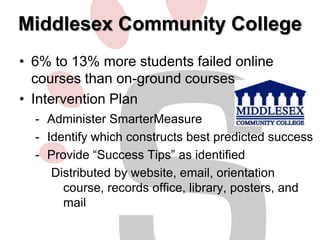
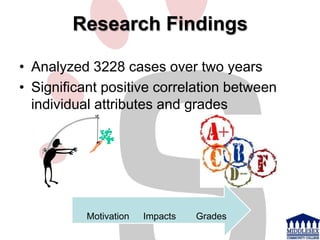
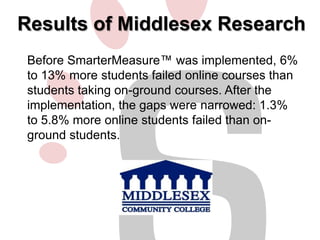
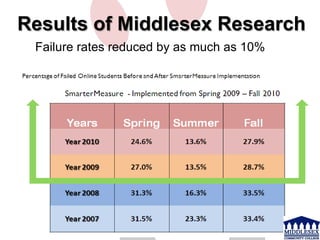


The document outlines best practices for using SmarterMeasure, an assessment tool that measures student readiness for online or distance learning. It recommends popularizing the tool through promotion and training, planning strong implementation models, personalizing the tool through custom features, adding calls to action, following up on results, conducting research on correlations between scores and outcomes, and presenting findings at conferences to showcase results. Case studies show correlations between readiness scores and grades/retention, and that interventions targeting low scores helped narrow gaps in online course pass rates.


