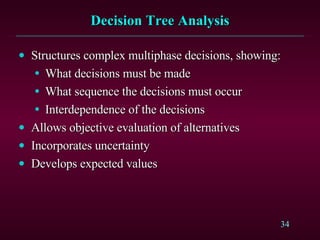
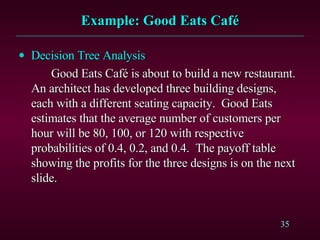
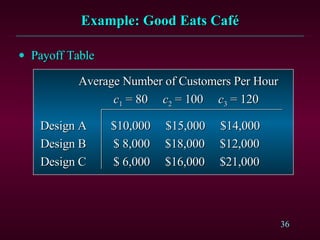
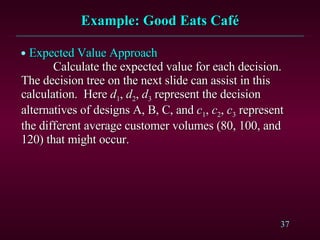
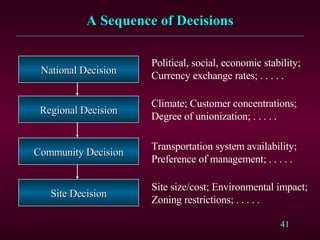
The document discusses facility planning and capacity management. It covers estimating future capacity needs, analyzing sources to meet demand, and selecting expansion options. Key factors in facility location include transportation, resources, costs, and economic conditions at the national, regional, and local levels. Decision tools like break-even analysis and decision trees can help evaluate capacity and location alternatives.
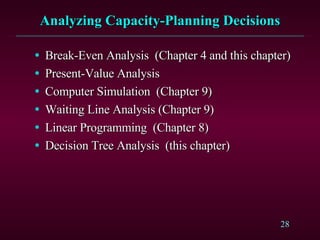
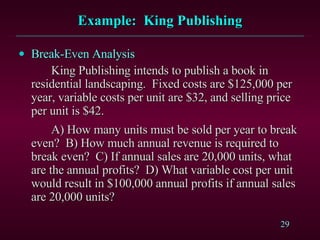
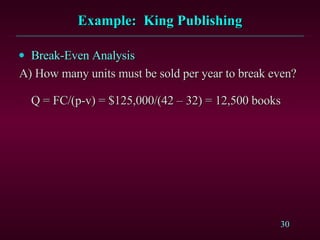
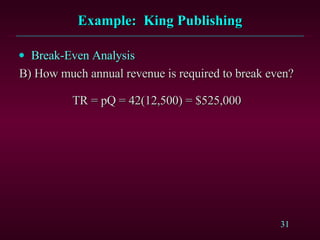
![Example: King Publishing Break-Even Analysis C) If annual sales are 20,000 units, what are the annual profits? P = pQ – (FC + vQ) = 42(20,000) – [125,000 + 32(20,000)] = 840,000 – 125,000 – 640,000 = $75,000](https://image.slidesharecdn.com/lay-out-1197636456227861-3/85/lay-out-32-320.jpg)
![Example: King Publishing Break-Even Analysis D) What variable cost per unit would result in $100,000 annual profits if annual sales are 20,000 units? P = pQ – (FC + vQ) 100,000 = 42(20,000) – [125,000 + v(20,000)] 100,000 = 840,000 – 125,000 – 20,000v 20,000v = 615,000 v = $30.75](https://image.slidesharecdn.com/lay-out-1197636456227861-3/85/lay-out-33-320.jpg)


![5 Capacity Planning [Autosaved].pptx](https://cdn.slidesharecdn.com/ss_thumbnails/5capacityplanningautosaved-230830162051-7718efd6-thumbnail.jpg?width=640&height=640&fit=bounds)


![Facility Capacity Planning & its Measurement[1] - Copy.pptx](https://cdn.slidesharecdn.com/ss_thumbnails/facilitycapacityplanningitsmeasurement1-copy-230803170020-7fcd8ff9-thumbnail.jpg?width=640&height=640&fit=bounds)
![Facility Capacity Planning & its Measurement[1].pptx](https://cdn.slidesharecdn.com/ss_thumbnails/facilitycapacityplanningitsmeasurement1-230803170019-bac8b4cf-thumbnail.jpg?width=640&height=640&fit=bounds)
![Product1 [4] capacity planning](https://cdn.slidesharecdn.com/ss_thumbnails/product14-capacityplanning-190226032041-thumbnail.jpg?width=640&height=640&fit=bounds)


