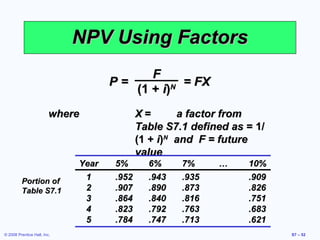
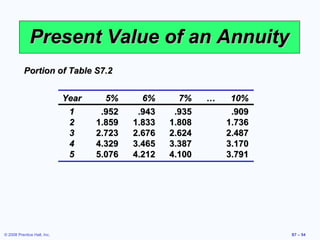
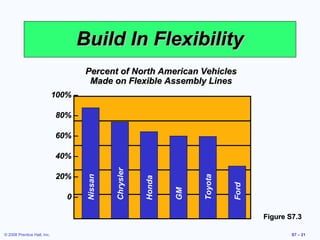
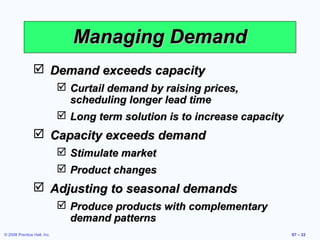
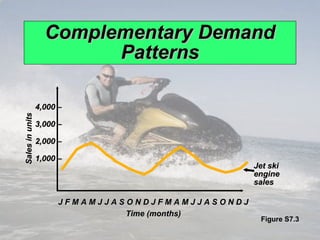
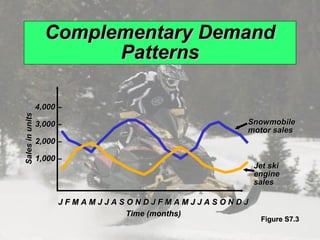
The document outlines concepts related to capacity planning, including:
1. It defines design capacity, effective capacity, and utilization, and provides an example to calculate these metrics for a bakery.
2. It discusses different approaches to managing capacity, such as leading or lagging demand, and making incremental vs. one-time capacity expansions.
3. It introduces break-even analysis as a technique to evaluate capacity alternatives by finding the point where total costs equal total revenue. Key variables in the analysis include fixed costs, variable costs, price, and production volume.
Mba om 06_capacity_planningandfacilitylocationNiranjana K.R.
Topic: Operations Management, Degree: MBA, Semester: II Syllabus: Mysore University. Date : Jan 2015.
Please note: This was prepared as a teaching aid. Not for commercial purposes. Sharing to spread the knowledge of operations management. Note : Copyright belongs to respective owners. List of top references used to prepare these slides given.
If you have any questions, comments, improvement suggestions, Email to: niranjanakoodavalli@gmail.com
Siebel - Oracle Real Time Scheduler integrationJeroen Burgers
The latest Siebel - ORS integration is available with the 8.1.1.10 Fix Pack / Oracle Real-time Scheduler 2.1.
- Align service execution with company objective
- Improve service tech productivity and visibility to the enterprise-
- Reduce travel time and distance
- Significantly increase service center efficiencies
- Offer New or Improved Customer Services
Exploring the risk factors associated with peb projects in lahore.Rizwan Khurram
The construction industry is more exposed to risk than other industry. If the risk is not handled properly it may causes the poor performance on the industry. The Scale of building projects is large in nature and having large amount of investment. Wastage of any resource influence is high loss in project. All the losses are associated with risk factors. In Pakistan, only few researches have been done so far in this area. Thus this study needs focus of risk management in field of construction projects. We conclude from study that financial issue, skillful workers, shortage and inaccurate design are significant risk factors affecting the projects. Contractors are responsible for risk linked with machinery, material and quality related issues. While clients are responsible for the risk associated with scope of work. Study concludes that good coordination and communication between stakeholders and proper drawings works are key factors to control the project.
three phase of change,management of complex change,organizational change, Kotter eight steps, Bullock and batten, planned change,machine political organism, beckhar and harris change formula organism, kotter eight step with example
introduction to change management, what is change,categories of change, why change,organizational change,reaction of change,lewins theory, philosphy of change.
This slide provides some reasons that capacity is an issue. The following slides guide a discussion of capacity.
This slide can be used to frame a discussion of capacity. Points to be made might include: - capacity definition and measurement is necessary if we are to develop a production schedule - while a process may have “maximum” capacity, many factors prevent us from achieving that capacity on a continuous basis. Students should be asked to suggest factors which might prevent one from achieving maximum capacity.
It might be useful at this point to discuss typical equipment utilization rates for different process strategies if you have not done so before.
You might point out to students that this slide links capacity to work measurement (standard times).
This slide probably requires some discussion or explanation. Perhaps the best place to start is the left hand column where capacity either leads or lags demand incrementally. As you continue to explain the options, ask students to suggest advantages or disadvantages of each.
This chart introduces breakeven analysis and the breakeven or crossover chart. As you discuss the assumptions upon which this techniques is based, it might be a good time to introduce the more general topic of the limitations of and use of models. Certainly one does not know all information with certainty, money does have a time value, and the hypothesized linear relationships hold only within a range of production volumes. What impact does this have on our use of the models?
This slide suggests that the process selection decision should be considered in light of the larger strategic initiative