Downloaded 2,896 times


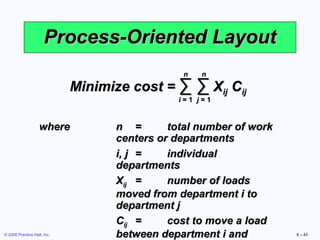
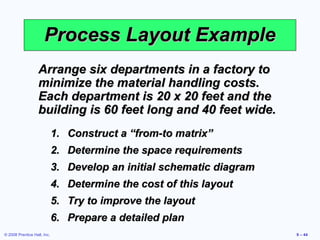
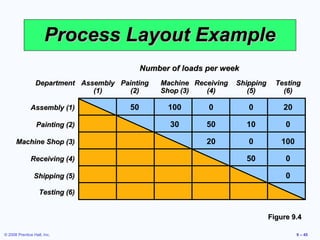
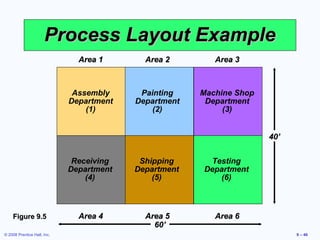
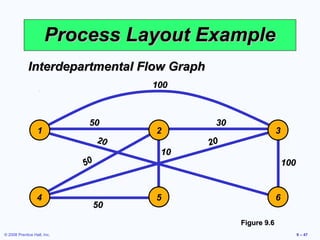
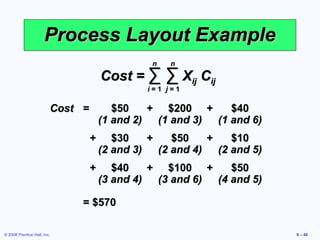
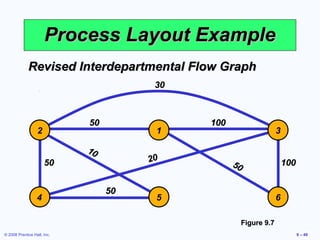
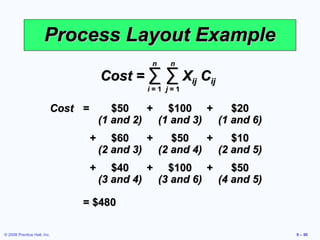
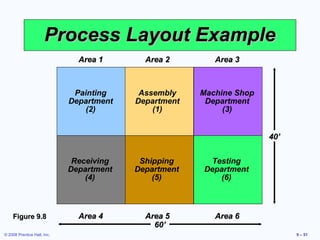


Here is a process to minimize material handling costs for arranging 6 departments in a factory layout: 1. Map the material flow between each department pair and estimate the volume of material (Xij) and cost per load (Cij) moved between each pair. 2. Calculate the total material handling cost (MHC) for each possible layout arrangement by summing the costs between each department pair: MHC = ΣΣ XijCij 3. Try arranging the departments in different layouts that vary the distances between department pairs to minimize the total MHC. For example, arrange departments with the highest material flow closest together. 4. Compare the total MHC for each layout arrangement and select the one with the lowest cost


