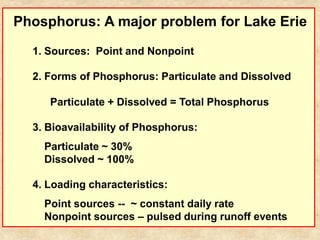
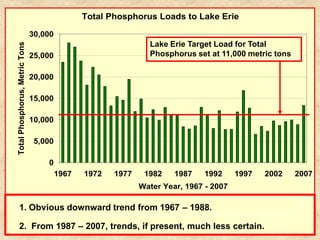
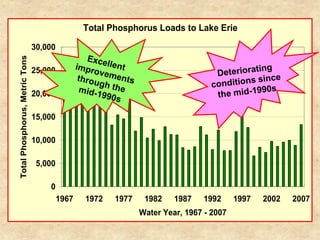
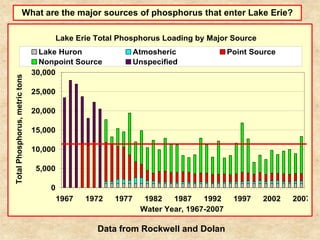
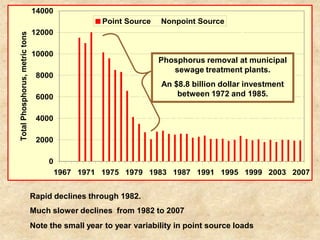
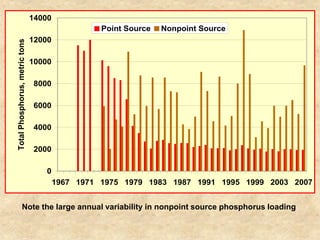
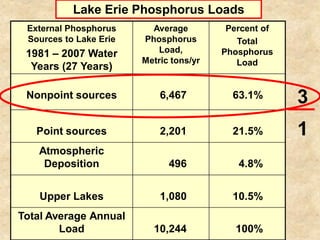
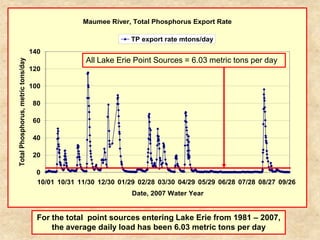
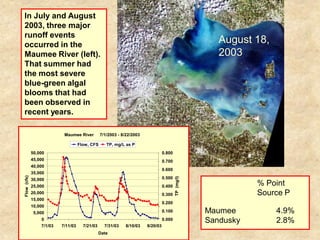
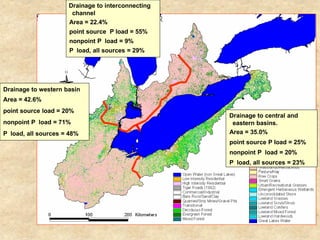
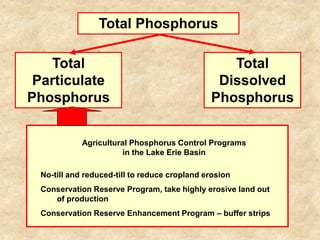
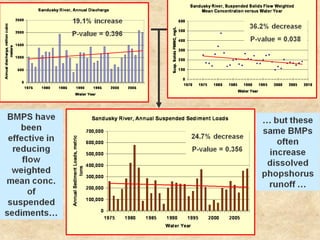
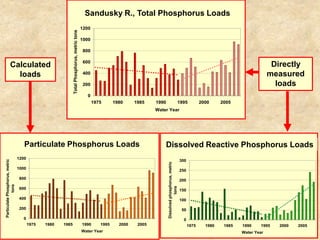
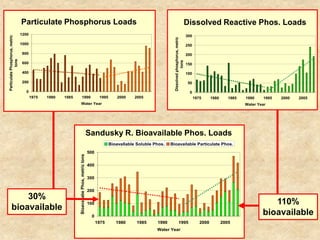
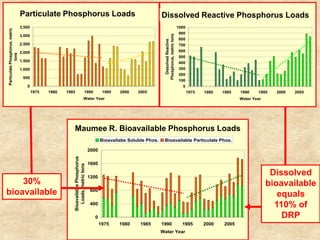
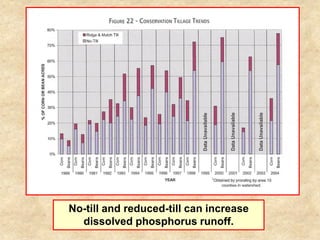
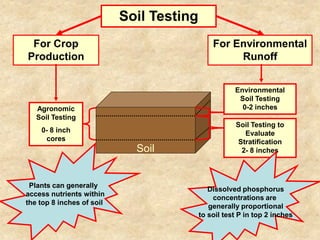
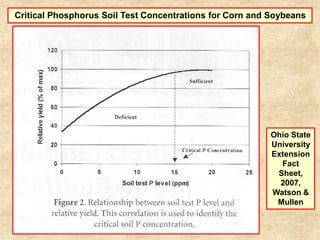
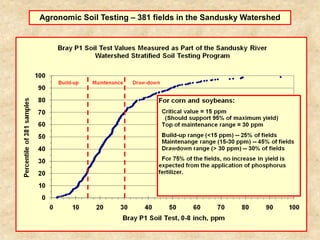
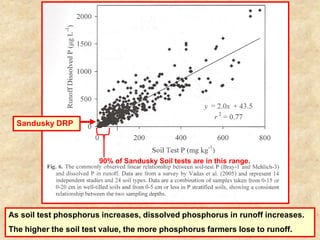
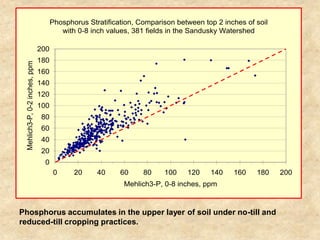
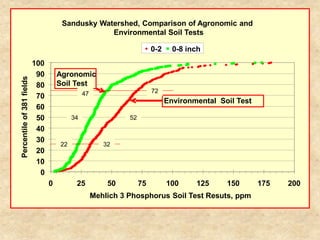
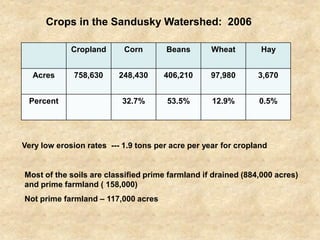
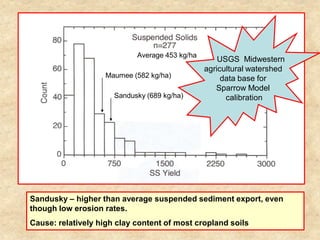
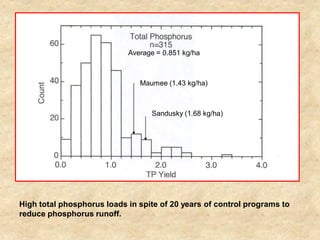
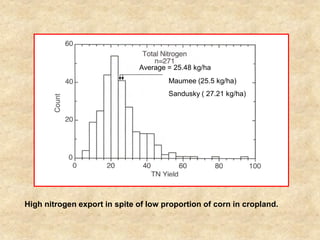
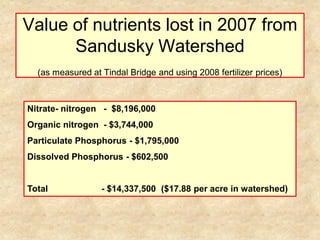
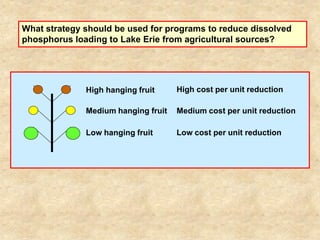
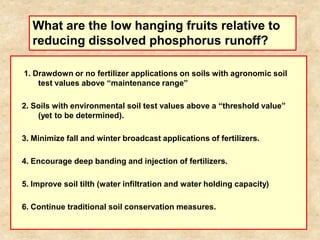
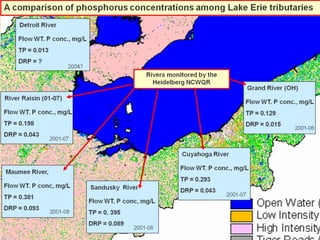
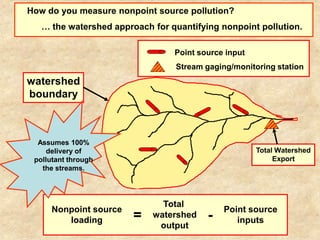
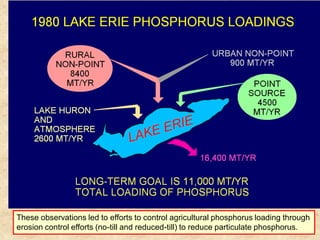
This document summarizes a presentation on phosphorus loading trends in Lake Erie. It finds that while point source phosphorus loads have significantly decreased due to sewage treatment upgrades, nonpoint source loads from agricultural runoff have not declined as sharply and show more annual variability. Specifically, the Maumee and Sandusky Rivers in Ohio export high levels of dissolved reactive phosphorus due to accumulation in surface soils under no-till practices. Reducing soil test phosphorus levels could help lower phosphorus losses to runoff.
The Clean Power Plan and CHP: How Combined Heat and Power can help Ohio achie...Ohio Environmental Council
On August 3, 2015 the US EPA finalized the Clean Power Plan (CPP), which requires states to reduce carbon emissions from power plants using a variety of strategies, including Combined Heat and Power (CHP). The US EPA gave states a great amount of flexibility in how to meet carbon reduction goals, creating an opportunity for the state to take advantage of Ohio's great CHP potential.
As Ohio moves forward with developing a state plan, this webinar will examine precisely how the Clean Power Plan treats CHP and what options the state has to include CHP as a carbon-reducing strategy. Webinar participants will have the opportunity to ask questions of presenters and review presentation materials after the conclusion of the webinar.
In September 2013, a group of scientists and specialists came together under the 2012 Great Lakes Water Quality Agreement’s Nutrient Annex 4 Objectives and Targets Task Team to determine how much phosphorus reduction is necessary to restore Lake Erie’s water quality, reduce the occurrences harmful algal blooms in western Lake Erie, as well as the extent of the central basin’s hypoxic zone.
The Annex 4 task team released their report in late June 2015 and Dr. Jeffery Reutter, task team co-chair, will present the group’s findings and what it means to the lake if the loading and concentration targets are met.
Santina Wortman, an official from the U.S. EPA Region 5 office will also be on hand to answer questions and explain next steps for the agency.
Recently, Dayton Power & Light (DP&L) launched a CHP-specific incentive under the electric utility’s custom rebate program, per the policy established by Governor Kasich’s 21st Century Energy Initiative (Ohio Senate Bill 315). This presentation features DP&L energy efficiency program staff who provide details on the program incentive that is available to customers of Dayton Power & Light. Additionally, facilitators of the Ohio Coalition for Combined Heat and Power provide a state policy update.
Over 1,000 fracking wells have been drilled in Ohio in the past three years. W have seen numerous accidents associated with fracking in Ohio including a chemical fire and release, earthquakes, fires, and explosions. Still, there has been no assessment of the current or expected health impacts from fracking in our state, and little to no training for medical professionals and emergency responders.
The meeting with Southwest Pennsylvania Environmental Health Project was a forum to begin a dialogue about the health impacts associated with fracking.
Scientists have identified this commonly used sealcoat as a major source of dangerous chemicals in streams and lakes, and as a significant health risk to the public, especially young children. These chemicals, which will are discussed in depth in the webinar, are found in the sediments of nearby lakes and streams from pavements coated with this type of product.
Our expert speaker is Dr. Barbara Mahler, a Research Hydrologist with the USGS at the Texas Water Science Center. She is part of the Contaminant Trends in Lake Sediments (CTLS) team, which uses cores of sediments from lakes to reconstruct the contaminant histories of watersheds.
Toxic chemicals can be found in ALL of our homes – in things like our couches, on our clothes, and in food and personal care products like shampoo. These chemicals make their way into our bodies and have long term health impacts (cancer, infertility, learning disabilities in children, etc).
Right now there is a bill in Congress which would takes us backwards in our federal regulation of toxic chemicals. It is called the Chemicals in Commerce Act (CICA). CICA includes sweeping state preemption language which would overturn some of our important legislative progress in Ohio. The bill is unanimously opposed by the environmental and public health community.
In Ohio, we have the opportunity to be an important player as we have two US Representatives, Congressman Bill Johnson and Congressman Bob Latta on the subcommittee that will be voting on this bill.
A Lake Erie Twofer: Tiny Plastic Particles and Toxic Algae Threaten Lake WatersOhio Environmental Council
A panel of experts discuss the impact of toxic algae and microbeads on the health and well-being of Lake Erie.
Presenters:
- Dr. Jeffery Reutter, Director Ohio Sea Grant College Program
- Dr. Sue Watson, Research Scientist, WHERD, Water Science and Technology, Environment Canada
- Andy McClure, Administrator, Collins Park Water Treatment, Toledo, OH
- Dr. Sheri Mason, Professor, Department of Chemistry and Biochemistry at SUNY Fredonia
Presentation of the webinar on 10-21-13 by the Ohio Environmental Council about the proposed legislation (Ohio Senate Bill 58) that would weaken Ohio's clean energy laws.
Slides from the Oct 9, 2013, webinar "Building Your Best Board (Part 2)," presented by the Ohio Environmental Council, River Network, and the Institute for Conservation Leadership
Slides from the Oct 2, 2013, webinar "Building Your Best Board," presented by the Ohio Environmental Council, River Network, and the Institute for Conservation Leadership.
Contending that Ohioans are not adequately protected from the risks of horizontal, hydrological fracturing - or "fracking" - for oil and gas, the Ohio Environmental Council is proposing a sweeping upgrade to state oil and gas laws. The proposed bill, called SAFER GAS (Safeguarding Appalachian Families with Environmental Regulation of Gas And Shale), shores up more than 30 gaps in Ohio law.
Macroeconomics- Movie Location
This will be used as part of your Personal Professional Portfolio once graded.
Objective:
Prepare a presentation or a paper using research, basic comparative analysis, data organization and application of economic information. You will make an informed assessment of an economic climate outside of the United States to accomplish an entertainment industry objective.
Acetabularia Information For Class 9 .docxvaibhavrinwa19
Acetabularia acetabulum is a single-celled green alga that in its vegetative state is morphologically differentiated into a basal rhizoid and an axially elongated stalk, which bears whorls of branching hairs. The single diploid nucleus resides in the rhizoid.
A Strategic Approach: GenAI in EducationPeter Windle
Artificial Intelligence (AI) technologies such as Generative AI, Image Generators and Large Language Models have had a dramatic impact on teaching, learning and assessment over the past 18 months. The most immediate threat AI posed was to Academic Integrity with Higher Education Institutes (HEIs) focusing their efforts on combating the use of GenAI in assessment. Guidelines were developed for staff and students, policies put in place too. Innovative educators have forged paths in the use of Generative AI for teaching, learning and assessments leading to pockets of transformation springing up across HEIs, often with little or no top-down guidance, support or direction.
This Gasta posits a strategic approach to integrating AI into HEIs to prepare staff, students and the curriculum for an evolving world and workplace. We will highlight the advantages of working with these technologies beyond the realm of teaching, learning and assessment by considering prompt engineering skills, industry impact, curriculum changes, and the need for staff upskilling. In contrast, not engaging strategically with Generative AI poses risks, including falling behind peers, missed opportunities and failing to ensure our graduates remain employable. The rapid evolution of AI technologies necessitates a proactive and strategic approach if we are to remain relevant.
Unit 8 - Information and Communication Technology (Paper I).pdfThiyagu K
This slides describes the basic concepts of ICT, basics of Email, Emerging Technology and Digital Initiatives in Education. This presentations aligns with the UGC Paper I syllabus.
Operation “Blue Star” is the only event in the history of Independent India where the state went into war with its own people. Even after about 40 years it is not clear if it was culmination of states anger over people of the region, a political game of power or start of dictatorial chapter in the democratic setup.
The people of Punjab felt alienated from main stream due to denial of their just demands during a long democratic struggle since independence. As it happen all over the word, it led to militant struggle with great loss of lives of military, police and civilian personnel. Killing of Indira Gandhi and massacre of innocent Sikhs in Delhi and other India cities was also associated with this movement.
Synthetic Fiber Construction in lab .pptxPavel ( NSTU)
Synthetic fiber production is a fascinating and complex field that blends chemistry, engineering, and environmental science. By understanding these aspects, students can gain a comprehensive view of synthetic fiber production, its impact on society and the environment, and the potential for future innovations. Synthetic fibers play a crucial role in modern society, impacting various aspects of daily life, industry, and the environment. ynthetic fibers are integral to modern life, offering a range of benefits from cost-effectiveness and versatility to innovative applications and performance characteristics. While they pose environmental challenges, ongoing research and development aim to create more sustainable and eco-friendly alternatives. Understanding the importance of synthetic fibers helps in appreciating their role in the economy, industry, and daily life, while also emphasizing the need for sustainable practices and innovation.
Exploiting Artificial Intelligence for Empowering Researchers and Faculty, In...Dr. Vinod Kumar Kanvaria
Exploiting Artificial Intelligence for Empowering Researchers and Faculty,
International FDP on Fundamentals of Research in Social Sciences
at Integral University, Lucknow, 06.06.2024
By Dr. Vinod Kumar Kanvaria
Normal Labour/ Stages of Labour/ Mechanism of LabourWasim Ak
Normal labor is also termed spontaneous labor, defined as the natural physiological process through which the fetus, placenta, and membranes are expelled from the uterus through the birth canal at term (37 to 42 weeks
Safalta Digital marketing institute in Noida, provide complete applications that encompass a huge range of virtual advertising and marketing additives, which includes search engine optimization, virtual communication advertising, pay-per-click on marketing, content material advertising, internet analytics, and greater. These university courses are designed for students who possess a comprehensive understanding of virtual marketing strategies and attributes.Safalta Digital Marketing Institute in Noida is a first choice for young individuals or students who are looking to start their careers in the field of digital advertising. The institute gives specialized courses designed and certification.
for beginners, providing thorough training in areas such as SEO, digital communication marketing, and PPC training in Noida. After finishing the program, students receive the certifications recognised by top different universitie, setting a strong foundation for a successful career in digital marketing.
Digital Tools and AI for Teaching Learning and Research
LaMP Presentation, David Baker
1. Lake Erie LaMP Public Forum, Erie, PA
November 6-7, 2009
Recent Trends in
Phosphorus Loading to Lake Erie:
Role of Changing Agricultural Production Practices
David Baker, Senior Research Scientist
National Center for Water Quality Research
Heidelberg University, Tiffin, OH
2. Phosphorus: A major problem for Lake Erie
1. Sources: Point and Nonpoint
2. Forms of Phosphorus: Particulate and Dissolved
Particulate + Dissolved = Total Phosphorus
3. Bioavailability of Phosphorus:
Particulate ~ 30%
Dissolved ~ 100%
4. Loading characteristics:
Point sources -- ~ constant daily rate
Nonpoint sources – pulsed during runoff events
3. The Lake Erie Watershed: Current Land Use
Excessive
phosphorus loads
a primary cause
4. Total Phosphorus Loads to Lake Erie
30,000
Lake Erie Target Load for Total
Total Phosphorus, Metric Tons
25,000 Phosphorus set at 11,000 metric tons
20,000
15,000
10,000
5,000
0
1967 1972 1977 1982 1987 1992 1997 2002 2007
Water Year, 1967 - 2007
1. Obvious downward trend from 1967 – 1988.
2. From 1987 – 2007, trends, if present, much less certain.
5. Total Phosphorus Loads to Lake Erie
30,000
Total Phosphorus, Metric Tons
25,000
20,000
15,000
10,000
5,000
0
1967 1972 1977 1982 1987 1992 1997 2002 2007
Water Year, 1967 - 2007
6. What
happened?
Let’s take a closer look at phosphorus
loading to Lake Erie --
Especially from Northwestern Ohio and
the Sandusky and Maumee Rivers
7. What are the major sources of phosphorus that enter Lake Erie?
Lake Erie Total Phosphorus Loading by Major Source
Lake Huron Atmosheric Point Source
Nonpoint Source Unspecified
30,000
Total Phosphorus, metric tons
25,000
20,000
15,000
10,000
5,000
0
1967 1972 1977 1982 1987 1992 1997 2002 2007
Water Year, 1967-2007
Data from Rockwell and Dolan
8. 14000
Point Source Nonpoint Source
12000
Total Phosphorus, metric tons
10000
Phosphorus removal at municipal
sewage treatment plants.
8000
An $8.8 billion dollar investment
6000 between 1972 and 1985.
4000
2000
0
1967 1971 1975 1979 1983 1987 1991 1995 1999 2003 2007
Rapid declines through 1982.
Much slower declines from 1982 to 2007
Note the small year to year variability in point source loads
9. 14000
Point Source Nonpoint Source
12000
Total Phosphorus, metric tons
10000
8000
6000
4000
2000
0
1967 1971 1975 1979 1983 1987 1991 1995 1999 2003 2007
Note the large annual variability in nonpoint source phosphorus loading
10. Lake Erie Phosphorus Loads
External Phosphorus Average Percent of
Sources to Lake Erie Phosphorus Total
1981 – 2007 Water Load, Phosphorus
Metric tons/yr Load
Years (27 Years)
Nonpoint sources 6,467 63.1% 3
Point sources 2,201 21.5% 1
Atmospheric
Deposition 496 4.8%
Upper Lakes 1,080 10.5%
Total Average Annual
Load 10,244 100%
11. Maumee River, Total Phosphorus Export Rate
TP export rate mtons/day
140
All Lake Erie Point Sources = 6.03 metric tons per day
Total Phosphorus, metric tons/day
120
100
80
60
40
20
0
10/01 10/31 11/30 12/30 01/29 02/28 03/30 04/29 05/29 06/28 07/28 08/27 09/26
Date, 2007 Water Year
For the total point sources entering Lake Erie from 1981 – 2007,
the average daily load has been 6.03 metric tons per day
12. In July and August
2003, three major
runoff events
occurred in the
August 18,
Maumee River (left). 2003
That summer had
the most severe
blue-green algal
blooms that had
been observed in
recent years.
Maumee River 7/1/2003 - 8/22/2003
Flow, CFS TP, mg/L as P
50,000 0.800
45,000 0.700
40,000
0.600
35,000
Flow (cfs)
0.500 TP (mg/l)
30,000
25,000 0.400 % Point
20,000 0.300 Source P
15,000
0.200
10,000
5,000 0.100 Maumee 4.9%
0 0.000 Sandusky 2.8%
7/1/03 7/11/03 7/21/03 7/31/03 8/10/03 8/20/03
Date
13. Drainage to interconnecting
channel
Area = 22.4%
point source P load = 55%
nonpoint P load = 9%
P load, all sources = 29%
Drainage to western basin
Area = 42.6%
point source load = 20%
Drainage to central and
nonpoint P load = 71% eastern basins.
P load, all sources = 48% Area = 35.0%
point source P load = 25%
nonpoint P load = 20%
P load, all sources = 23%
15. Total Phosphorus
Total Total
Particulate Dissolved
Phosphorus Phosphorus
Agricultural Phosphorus Control Programs
in the Lake Erie Basin
No-till and reduced-till to reduce cropland erosion
Conservation Reserve Program, take highly erosive land out
of production
Conservation Reserve Enhancement Program – buffer strips
16.
17. Sandusky River, Annual Loads
Sandusky R., Total Phosphorus
of Total Phosphorus Loads
Sandusky River: Total Phosphorus Loads
1200
Total Phosphorus, metric tons
1000
800
600
Calculated Directly
loads 400 measured
200 loads
0
1975 1980 1985 1990 1995 2000 2005
Water Year
Sandusky River Fremont, Sandusky River, Fremont,
Particulate of Particulate Phosphorus
Annual Loads Phosphorus Loads
Particulate Phosphorus Loads Dissolved Reactive Phosphorus Loads
Annual Loads of Dissolved Phosphorus
1200
300
Particulate Phosphorus, metric
1000 Dissolved phosphorus, metric 250
800 200
tons
tons
600 150
400 100
200 50
0 0
1975 1980 1985 1990 1995 2000 2005 1975 1980 1985 1990 1995 2000 2005
Water Year Water Year
18. Sandusky River Fremont, Sandusky River, Fremont,
Particulate Phosphorus Loads
Annual Loads of Particulate Phosphorus Dissolved Reactive Phos. Loads
Annual Loads of Dissolved Phosphorus
1200 300
Particulate Phosphorus, metric
Dissolved phosphorus, metric
1000 250
800 200
tons
tons
600 150
400 100
200 50
0 0
1975 1980 1985 1990 1995 2000 2005 1975 1980 1985 1990 1995 2000 2005
Water Year Water Year
Sandusky R., Bioavailable Phosphorus Loading
Sandusky R. Bioavailable Phos. Loads
Bioavallable Soluble Phos. Bioavailable Particulate Phos.
500
Bioavailabe Phos, metric tons
400
300
200
30%
100 110%
bioavailable
0
bioavailable
1975 1980 1985 1990 1995 2000 2005
Water Year
19. Maumee River, Annual Loads Maumee R., Annual Loading,
Particulate Phosphorus Loads
of Particulate Phosphorus Dissolved Dissolved Reactive Phosphorus Loads
Reactive Phosphorus
3,500 1000
Particulate Phosphorus, metric
900
Phosphorus, metric tons
3,000
800
Dissolved Reactive
2,500 700
2,000 600
tons
500
1,500 400
1,000 300
200
500
100
0 0
1975 1980 1985 1990 1995 2000 2005 1975 1980 1985 1990 1995 2000 2005
Water Year Water Year
Maumee R. Bioavailable Phosphorus Loading
Maumee River, Bioavailable Phosphorus Loads
Bioavailabe Soluble Phos. Bioavailable Particulate Phos.
2000
Bioavailable Phosphorus
1600
Loads, metric tons
1200
Dissolved
30% bioavailable
bioavailable 800
equals
400 110% of
0 DRP
1975 1980 1985 1990 1995 2000 2005
Water Year
20. Why has the dissolved phosphorus
loading from the Sandusky and Maumee
rivers dropped and then increased so
much?
21. Figure 18. Analysis of Ohio commercial phosphorus fertilizer sales from 1955-2006. Source: Commercial Fertilizer Report,
published by the Association of American Plant Control Officials
23. Soil Testing
For Crop For Environmental
Production Runoff
Environmental
Soil Testing
Agronomic 0-2 inches
Soil Testing
Soil Testing to
0- 8 inch Evaluate
cores Stratification
Soil 2- 8 inches
Plants can generally
Dissolved phosphorus
access nutrients within
concentrations are
the top 8 inches of soil
generally proportional
to soil test P in top 2 inches
24. Critical Phosphorus Soil Test Concentrations for Corn and Soybeans
Ohio State
University
Extension
Fact
Sheet,
2007,
Watson &
Mullen
26. Sandusky DRP
90% of Sandusky Soil tests are in this range.
As soil test phosphorus increases, dissolved phosphorus in runoff increases.
The higher the soil test value, the more phosphorus farmers lose to runoff.
27. Phosphorus Stratification, Comparison between top 2 inches of soil
with 0-8 inch values, 381 fields in the Sandusky Watershed
200
180
Mehlich3-P, 0-2 inches, ppm
160
140
120
100
80
60
40
20
0
0 20 40 60 80 100 120 140 160 180 200
Mehlich3-P, 0-8 inches, ppm
Phosphorus accumulates in the upper layer of soil under no-till and
reduced-till cropping practices.
28. Sandusky Watershed, Comparison of Agronomic and
Environmental Soil Tests
0-2 0-8 inch
100
90 Agronomic
Percentile of 381 fields
80 Soil Test
47 72
70
Environmental Soil Test
60
50 34 52
40
30
22 32
20
10
0
0 25 50 75 100 125 150 175 200
Mehlich 3 Phosphorus Soil Test Resuts, ppm
29. Crops in the Sandusky Watershed: 2006
Cropland Corn Beans Wheat Hay
Acres 758,630 248,430 406,210 97,980 3,670
Percent 32.7% 53.5% 12.9% 0.5%
Very low erosion rates --- 1.9 tons per acre per year for cropland
Most of the soils are classified prime farmland if drained (884,000 acres)
and prime farmland ( 158,000)
Not prime farmland – 117,000 acres
30. Average 453 kg/ha
USGS Midwestern
agricultural watershed
Maumee (582 kg/ha) data base for
Sparrow Model
Sandusky (689 kg/ha) calibration
Sandusky – higher than average suspended sediment export, even
though low erosion rates.
Cause: relatively high clay content of most cropland soils
31. Average = 0.851 kg/ha
Maumee (1.43 kg/ha)
Sandusky (1.68 kg/ha)
High total phosphorus loads in spite of 20 years of control programs to
reduce phosphorus runoff.
32. Average = 25.48 kg/ha
Maumee (25.5 kg/ha)
Sandusky ( 27.21 kg/ha)
High nitrogen export in spite of low proportion of corn in cropland.
33. Value of nutrients lost in 2007 from
Sandusky Watershed
(as measured at Tindal Bridge and using 2008 fertilizer prices)
Nitrate- nitrogen - $8,196,000
Organic nitrogen - $3,744,000
Particulate Phosphorus - $1,795,000
Dissolved Phosphorus - $602,500
Total - $14,337,500 ($17.88 per acre in watershed)
34. What strategy should be used for programs to reduce dissolved
phosphorus loading to Lake Erie from agricultural sources?
High hanging fruit High cost per unit reduction
Medium hanging fruit Medium cost per unit reduction
Low hanging fruit Low cost per unit reduction
35. Should we focus on small
Large watersheds, picking low,
Watershed medium and high hanging
fruit?
Small Watershed
319 Project focus is
often on small
watersheds ….
…supports
assessment?
Should we focus on
low hanging fruit
over large areas?
Objective: Reduce phosphorus export
Stream system from large watersheds to
Lake Erie.
36. What are the low hanging fruits relative to
reducing dissolved phosphorus runoff?
1. Drawdown or no fertilizer applications on soils with agronomic soil
test values above “maintenance range”
2. Soils with environmental soil test values above a “threshold value”
(yet to be determined).
3. Minimize fall and winter broadcast applications of fertilizers.
4. Encourage deep banding and injection of fertilizers.
5. Improve soil tilth (water infiltration and water holding capacity)
6. Continue traditional soil conservation measures.
39. How do you measure nonpoint source pollution?
… the watershed approach for quantifying nonpoint pollution.
Point source input
Stream gaging/monitoring station
watershed
boundary
Assumes 100%
delivery of Total Watershed
pollutant through Export
the streams.
Total
Nonpoint source Point source
loading = watershed - inputs
output
40. The Heidelberg University Tributary Loading Program
Sampling Stations
Station Support
ODNR
Michigan DEQ
Lake Erie CREP
Great Lakes Protection
Fund
EDF/Joyce Foundation
USDA/NRCS
All stations are
associated with
USGS Stream Flow
Stations
41. These observations led to efforts to control agricultural phosphorus loading through
erosion control efforts (no-till and reduced-till) to reduce particulate phosphorus.
42. The Maumee and Sandusky
Rivers make up about 62%
of the land drainage to the 22.4 % of
Western Basin. land area
enters the
connecting
channels
River
Raisin
32.0 % of land area
drains in to the
central and eastern
basins of Lake Erie
42.6 % of land area
enters the western
basin
Maumee
River Sandusky River