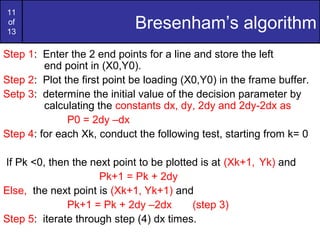
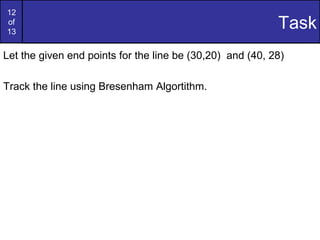
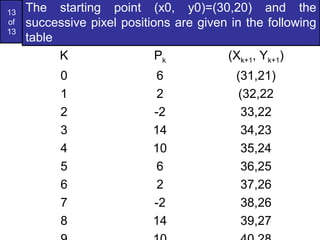
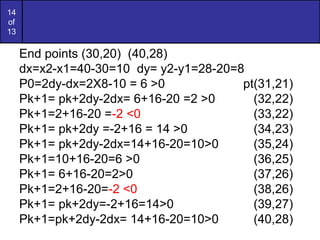
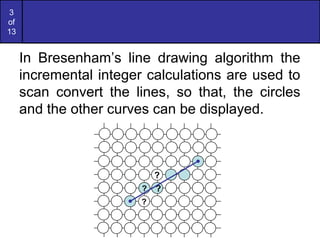
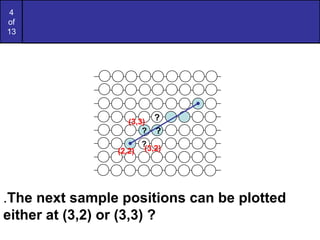
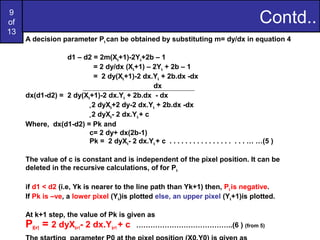
Bresenham's line algorithm uses incremental integer calculations to determine which pixels to turn on when drawing a line on a pixel-based display. It works by calculating a decision parameter Pk at each step k to determine whether to plot the pixel at (Xk+1,Yk) or (Xk+1,Yk+1). For a given line from (30,20) to (40,28), the algorithm is applied by initializing P0=6 and then iteratively calculating Pk+1 at each step k by adding either 2dy or 2dy-2dx depending on whether Pk is positive or negative. This tracks the line from (30,20) to (40,28)
Computer graphics - bresenham line drawing algorithmRuchi Maurya
You know that DDA algorithm is an incremental scan conversion method which performs calculations at each step using the results from the preceding step. Here we are going to discover an accurate and efficient raster line generating algorithm, the Bresenham's line-drawing algorithm.
This algorithm was developed by Jack E. Bresenham in 1962 at IBM.
The function given below handles all lines and implements the complete Bresenham's algorithm.
function line(x0, x1, y0, y1)
boolean steep := abs(y1 - y0) > abs(x1 - x0)
if steep then
swap(x0, y0)
swap(x1, y1)
if x0 > x1 then
swap(x0, x1)
swap(y0, y1)
int deltax := x1 - x0
int deltay := abs(y1 - y0)
real error := 0
real deltaerr := deltay / deltax
int y := y0
if y0 < y1 then ystep := 1 else ystep := -1
for x from x0 to x1
if steep then plot(y,x) else plot(x,y)
error := error + deltaerr
if error ? 0.5
y := y + ystep
error := error - 1.0
The Bresenham algorithm is another incremental scan conversion algorithm. It is useful alternative for the DDA
The big advantage of this algorithm is that it uses only integer calculations
DDA Line Drawing Algorithm
DDA stands for Digital Differential Analyzer
A line drawing algorithm is a graphical algorithm for approximating a line segment on discrete graphical media.
This algorithm is used to draw a line on computer pixels.
what is line
A line in Computer graphics typically refers to line segment, which is a portion of straight line that extends indefinitely in opposite direction.
It is defined by its two end points & the slope intercept equation for a line:
y = mx + b
where, m = Slope of the line
b = the y intercept of a line
Digital Differential Analyzer (DDA) algorithm is the simple line generation algorithm which is explained step by step here.
Step 1 − Get the input of two end points (X0,Y0) and (X1,Y1).
Step 2 − Calculate the difference between two end points.
dx = X1 - X0
dy = Y1 - Y0
Step 3 − Based on the calculated difference in step-2, you need to identify the number of steps to put pixel. If dx > dy, then you need more steps in x coordinate; otherwise in y coordinate.
Step 4 − Calculate the increment in x coordinate and y coordinate.
Step 5 − Put the pixel by successfully incrementing x and y coordinates accordingly and complete the drawing of the line.
Do Not just learn computer graphics an close your computer tab and go away..
APPLY them in real business,
Visit Daroko blog for real IT skills applications,androind, Computer graphics,Networking,Programming,IT jobs Types, IT news and applications,blogging,Builing a website, IT companies and how you can form yours, Technology news and very many More IT related subject.
-simply google:Daroko blog(professionalbloggertricks.com)
• Daroko blog (www.professionalbloggertricks.com)
• Presentation by Daroko blog, to see More tutorials more than this one here, Daroko blog has all tutorials related with IT course, simply visit the site by simply Entering the phrase Daroko blog (www.professionalbloggertricks.com) to search engines such as Google or yahoo!, learn some Blogging, affiliate marketing ,and ways of making Money with the computer graphic Applications(it is useless to learn all these tutorials when you can apply them as a student you know),also learn where you can apply all IT skills in a real Business Environment after learning Graphics another computer realate courses.ly
• Be practically real, not just academic reader
This slide contain description about the line, circle and ellipse drawing algorithm in computer graphics. It also deals with the filled area primitive.
This includes different line drawing algorithms,circle,ellipse generating algorithms, filled area primitives,flood fill ,boundary fill algorithms,raster scan fill approaches.
It gives detailed description about Points, Lines, Attributes of Output Primitives, Line Functions, Line Drawing Algorithms, DDA Line drawing algorithms, Bresenham’s Line Algorithm, Circle Generating Algorthims
Computer graphics lab report with code in cppAlamgir Hossain
This is the lab report for computer graphics in cpp language. Basically this course is only for the computer science and engineering students.
Problem list:
1.Program for the generation of Bresenham Line Drawing.
2. Program for the generation of Digital Differential Analyzer (DDA) Line Drawing.
3. Program for the generation of Midpoint Circle Drawing.
4. Program for the generation of Midpoint Ellipse Drawing.
5. Program for the generation of Translating an object.
6. Program for the generation of Rotating an Object.
7. Program for the generation of scaling an object.
All programs are coaded in cpp language .
Read| The latest issue of The Challenger is here! We are thrilled to announce that our school paper has qualified for the NATIONAL SCHOOLS PRESS CONFERENCE (NSPC) 2024. Thank you for your unwavering support and trust. Dive into the stories that made us stand out!
Operation “Blue Star” is the only event in the history of Independent India where the state went into war with its own people. Even after about 40 years it is not clear if it was culmination of states anger over people of the region, a political game of power or start of dictatorial chapter in the democratic setup.
The people of Punjab felt alienated from main stream due to denial of their just demands during a long democratic struggle since independence. As it happen all over the word, it led to militant struggle with great loss of lives of military, police and civilian personnel. Killing of Indira Gandhi and massacre of innocent Sikhs in Delhi and other India cities was also associated with this movement.
Honest Reviews of Tim Han LMA Course Program.pptxtimhan337
Personal development courses are widely available today, with each one promising life-changing outcomes. Tim Han’s Life Mastery Achievers (LMA) Course has drawn a lot of interest. In addition to offering my frank assessment of Success Insider’s LMA Course, this piece examines the course’s effects via a variety of Tim Han LMA course reviews and Success Insider comments.
Macroeconomics- Movie Location
This will be used as part of your Personal Professional Portfolio once graded.
Objective:
Prepare a presentation or a paper using research, basic comparative analysis, data organization and application of economic information. You will make an informed assessment of an economic climate outside of the United States to accomplish an entertainment industry objective.
The French Revolution, which began in 1789, was a period of radical social and political upheaval in France. It marked the decline of absolute monarchies, the rise of secular and democratic republics, and the eventual rise of Napoleon Bonaparte. This revolutionary period is crucial in understanding the transition from feudalism to modernity in Europe.
For more information, visit-www.vavaclasses.com
2024.06.01 Introducing a competency framework for languag learning materials ...Sandy Millin
http://sandymillin.wordpress.com/iateflwebinar2024
Published classroom materials form the basis of syllabuses, drive teacher professional development, and have a potentially huge influence on learners, teachers and education systems. All teachers also create their own materials, whether a few sentences on a blackboard, a highly-structured fully-realised online course, or anything in between. Despite this, the knowledge and skills needed to create effective language learning materials are rarely part of teacher training, and are mostly learnt by trial and error.
Knowledge and skills frameworks, generally called competency frameworks, for ELT teachers, trainers and managers have existed for a few years now. However, until I created one for my MA dissertation, there wasn’t one drawing together what we need to know and do to be able to effectively produce language learning materials.
This webinar will introduce you to my framework, highlighting the key competencies I identified from my research. It will also show how anybody involved in language teaching (any language, not just English!), teacher training, managing schools or developing language learning materials can benefit from using the framework.
Francesca Gottschalk - How can education support child empowerment.pptxEduSkills OECD
Francesca Gottschalk from the OECD’s Centre for Educational Research and Innovation presents at the Ask an Expert Webinar: How can education support child empowerment?
The Roman Empire A Historical Colossus.pdfkaushalkr1407
The Roman Empire, a vast and enduring power, stands as one of history's most remarkable civilizations, leaving an indelible imprint on the world. It emerged from the Roman Republic, transitioning into an imperial powerhouse under the leadership of Augustus Caesar in 27 BCE. This transformation marked the beginning of an era defined by unprecedented territorial expansion, architectural marvels, and profound cultural influence.
The empire's roots lie in the city of Rome, founded, according to legend, by Romulus in 753 BCE. Over centuries, Rome evolved from a small settlement to a formidable republic, characterized by a complex political system with elected officials and checks on power. However, internal strife, class conflicts, and military ambitions paved the way for the end of the Republic. Julius Caesar’s dictatorship and subsequent assassination in 44 BCE created a power vacuum, leading to a civil war. Octavian, later Augustus, emerged victorious, heralding the Roman Empire’s birth.
Under Augustus, the empire experienced the Pax Romana, a 200-year period of relative peace and stability. Augustus reformed the military, established efficient administrative systems, and initiated grand construction projects. The empire's borders expanded, encompassing territories from Britain to Egypt and from Spain to the Euphrates. Roman legions, renowned for their discipline and engineering prowess, secured and maintained these vast territories, building roads, fortifications, and cities that facilitated control and integration.
The Roman Empire’s society was hierarchical, with a rigid class system. At the top were the patricians, wealthy elites who held significant political power. Below them were the plebeians, free citizens with limited political influence, and the vast numbers of slaves who formed the backbone of the economy. The family unit was central, governed by the paterfamilias, the male head who held absolute authority.
Culturally, the Romans were eclectic, absorbing and adapting elements from the civilizations they encountered, particularly the Greeks. Roman art, literature, and philosophy reflected this synthesis, creating a rich cultural tapestry. Latin, the Roman language, became the lingua franca of the Western world, influencing numerous modern languages.
Roman architecture and engineering achievements were monumental. They perfected the arch, vault, and dome, constructing enduring structures like the Colosseum, Pantheon, and aqueducts. These engineering marvels not only showcased Roman ingenuity but also served practical purposes, from public entertainment to water supply.
Palestine last event orientationfvgnh .pptxRaedMohamed3
An EFL lesson about the current events in Palestine. It is intended to be for intermediate students who wish to increase their listening skills through a short lesson in power point.
2. 2
of
13
The Problem (cont…)
What happens when we try to draw this on a
pixel based display?
How do we choose which pixels to turn on?
3. 3
of
13
In Bresenham’s line drawing algorithm the
incremental integer calculations are used to
scan convert the lines, so that, the circles
and the other curves can be displayed.
?
? ?
?
4. 4
of
13
.The next sample positions can be plotted
either at (3,2) or (3,3) ?
?
? ?
?
(2,2) (3,2)
(3,3)
6. 6
of
13
For lines with positive slope m<1
The pixel positions on line can be identified by
doing sampling at unit x intervals.
The process of sampling begins from the pixel
position (X0,Y0) and proceeds by plotting the
pixels whose ‘Y’ value is nearest to the line path.
If the pixel to be displayed occurs at a position
(Xk, Yk) then the next pixel is either at (Xk+1,Yk) or
(Xk+1,Yk+1) i.e, (3,2) or (3,3)
The ‘Y’ coordinate at the pixel position Xk+1
can be obtained from
Y=m(Xk+1)+b . . . . . . . . . . ……. eq 1
7. 7
of
13
the separation between (Xk+1,Yk) and (Xk+1,Y) is d1 and the
separation between (Xk+1,Y) and (Xk+1, Yk+1) is d2 then
d1 = y – yk and
d2 = (Yk+1) – Y .
(Xk, yk)
(Xk, yk+1) (Xk+1, yk+1)
(Xk+1,yk)
P0 d1
d2
8. 8
of
13
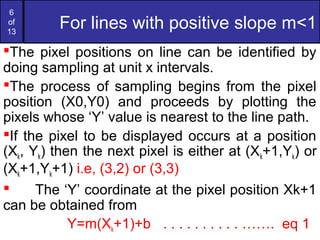
Y=m(Xk+1)+b . . . . . . . ……. eq 1
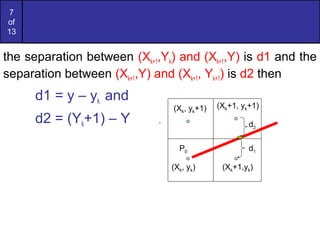
d1=y – yk
d1=m(xk+1)+b – Yk ( from eqn (1) …..( 2)
And d2= (Yk+1) – Y
=(YK+1) – [m(Xk+1)+b]
=(YK+1) – m(Xk+1) – b …….(3)
The difference is given as
d1-d2 =
= m(Xk+1)+b-Yk-[(Yk+1)-m(Xk+1)-b]
=m(Xk+1)+b-Yk-(Yk+1)+m(Xk+1)+b
d1-d2 = 2m(X +1)-2Y +2b – 1 ………(4)
9. 9
of
13
Contd..
A decision parameter Pk can be obtained by substituting m= dy/dx in equation 4
d1 – d2 = 2m(Xk+1)-2Yk+2b – 1
= 2 dy/dx (Xk+1) – 2Yk + 2b – 1
= 2 dy(Xk+1)-2 dx.Yk + 2b.dx -dx
dx
dx(d1-d2) = 2 dy(Xk+1)-2 dx.Yk + 2b.dx - dx
= 2 dyXk+2 dy-2 dx.Yk + 2b.dx -dx
= 2 dyXk- 2 dx.Yk + c
Where, dx(d1-d2) = Pk and
c= 2 dy+ dx(2b-1)
Pk = 2 dyXk- 2 dx.Yk + c . . . . . . . . . . . . . . . . . . . … …(5 )
The value of c is constant and is independent of the pixel position. It can be
deleted in the recursive calculations, of for Pk
if d1 < d2 (i.e, Yk is nearer to the line path than Yk+1) then, Pk is negative.
If Pk is –ve, a lower pixel (Yk)is plotted else, an upper pixel (Yk+1)is plotted.
At k+1 step, the value of Pk is given as
PK+1 = 2 dyXk+1- 2 dx.Yk+1 + c …………………………………..(6 ) (from 5)
10. 10
of
13
(X0, y0)
(X0, y0+1) (X0+1, y0+1)
(X0+1,y0)
P0 d1
d2
y=mx+c is the eq of line
In col 2 the line is passing through x0+1 so the y
value is given by
y=m(x0+1)+c (green dot)
Now we need to find out the values of d1 and d2
d1= y-y0
d2=(y0+1)-y
d1=m(x0+1) – y0 and d2= (y0+1) - m(x0+1)
d1-d2=[mx0+m – y0] - [(y0+1) - mx0-m]
=mx0+m – y0 - y0-1 + mx0+m
= 2mx0+2m –2y0-1
= 2mx0+2m –2mx0-1 (y=mx+c passes thr
(x0, y0) so we can say y0=mx0+c)
d1-d2 = 2mx0+2m –2mx0-1
d1-d2=2m-1 ( m= ∆y / ∆x)
d1-d2 = 2∆y/ ∆x - 1
Col 1 Col 2
∆x(d1-d2) = 2∆y - ∆x∆x(d1-d2) = 2∆y - ∆x
11. 11
of
13
Bresenham’s algorithm
Step 1: Enter the 2 end points for a line and store the left
end point in (X0,Y0).
Step 2: Plot the first point be loading (X0,Y0) in the frame buffer.
Setp 3: determine the initial value of the decision parameter by
calculating the constants dx, dy, 2dy and 2dy-2dx as
P0 = 2dy –dx
Step 4: for each Xk, conduct the following test, starting from k= 0
If Pk <0, then the next point to be plotted is at (Xk+1, Yk) and
Pk+1 = Pk + 2dy
Else, the next point is (Xk+1, Yk+1) and
Pk+1 = Pk + 2dy –2dx (step 3)
Step 5: iterate through step (4) dx times.
12. 12
of
13
Task
Let the given end points for the line be (30,20) and (40, 28)
Track the line using Bresenham Algortithm.
13. 13
of
13
The starting point (x0, y0)=(30,20) and the
successive pixel positions are given in the following
table
K Pk (Xk+1, Yk+1)
0 6 (31,21)
1 2 (32,22
2 -2 33,22
3 14 34,23
4 10 35,24
5 6 36,25
6 2 37,26
7 -2 38,26
8 14 39,27