Download to read offline
![IOSR Journal of Pharmacy and Biological Sciences (IOSR-JPBS)
e-ISSN: 2278-3008, p-ISSN:2319-7676. Volume 6, Issue 5 (May. – Jun. 2013), PP 82-90
www.iosrjournals.org
www.iosrjournals.org 82 | Page
Spatial Laser Induced Fluorescence Imaging (SLIFIMG) Analysis
to Assess Tissue Photosensitizer Uptake
Osama Fekry Ahmed
National Institute for Laser Enhanced Sciences NILES, Cairo University
Abstract: Fluorescence technique involves the optical detection and spectral analysis of light emitted by a
substance undergoing a transition from an excited electronic state to a lower electronic state. The aim of this study
is to assess the -amino levulinic acid (-ALA) uptake. Based on image processing technique, Matlab was used
to analyze the fluorescence images resulted from activation of (-ALA) and follow its uptake along one week.
Analyzing the RGB colours pixel profile from obtained results showed different profiles for malignant tissues,
normal tissues, treated just after PDT and finally at one week post PDT. The treated tissues fluorescence profile
showed changes from closer to malignant tissue profile till been closed to normal one.
Conclusion: The results indicate that ALA phpotosensitizer tissue uptake can be identified using image
analysis and processing for tissue fluorescence images by MATLAB.
I. Introduction
Photodynamic therapy
Photodynamic therapy (PDT) depends on the use of photochemical reactions mediated through the
interaction of photosensitizing substances (photosensitizers), light, and oxygen for the treatment of malignant or
benign diseases [1]. In the first step, the photosensitizer is administered to the patient by one of several routes
(eg, topical, oral, intravenous), and it is allowed to be taken up by the target cells. The second step involves the
activation of the photosensitizer in the presence of oxygen with a specific wavelength of light directed toward
the target tissue [2]. Because the photosensitizer is preferentially absorbed by hyperproliferative tissue and the
light source is directly targeted on the lesional tissue, PDT achieves dual selectivity, minimizing damage to
adjacent healthy structures. Upon absorption of photons of light, the photosensitizer is excited to a short-lived
singlet state followed by a transition to the reactive triplet state. From its triplet state in the presence of oxygen,
reactive free radicals and singlet oxygen species ensue. These, in turn, react with cell membranes, causing direct
damage to the mitochondria, endoplasmic reticulum, and/or plasma membranes [3].
II. Tissues
There exists considerable current interest in the use of optical methods for medical imaging, diagnosis
and therapy [4]. Encouraging results have already been obtained for use of optical techniques for in situ
monitoring of tissue parameters, discrimination of diseased tissue from normal, mammography, and several
therapeutic applications. For most of these applications, in particular for the use of light in therapy, it is
important to be able to predict the spatial distribution of light in the target tissue [5].
III. Fluorescence
Emission of fluorescence is one of the possible processes that can occur when light is absorbed in
molecules. Following the absorption of a photon and the subsequent excitation of the absorbing molecule, the
molecule relaxes down to the lowest energy level within the S1 state , by a non-radiative process (Figure 1).
From here, it can release its extra energy by emitting a photon as it relaxes down to the lower S0 ener gy
state. This emission is called fluorescence. Due to the energy loss in the non-radiative part of this process,
the fluorescence photon will carry a lower energy and, thereby, have a longer wavelength than that of the
absorbed photon. The relaxation from the higher level can end in any level in the lower S0 energy band,
leading to a total fluorescence emission composed of several wavelengths. This explains why
fluorescence is characterized by a wide wavelength distribution and not by a sharp peak [6]. The shorter the
excitation wavelength, i.e. the more towards the ultraviolet region the fluorescence excitation occurs, the more
of the visible spectrum can be contained in the resulting fluorescence signal [7]](https://image.slidesharecdn.com/l0658290-150501065314-conversion-gate01/85/Spatial-Laser-Induced-Fluorescence-Imaging-SLIFIMG-Analysis-to-Assess-Tissue-Photosensitizer-Uptake-1-320.jpg)
![Spatial Laser Induced Fluorescence Imaging (SLIFIMG) Analysis To Assess Tissue Photosensitizer
www.iosrjournals.org 83 | Page
Fig (1) showed fluorescence excitation diagram
Fluorescence imaging
Fluorescence imaging is potentially a very powerful tool. However, the traditional process of labeling
cells and biological tissue is invasive, tending to damage them or alter their normal function and so fluorescence
techniques have so far been limited in their application[8]. This technique offers the prospect of a non- invasive
clinical imaging method if one can use fluorescence to contrast different types or states of tissue, e.g. healthy,
diseased and tissue activities before and after treatment especially during photodynamic therapy in which we
need to monitor the tissue uptake of the applied photosensitizer, provides a further dimension that help in
enhancement of PDT process [9]
Image Profile:
A line profile plots the variations of intensity along a line. It returns the grayscale values of the pixels
along a line and graphs it. Line profiles are helpful for examining boundaries between components, quantifying
the magnitude of intensity variations, and detecting the presence of repetitive patterns [10]
IV. Materials and Methods
Experimental Setup:
There are various types of methods and instruments used for in vivo fluorescence imaging essentially
have the same basic components, except for a few differences [11].
The experimental setup basically consists of either a broadband or monochromatic excitation light source, a
dispersing element or filter to spectrally select the excitation band, a delivery and collection conduit for the
delivery of excitation light to, and the collection of the emitted light from the imaging surface of the biological
medium, a dispersing element or filter to spectrally select the emitted light, and a multi- or single-channel
detector, which measures the spatial and/or spectral distribution of the intensity of the emitted light. The
detection system consists of Charge Coupled Device CCD camera, the filters were chosen based on the spectral
characteristics of tissue and the used photosensitizer [12]
-amino levulinic acid (-ALA), which activated at 635 nm and excited at 375-440 nm. (-ALA) Fluorescence
analyses were performed by exciting the sample with 405-nm light and monitoring the resulting fluorescence
with a computer display over the spectrum of 635 nm. The image is transmitted through a spatially coherent
optical fiber bundle and is spectrally filtered with a 400-nm long-pass filter prior to detection [13]. A schematic
of the basic components of such an instrument is shown in Figure (2)
Fig (2) A schematic of the basic components of fluorescence imaging setup
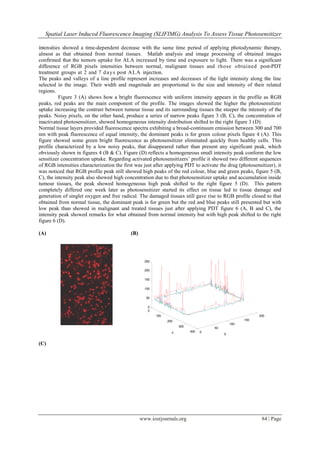
V . Results:
In vivo cellular uptake showed that there was significantly increased uptake of -amino levulinic acid
(-ALA) after p h o t o d y n a m i c t h e r a p y irradiation. In vivo bio-distribution of aminolevulonic acid
ALA in tumor-bearing rats’ thigh tissues showed increased the uptake of ALA Conversely, red fluorescence](https://image.slidesharecdn.com/l0658290-150501065314-conversion-gate01/85/Spatial-Laser-Induced-Fluorescence-Imaging-SLIFIMG-Analysis-to-Assess-Tissue-Photosensitizer-Uptake-2-320.jpg)


![Spatial Laser Induced Fluorescence Imaging (SLIFIMG) Analysis To Assess Tissue Photosensitizer
www.iosrjournals.org 89 | Page
VI. Discussion:
One of the challenges imposed upon in vivo fluorescence imaging is tissue turbidity, or the influence of
absorption and scattering on the fluorescence signal. The present work tried to use the PDT effect to study the
uptake of photosensitizer as spatial fluorescence signals, in accordance of this approach Weber JR, et al., 2011
proved that using spatial tissue imaging technique could be useful to study the characterizing spatially and
spectrally varying tissue optical properties [14]. Also Sheng C, et al., 2004 demonstrated that the fluorescence
probe tool they were studied for quantifying PS levels and tissue damage are necessary for the understanding of
PDT effect and therapeutic ratio in experimental in vivo tumor research [15]. Thomas J. Farrell, et al., in 1998
mentioned that there was a relationship between the decreasing fluorescence signal and the increasing depth of
tissue photodynamic damage during treatment and by analyzing spatially resolved fluorescence measured at the
tissue surface in terms of an equivalent virtual point or planar source of fluorescence within the tissue [16].
The uptake and retention of i.v. administered photosensitizer by tumor tissue is one of several fundamental
determinants of the clinical effectiveness of PDT as mentioned by Weersink, R. A., et al., 1997, Chen, Q., et
al., 1996, Love, W. G., et al., 1996 and Windahl, T., et al., 1993 which comply with our obtained results that
study of PS tissue uptake reflects many aspects that facilitate the understanding and how we can optimally
benefit from this useful treatment modality [17-20]. Using Matlab to study and analyze tissue auto fluorescence
was applied by Kamath SD and Mahato KK 2007 the demonstrated that Matlab is a good tool for the spectral
analysis and classification for discrimination of autofluorescence spectra of pathologically certified normal,
premalignant, and malignant oral tissues [21].
Korbelik, M. 1993, stated that the most sensitive means of monitoring photosensitizer photodegradation is
fluorescence detection and it is therefore important as far as possible to study photodegradation of
photosensitizer in tumour tissues under treatment with PDT compared to normal tissues so that a cleaner
correlation between photodegradation (fluorescence decreasing) and photodamage may be made [22]. In
addition Ochsner, M. 1997 mentioned that the understanding of the pattern of the photosensitizer fluorescence
– photobleaching – is important for the development of monitoring photodynamic therapy efficacy [23]. Pogue,
B.W. and Burke, G. 1998 proved that the spatial fluorescence measurements can provide information about PS
concentration in different tumors and in different areas within a tumor [24]. In agreement with our present study
Jain RK. 2001 observed that the variation of PS concentration at different areas of tumor can be explained by
the variations in these PS transport processes, e.g., different vasculature architecture, capillary permeability, and
tumor interstitial diffusivity [25]. Consistent with the present thesis obtained results and the imaging system
used to follow up methylene blue tumour tissues uptake and photodegradation with fluorescence imaging,
SEYED MOHAMED ALI and MALINI OLIVO 2002, studied the biodistribution and subcellular
localization of hypercin by using spectrofluorimetry and confocal laser scanning microscopy and determined
cellular uptake and localizing of hypercin HY [26]. Agreed with what concluded of David I et al., 1999 that
they study the effect of interstitial photodynamic therapy (PDT) in normal lung parenchyma to assess its
potential for treating localized, peripheral lung tumors on Wistar rats using the photosensitizer [27]. Drug
distribution was measured by fluorescence microscopy on tissue sections. Fluorescence was detected in the
range 630 to 680 nm using a combination of bandpass and longpass filters. The charge-coupled device (CCD)
sensor was used for imaging.Their results showed that the drug was initially distributed throughout the lung, but
was later predominantly in the vasculature, bronchi, and macrophages and its fluorescent decreased by the
uptake of the photosensitizer [27]. Peng Q, et al., 1995 reported that using meso-tetrahydroxyphenyl chlorine
in PDT for in normal and tumor tissues of mice bearing mammary carcinoma. The concentration of mTHPC in
lung 1 day after injection being five times greater than after 3 days, the size of PDT lesions made at these two
times using the same light doses was virtually the same [28]. STEFANAKI et al., 2003 concluded that in their
study of treating Condyloma with PDT using ALA as photosensitizer to detect the uptake and distribution of
ALA which were varied from 6 to 11 hr to detect the maximum accumulation and starting the PDT application
[29]. In the present study tissue content of MB and its distribution could be used to determine the optimum
concentration of MB and the optimum time to activate MB. Xiaoyuan Chen, et al., 2004 in their study for
Near-Infrared Fluorescence Imaging of Integrin αvβ3 in Brain tumor Xenografts conform that Direct image of
dissected tissues and organs revealed very good tumor-to-nontumor tissue ratios. They used a very sensitive,
cryogenically cooled CCD camera allows for acquiring a fluorescence image which showed the contrast of
fluorescence intensities of the tumor (T) to those of normal tissue (N). This conform what obtained from the
present study [30].
VII. Conclusion:
Tissue ALA uptake monitoring considered an important factor that could influence the efficacy of
PDT, which could be identified using image processing and analysis for ALA phpotosensitizer tissue
fluorescence images by MATLAB.](https://image.slidesharecdn.com/l0658290-150501065314-conversion-gate01/85/Spatial-Laser-Induced-Fluorescence-Imaging-SLIFIMG-Analysis-to-Assess-Tissue-Photosensitizer-Uptake-8-320.jpg)
![Spatial Laser Induced Fluorescence Imaging (SLIFIMG) Analysis To Assess Tissue Photosensitizer
www.iosrjournals.org 90 | Page
Acknowledgments:
The author thanks National Institute of Laser, Cairo University for their help and support especially Dr.
Ashraf El-Dakroury and Dr. Hesham Imam for improvements to the imaging system. The author also
acknowledges Dr. Hosam El-Din Mostafa for his help with the animal studies and Prof. Dr. Salah H Naby for
his help and support with MAT Lab.
REFERENCES:
[1]. RonR Allison, Gordon H Downie, RosaCuenca, Xin-Hua Hu, Carter JH Childs, ClaudioH Sibata, ―Photosensitizers in clinical PDT‖
Photodiagnosis and Photodynamic Therapy (2004) 1, 27—42.
[2]. Ortner ME, Caca K, Berr F, Liebetruth J, Mansmann U, Hus- ter D, Voderholzer W, Schachschal G, Mössner J, Lochs H.
Successful photodynamic therapy for nonresectable cholangio- carcinoma: a randomized prospective study. Gastroenterology 2003;
125: 1355-1363
[3]. Giuliano EA, Ota J, Tucker SA. Photodynamic therapy: ba- sic principles and potential uses for the veterinary ophthal- mologist.
Vet Ophthalmol 2007; 10: 337-343.
[4]. Gavryushin V, Vaitkus J, Vaitkuviene A. Methodology of medical d i a g n o s t i c s o f human tissue b y fluorescence.
Lithuania J Physics 2000; 40: No. 1–4.
[5]. Alfano RR, Pradhan A, Tang GC, Wahl SJ. Optical spectroscopic diagnosis o f cancer a n d normal b r e a s t tissues.
Optical Soc Am B 1989; 6: 1015–23.
[6]. R A, Kollner T, Dietrich A, Strauss W, Schneckenburger H. Fluorescence formation during photodynamic therapy in the
nucleus of cells incubated with cationicand anionic water-soluble photosensitizers. J Photochem Photobiol
B 1992;12:403–12.
[7]. Suzuki T, Numata T, Shibuya M. Intraoperative photodynamic detection of normal
[8]. parathyroid glands using 5- aminolevulinic acid. Laryngoscope. 2011
[9]. Jul;121(7):1462-6. doi: 10.1002/lary.21857. Epub 2011 Jun 6.
[10]. Wagnieres GA, Star WM, Wilson BC. In vivo fluo- rescence spectroscopy and imaging for oncological appli- cations. J
Photochem Photobiol 1998; 68: 630-2.
[11]. Thomas J. Farrell, Robert P. Hawkes, Michael S. Patterson, and Brian C. Wilson ―Modeling of Photosensitizer Fluorescence
Emission and Photobleaching for Photodynamic Therapy Dosimetry‖ Applied Optics, (1998) Vol. 37, Issue 31, pp. 7168-7183
[12]. Zhang G.. Demos S. G., and Alfano K.R.. ‖Far-red and NIR spectral wing emission from tissues under 532-nm and 632-nm photo-
excitation‖, Lasers in the Life Sciences, 9. 1-16 (1999)
[13]. M. Andreasson and O. Sandström, The design and implementation of a compact fluoresensor for medical diagnostics, Master's
thesis, Lund Institute of Technology, Lund, Sweden (1998).
[14]. S.G. Demos, M. Staggs, R. Gandour-Edwards, R. Ramsamooj, R. de Vere White ―Tissue Imaging for Cancer Detection Using
Autofluorescence‖ Society of Photo-Optical Instrumentation Engineers 47th Annual Meeting, Seattle, WA, July 6-1 1, 2002.
http://www.doc.gov/bridge
[15]. A. Ciburis, D. Gadonas, R. Gadonas, J. Didziapetriene*, I. Gudinaviciene, G. Grazeliene D. Kaskelyte, A. Piskarskas, K.
Skauminas, V. Smilgevicius, A. Sukackaite,‖5-Aminolevulinic acid INDUCED protoporphyrin IX fluorescence for detection of brain
tumour cells in vivo‖ Experimental Oncology 25, 51-54, 2003 (March)51
[16]. Weber JR, Cuccia DJ, Johnson WR, Bearman GH, Durkin AJ, Hsu M, Lin A, Binder DK, Wilson D, Tromberg BJ. Multispectral
imaging of tissue absorption and scattering using spatial frequency domain imaging and a computed-tomography imaging
spectrometer. J Biomed Opt. 2011 Jan-Feb;16(1):011015.
[17]. Sheng C, Pogue BW, Wang E, Hutchins JE, Hoopes PJ. Assessment of photosensitizer dosimetry and tissue damage assay for
photodynamic therapy in advanced-stage tumors. Photochem Photobiol. 2004 Jun;79(6):520-5.
[18]. Farrell TJ, Hawkes RP, Patterson MS, Wilson BC. ―Modeling of photosensitizer fluorescence emission and photobleaching for
photodynamic therapy dosimetry‖ Applied Optics. 1998 Nov 1;37(31):7168-83.
[19]. Weersink, R. A., Hayward, J. E., Diamond, K. R., and Patterson, M. S. Accuracy of noninvasive in vivo measurements of
photosensitizer uptake based on diffusion model of reflectance spectroscopy. Photochem. Photobiol., 66: 326–335, 1997.
[20]. Chen, Q., Chopp, M., Madigan, L., Dereski, M. O., and Hetzel, F. W. Damage threshold of normal rat brain in photodynamic
therapy. Photochem. Photobiol., 64: 163–167, 1996.
[21]. Love, W. G., Duk, S., Biolo, R., Jori, G., and Taylor, P. W. Liposome-mediated delivery of photosensitizers: localization of zinc
(II)-phthalocyanine within implanted tumors after intravenous administration. Photochem. Photobiol., 63: 656–661, 1996.
[22]. Windahl, T., Peng, Q., Moan, J., Hellsten, S., Axelsson, B., and Lofgren, L. Uptake and distribution of intravenously or
intravesically administered photosensitizers in the rat. Cancer Lett., 75: 65–70, 1993.
[23]. Kamath SD, Mahato KK ―Optical pathology using oral tissue fluorescence spectra: classification by principal component analysis
and k-means nearest neighbor analysis‖ J Biomed Opt. 2007 Jan-Feb;12(1)
[24]. Korbelik, M. (1993) Distribution of disufonated and tetrasulfonated aluminum phthalocyanine between malignant and host cell
populations of a murine fibrosarcoma. J. Photochem. Photobiol. B: Biol. 20, 173–181.
[25]. M. Ochsner, Photophysical and photobiological processes in the photodynamic therapy of tumours, J. Photochem. Photobiol. B 39,
1-18 (1997).
[26]. Pogue and Burke, Applied Optics, 37, 7429-7436 (1998).
[27]. Jain, R. K. & Carmeliet, P. F. Vessels of death or life. Sci.Am. 285, 38–45 (2001)
[28]. SEYED MOHAMED ALI and MALINI OLIVO Bio-distribution and subcellular localization of Hypericin and its role in PDT
induced apoptosis in cancer cells INTERNATIONAL JOURNAL OF ONCOLOGY 21: 531-540, 2002
[29]. David I. Fielding, Giovanni A. Buonaccorsi, Alexander J. MacRobert, Andrew Hanby, Martin R. Hetzel and Stephen G. Bown M.
Fine-Needle Interstitial Photodynamic Therapy of the Lung Parenchyma: Photosensitizer Distribution and Morphologic Effects of
Treatment J Chest (1999);115;502-510
[30]. Q. Peng, T. Warloe, J. Moan, H. Heyerdahl, H.B. Steen, J.M. Nesland and K.-E. Giercksky, Distribution of 5-aminolevulinic acid-
induced porphyrins in noduloulcerative basal cell carcinoma, Photochem. Photobiol. 62, 906-913 (1995).
[31]. I .M. STEFANAKI, S.GEORGIOU, G.C.THEMELIS, E.M.VAZGIOURAKI AND A.D.TOSCA In vivo fluorescence kinetics and
photodynamic therapy in condylomata acuminate British Journal of Dermatology 2003; 149: 972–976.
[32]. Xiaoyuan Chen, Peter S. Conti, and Rex A. Moats In vivo Near-Infrared Fluorescence Imaging of Integrin œvB3 in Brain](https://image.slidesharecdn.com/l0658290-150501065314-conversion-gate01/85/Spatial-Laser-Induced-Fluorescence-Imaging-SLIFIMG-Analysis-to-Assess-Tissue-Photosensitizer-Uptake-9-320.jpg)

This study investigates the uptake of the photosensitizer delta-amino levulinic acid (ALA) using spatial laser induced fluorescence imaging (SLIFIMG) in photodynamic therapy (PDT). The results reveal significant variations in fluorescence intensity profiles of malignant and normal tissues over time post-PDT, indicating the effectiveness of ALA in targeting tumor tissues. The data suggests that image processing techniques can be effectively employed to monitor ALA uptake, enhancing the understanding of PDT efficacy.