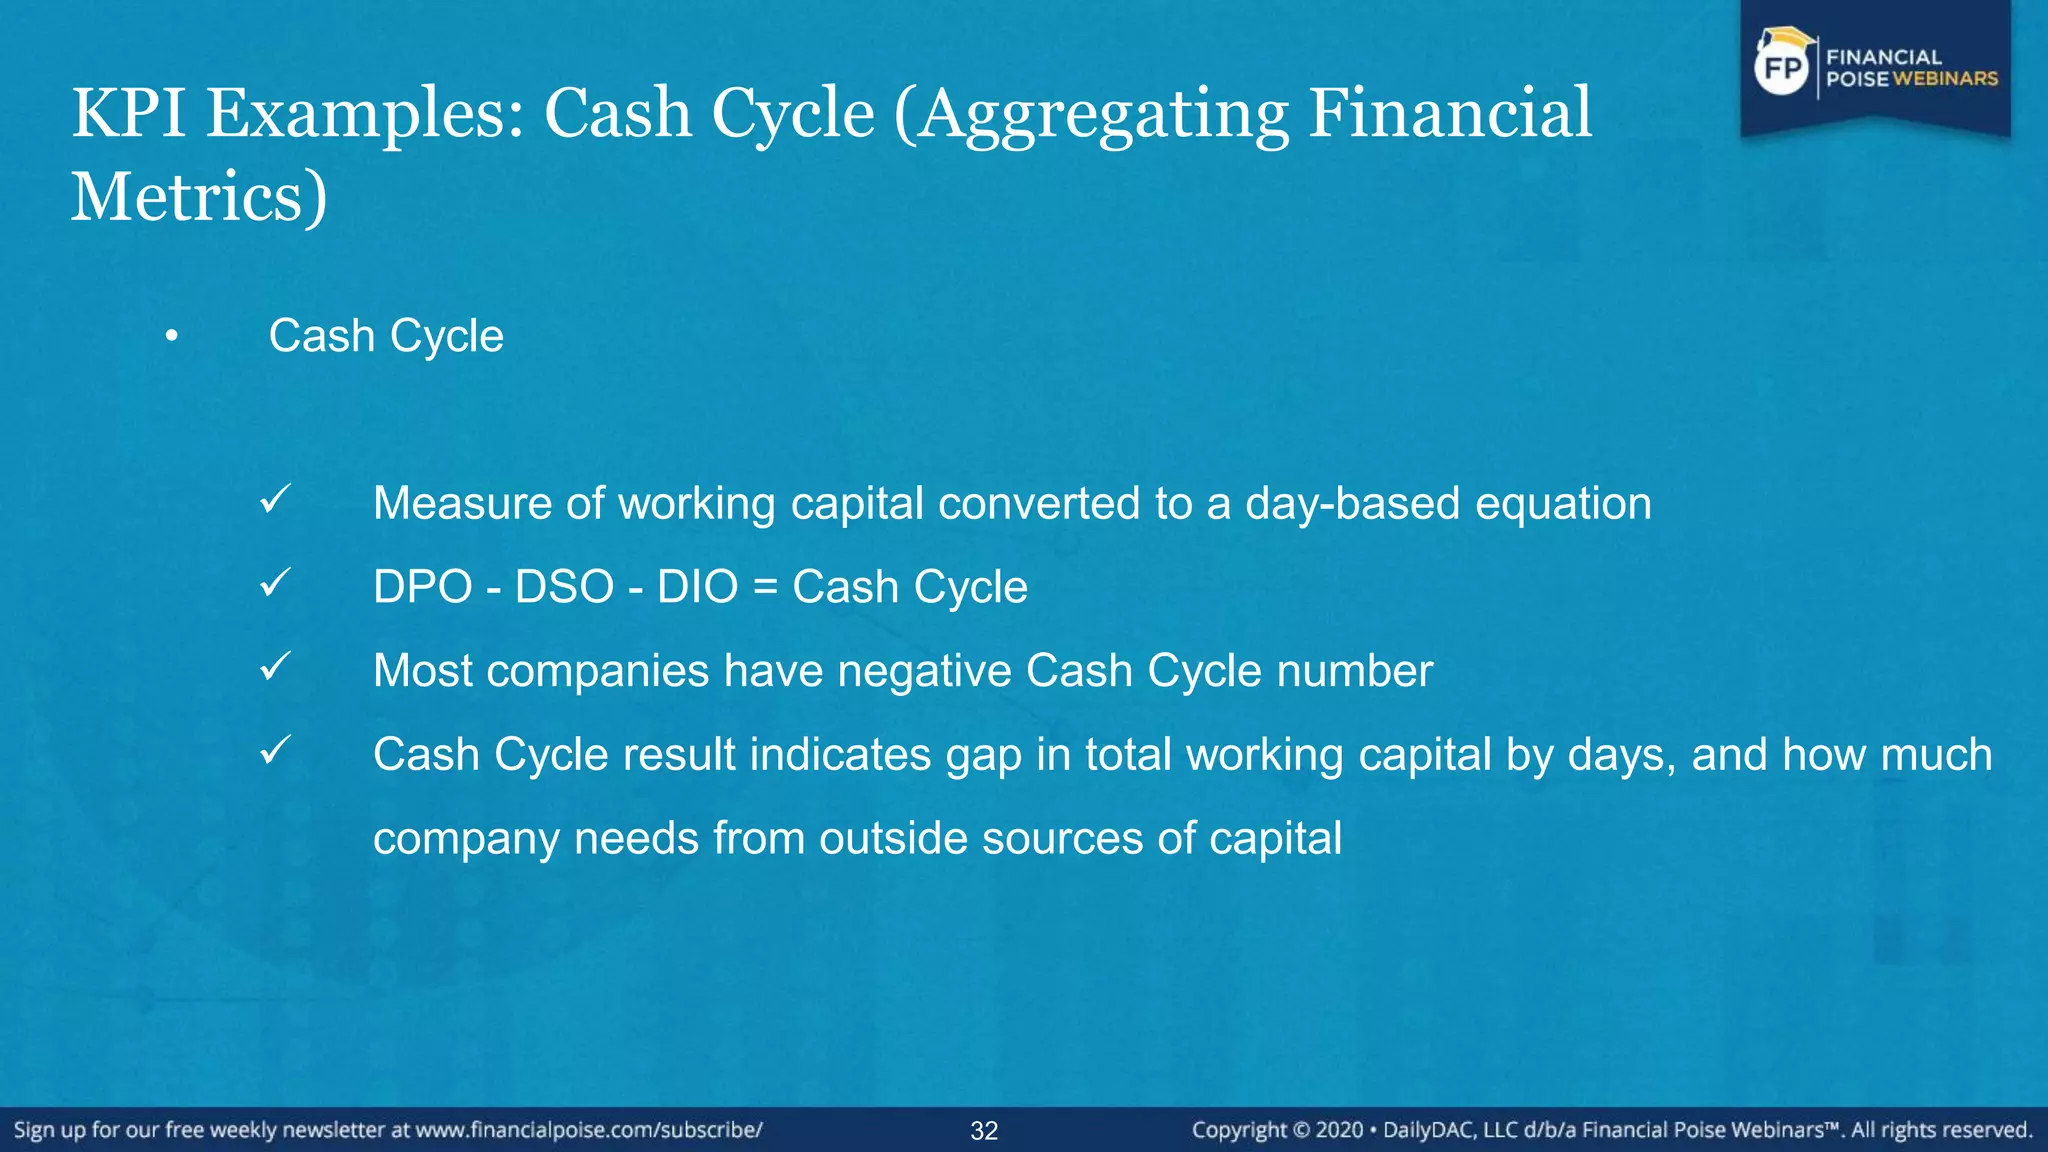
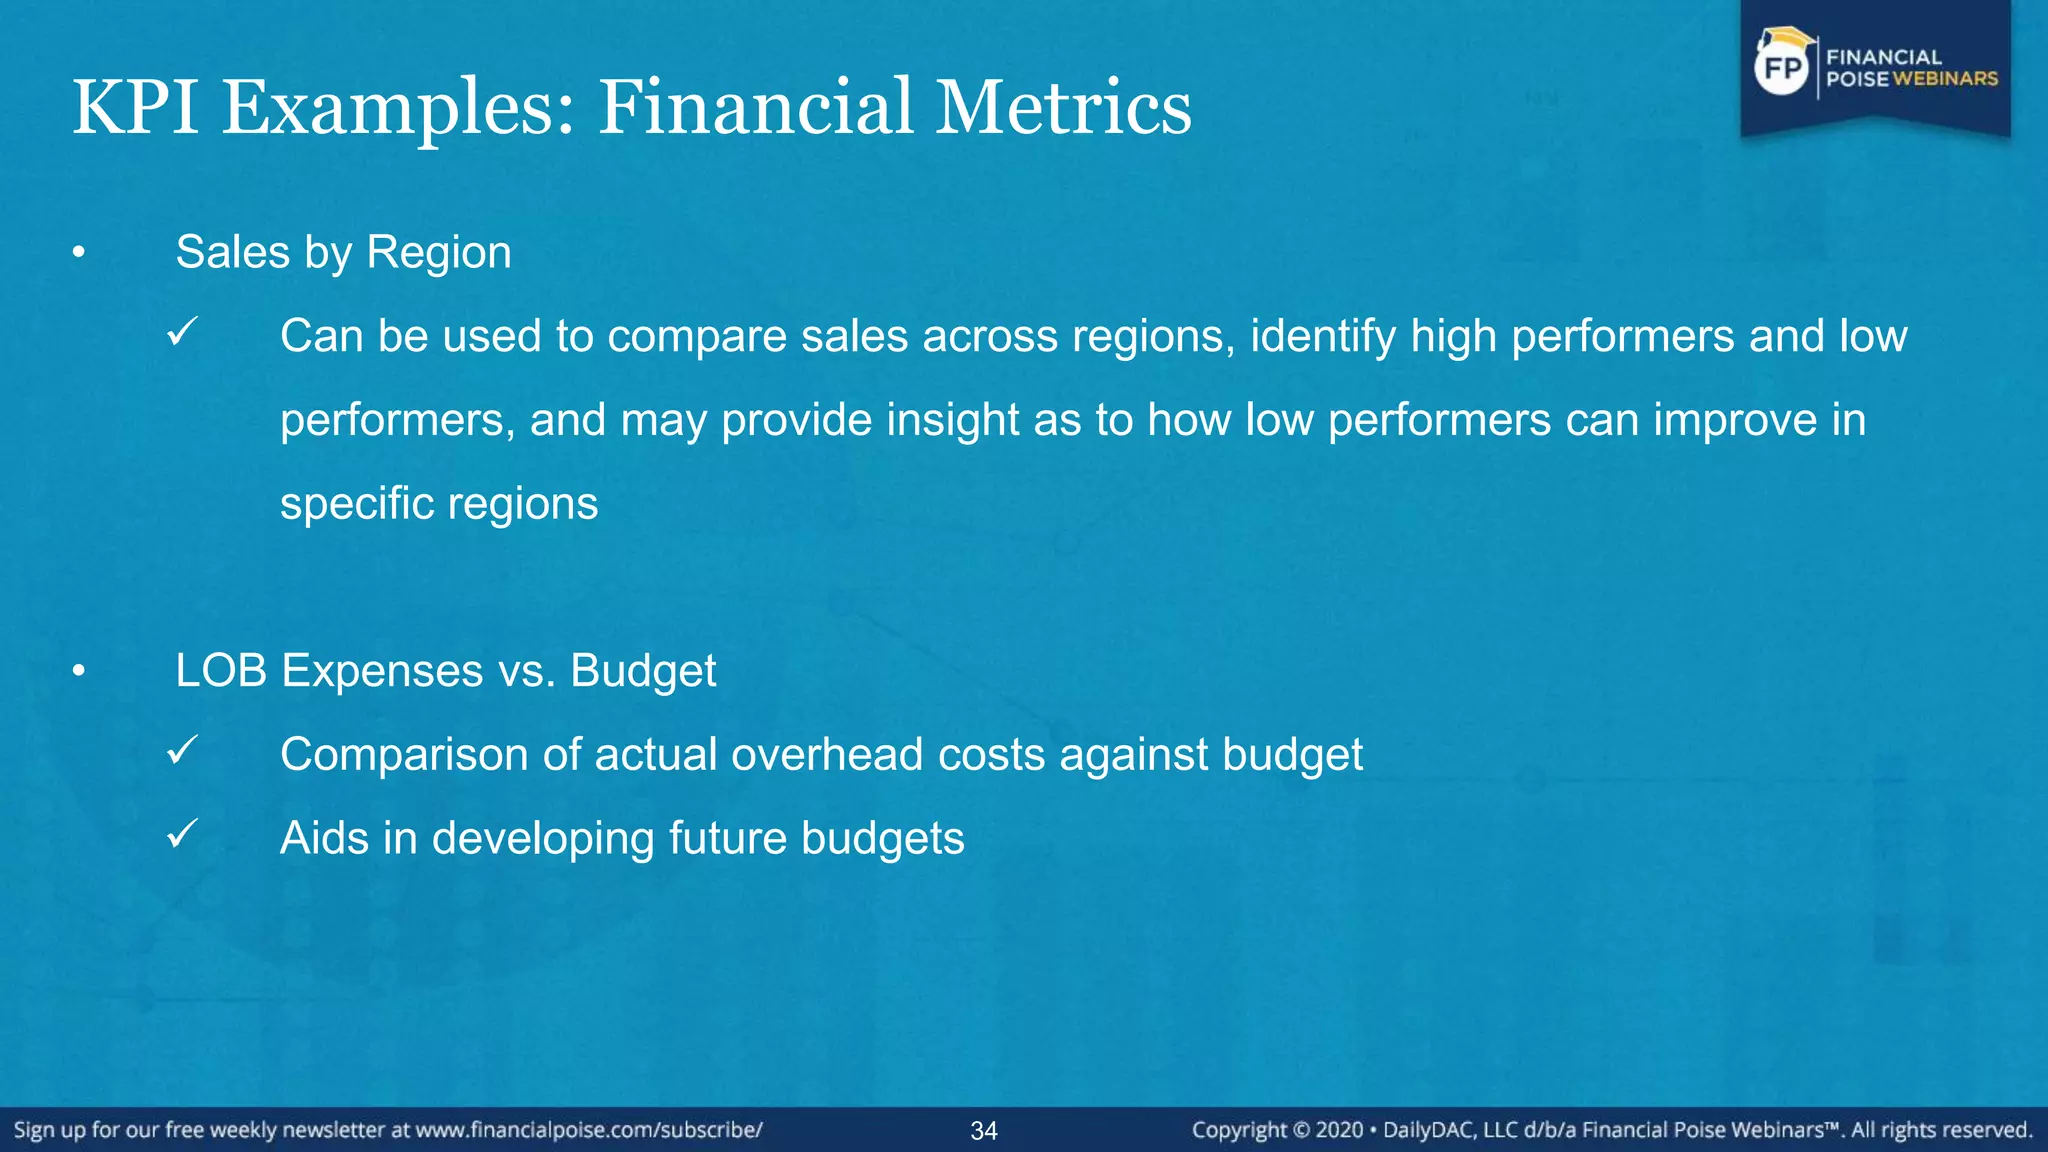
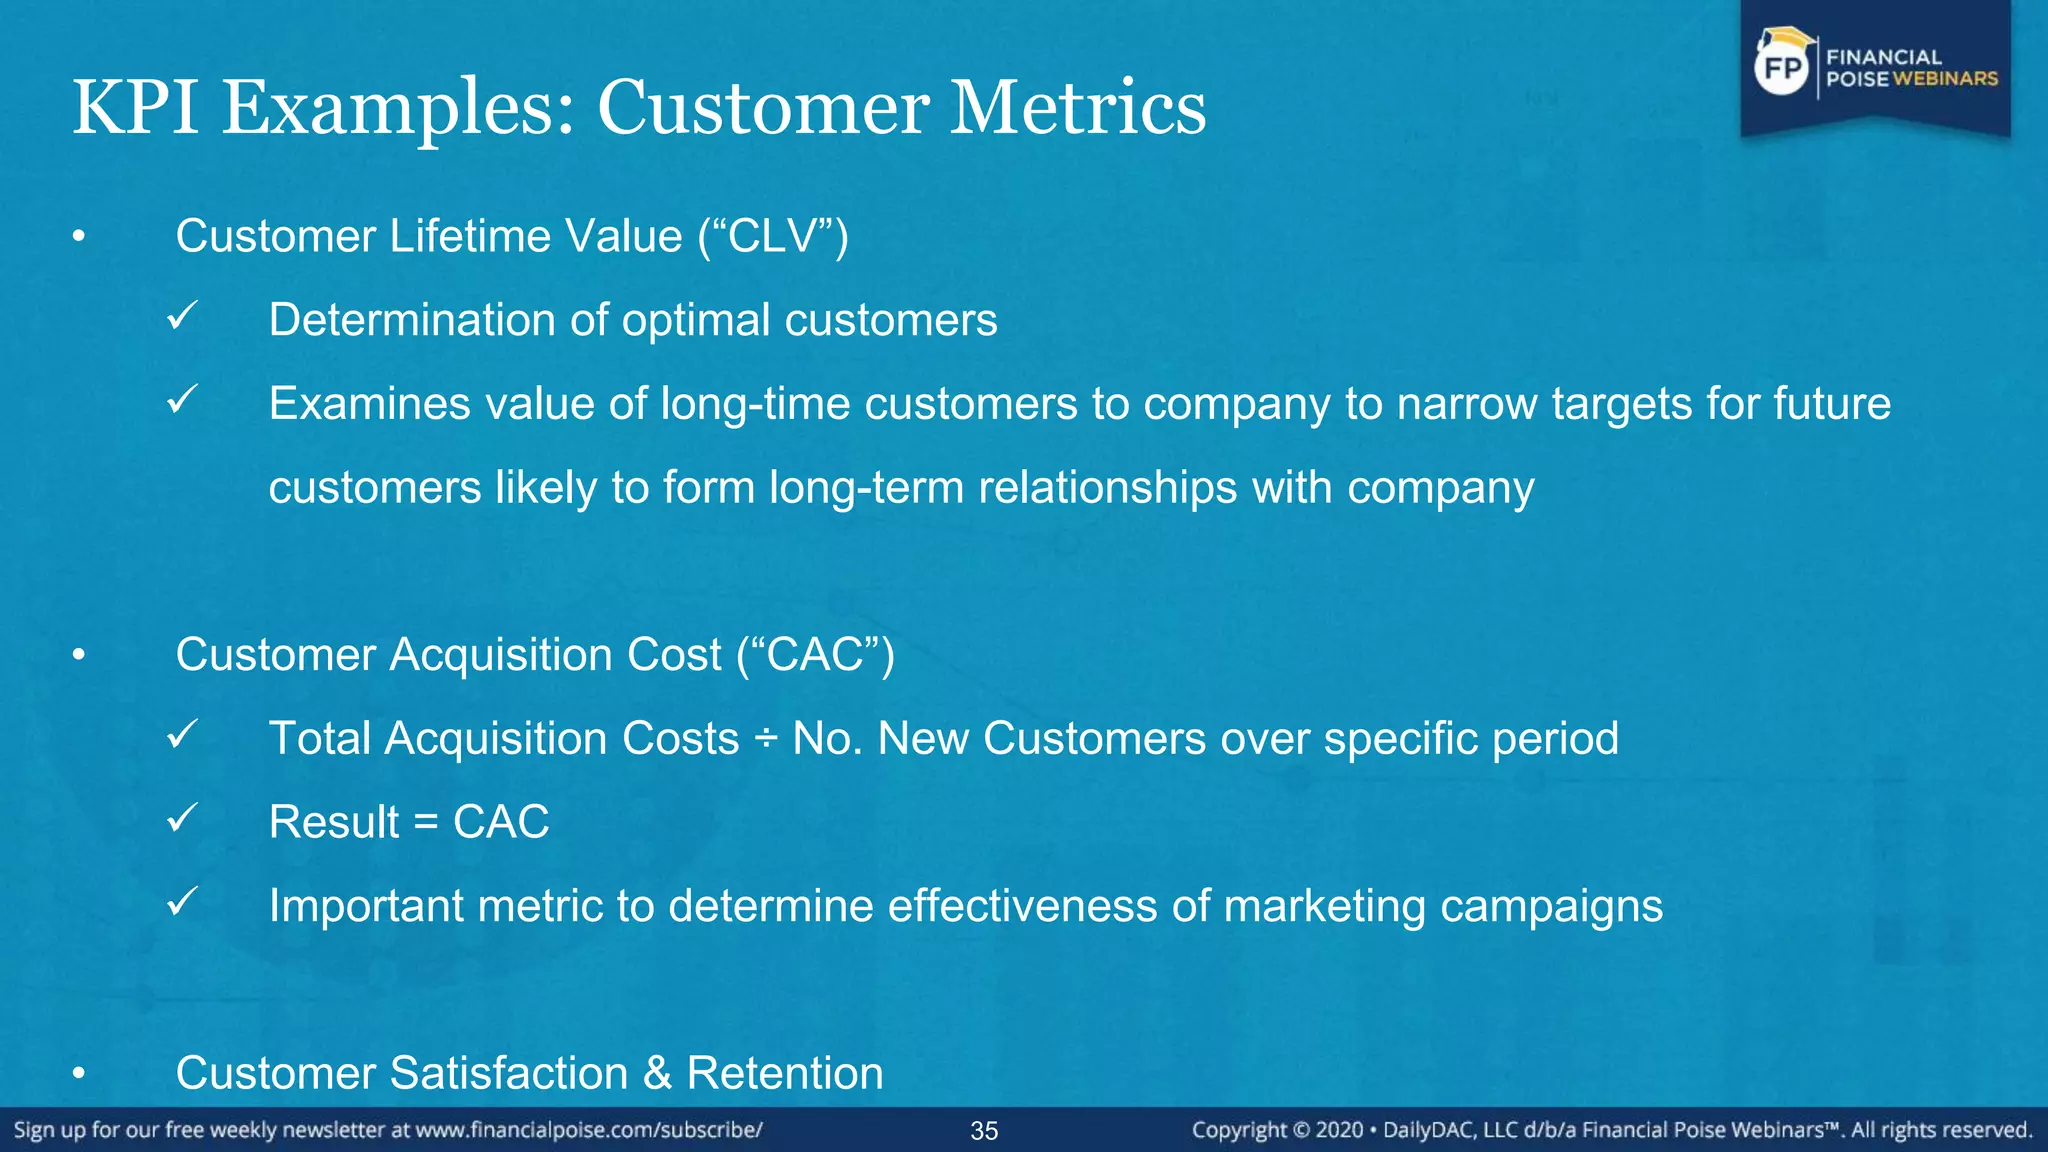
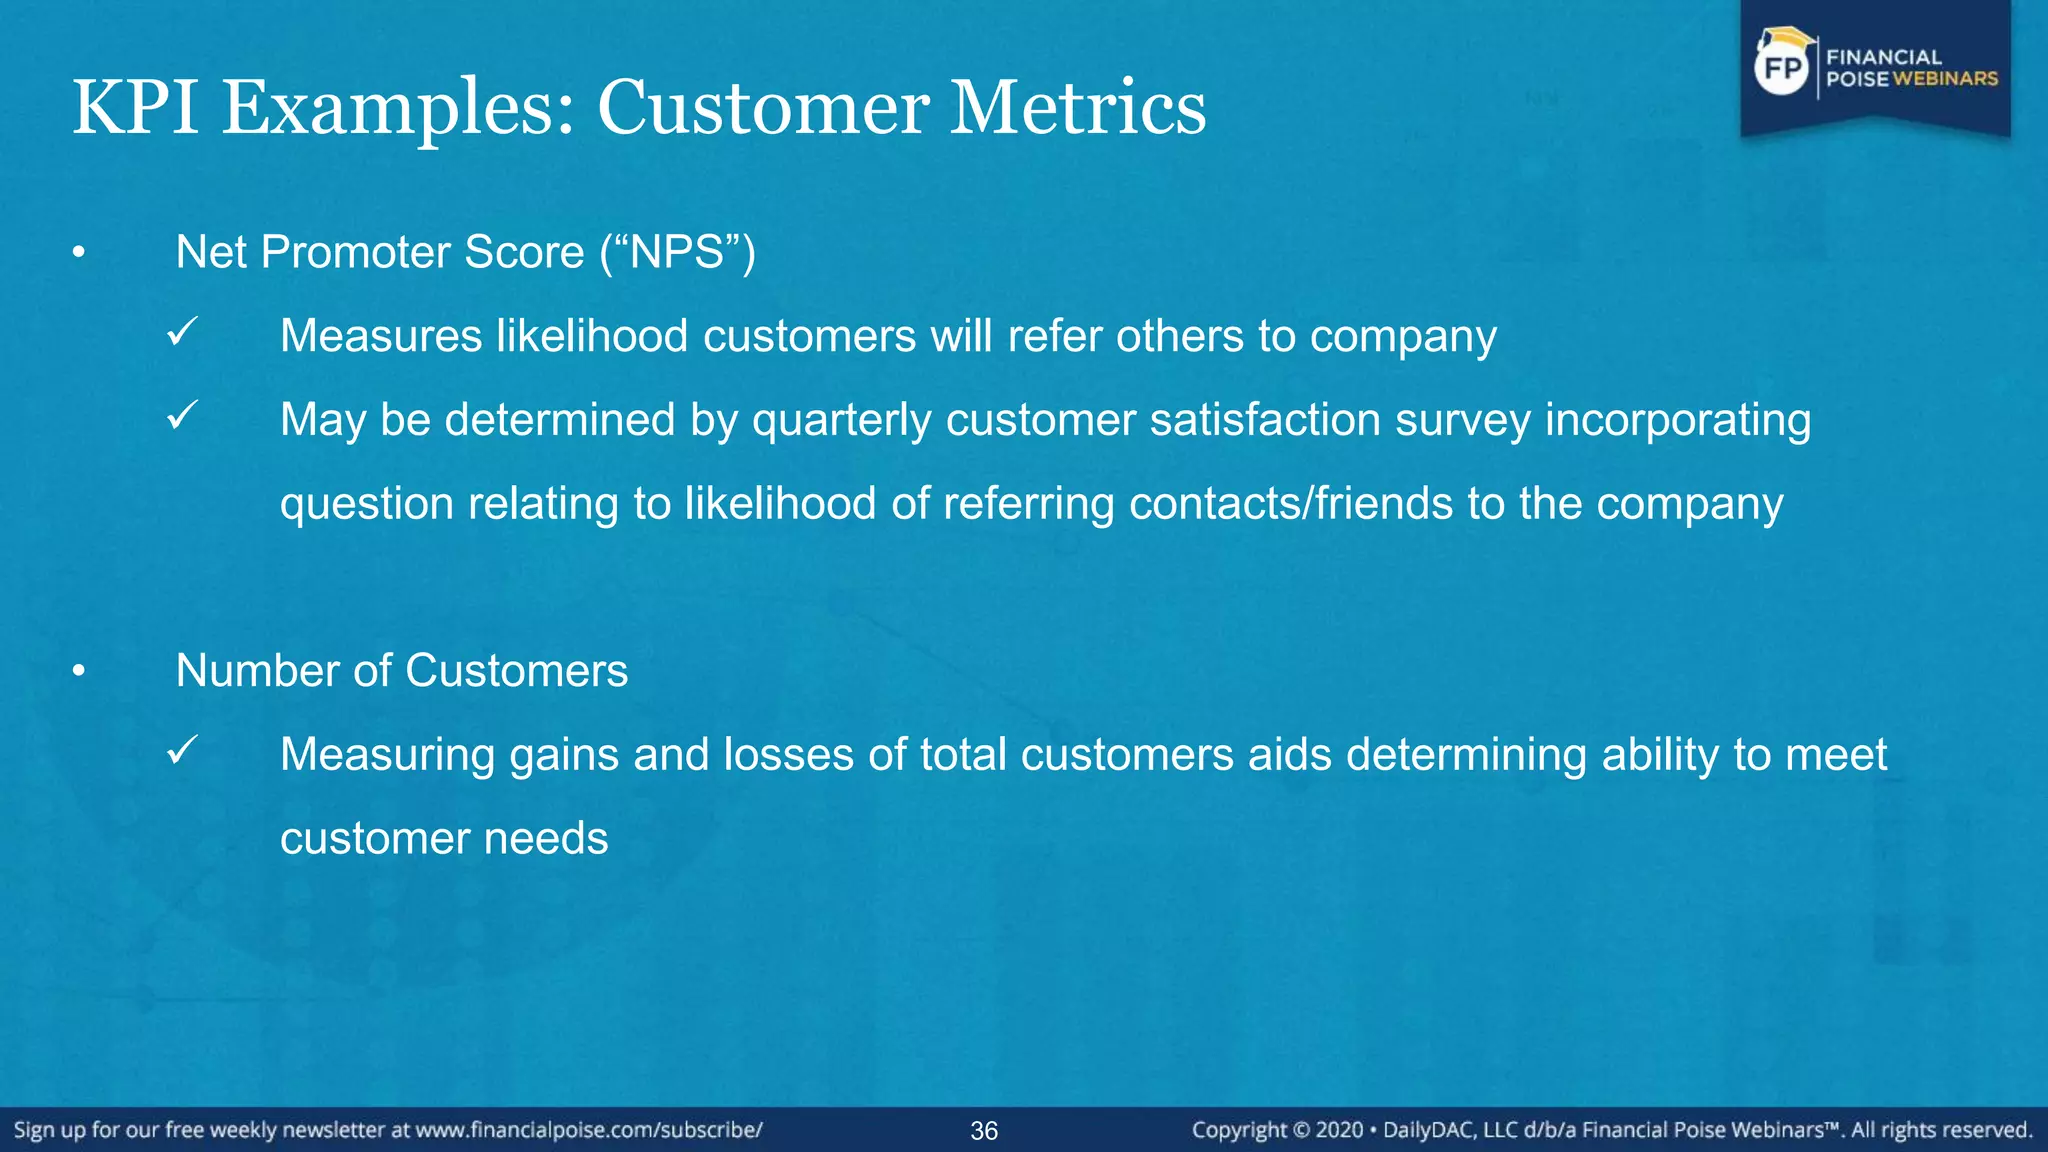
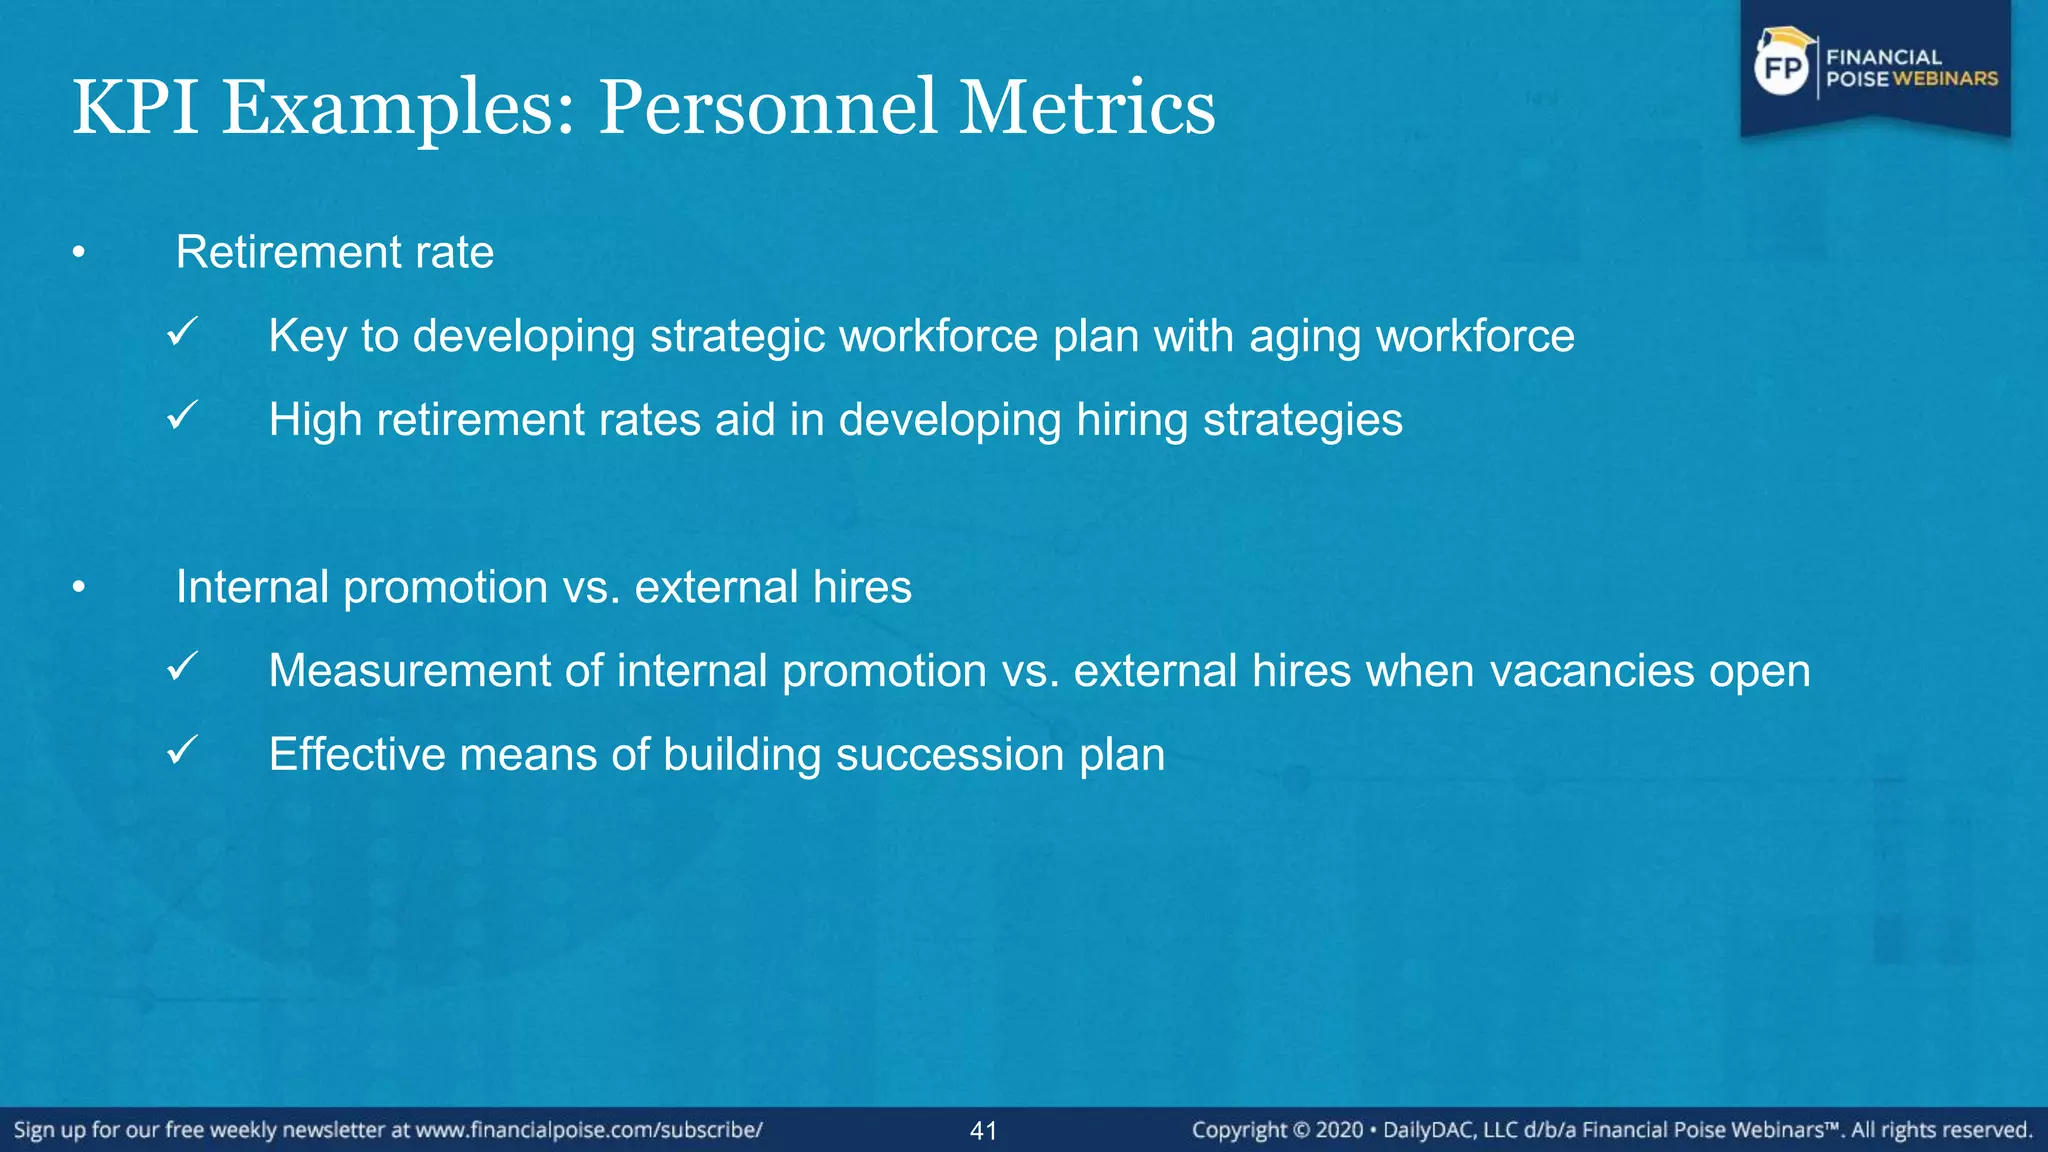
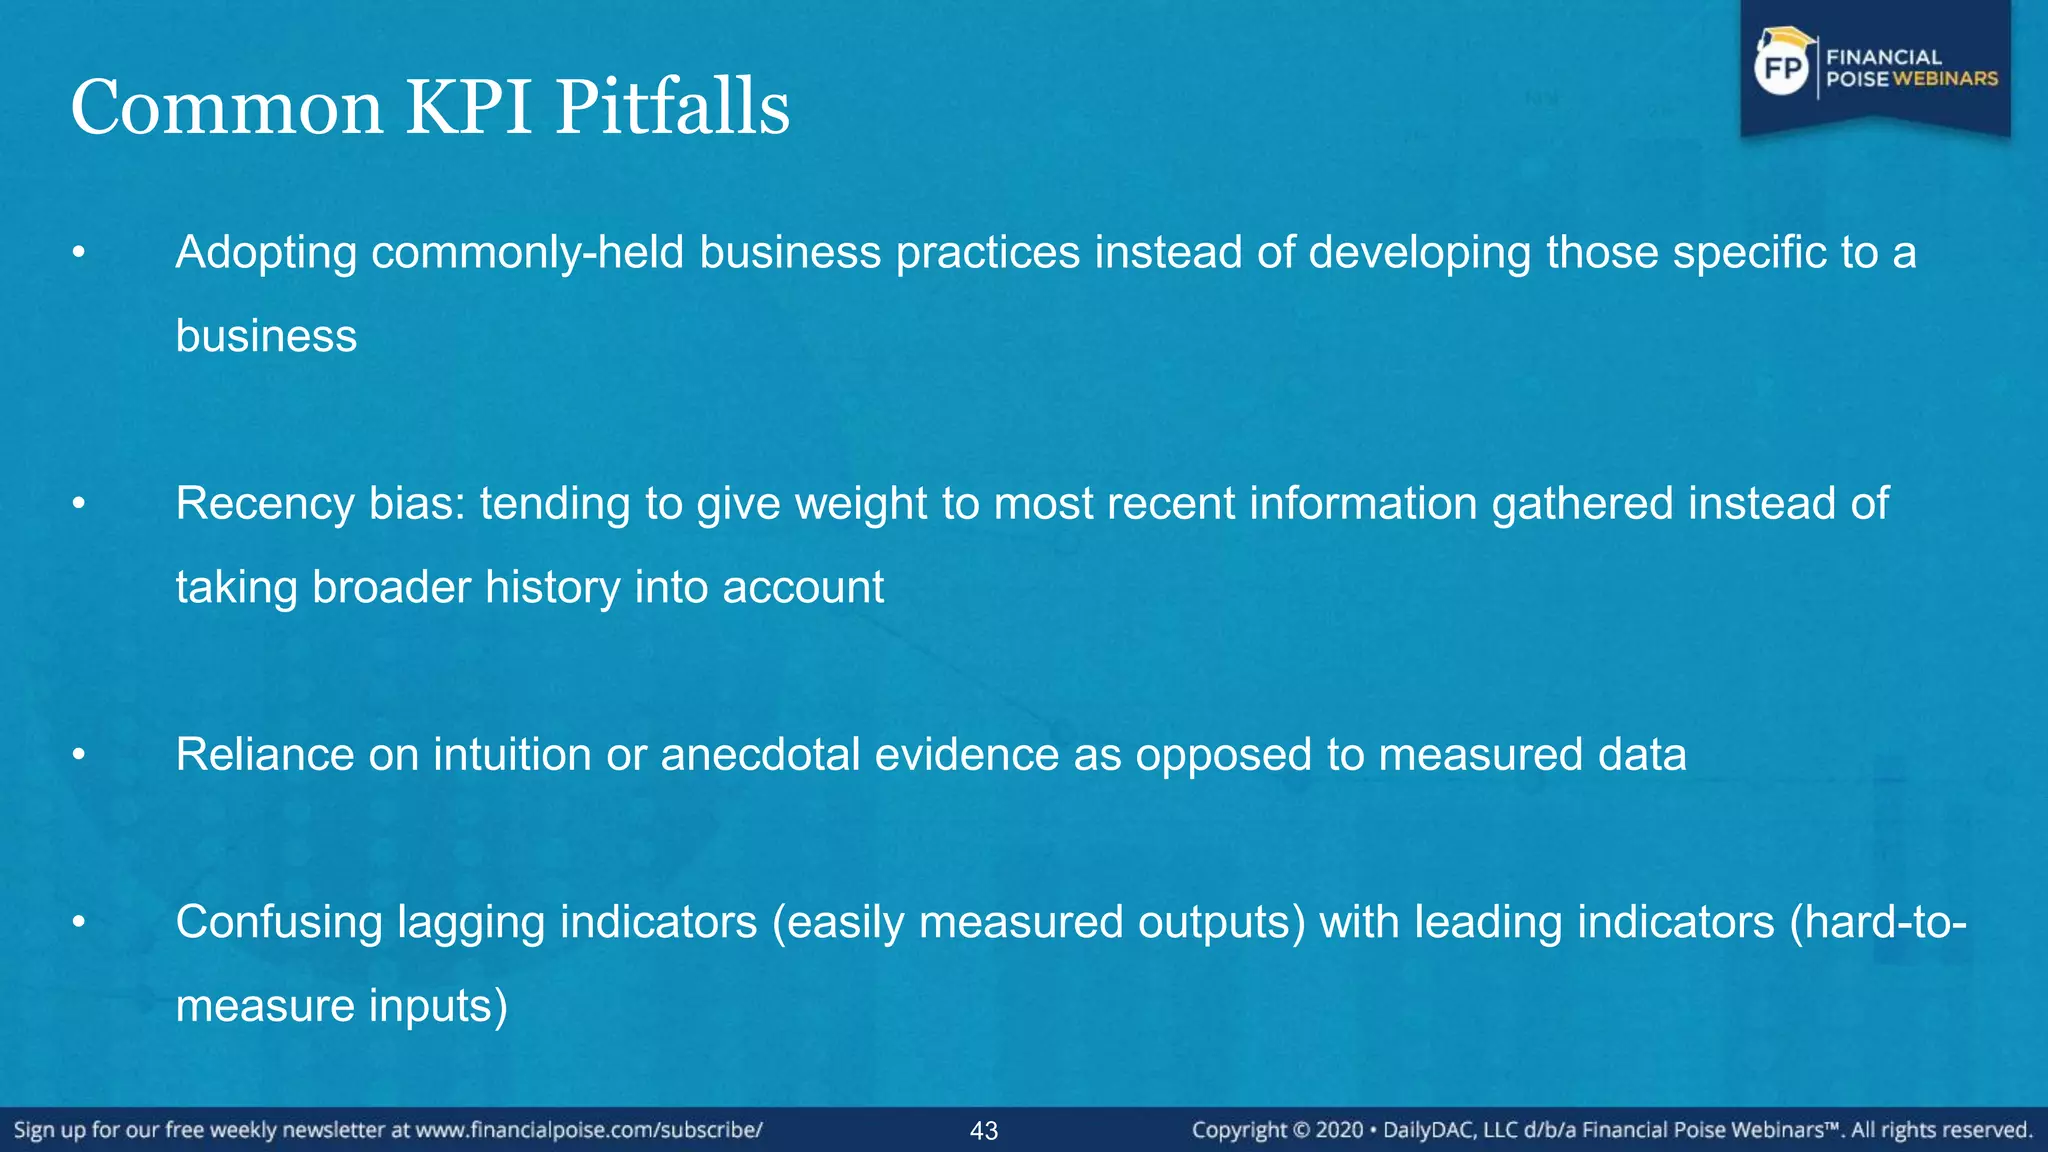
1
2
Practical and entertaining education for
attorneys, accountants, business owners and
executives, and investors.
3
Thank You To Our Sponsor
Disclaimer
The material in this webinar is for informational purposes only. It should not be considered
legal, financial or other professional advice. You should consult with an attorney or other
appropriate professional to determine what may be best for your individual needs. While
Financial Poise™ takes reasonable steps to ensure that information it publishes is accurate,
Financial Poise™ makes no guaranty in this regard.
5
Meet the Faculty
MODERATOR:
Chris Cahill - L&G Law Group LLP
PANELISTS:
John Levitske - Ankura Consulting Group, LLC
Michael Schwarzmann - Independent CRO and Restructuring Advisor
Ken Yager - Newpoint Advisors Corporation
6
About This Webinar
The KPI- Cash Flow Modeling and Projections
You can chase a lot of financial measures of your business, but nothing stacks up to cash
flow. Like a boat captain on a rough sea, being able to see what is coming at you financially is
absolutely invaluable. Cash flow models are the absolute go-to tool for reviewing companies
in distress, yet they are also invaluable to venture capitalist who must manage long range
investments as well as fast growth. This webinar discusses the basic components of a cash
flow model, why it is weekly and not monthly and why 13 weeks is the usual length. This
webinar also discusses what type of data is best for making an efficient and practical cash
flow model, as well as best practices for reporting and pitfalls associated with modeling and
balance roll forwards.
7
About This Series
MBA Boot Camp 2020
“If you don’t know your numbers, you don’t know your business.” This is a common refrain
that is equally applicable to attorney and other consultants who work with businesses. This
webinar series is designed for you if you are a startup founder, business owner, executive,
investor, attorney, or consultant who, though not a finance or accounting professional, finds
herself needing to understand finance and accounting. It won’t make you an expert but it will
give you the tools you need to speak with experts in order to get more out of them and it will
provide a solid foundation on which you can build. Packed with illustrative examples, helpful
anecdotes and real-world case studies, this series teaches you some of the key take things you
need to understand about finance and accounting.
Each Financial Poise Webinar is delivered in Plain English, understandable to investors, business owners, and
executives without much background in these areas, yet is of primary value to attorneys, accountants, and other
seasoned professionals. Each episode brings you into engaging, sometimes humorous, conversations designed to
entertain as it teaches. Each episode in the series is designed to be viewed independently of the other episodes so that
participants will enhance their knowledge of this area whether they attend one, some, or all episodes.
8
Episodes in this Series
#1: EBITDA and Other Scary Words
Premiere date: 1/23/20
#2: How to Read a Balance Sheet – And Why You Care!
Premiere date: 2/20/20
#3: The KPI- Cash Flow Modeling and Projections
Premiere date: 3/19/20
#4: Where Did All My Profits Go? Mastering the Concept of Working Capital
Premiere date: 4/16/20
9
Episode #3
The KPI- Cash Flow Modeling and Projections
10
Introduction to Key Performance Indicators (“KPI”)
• What is a Key Performance Indicator?
 A measurable value that demonstrates how effectively company achieves key
business objectives
 An actionable “scorecard” for a business to measure strategies & achieve goals
 Can help businesses manage, control, and achieve desired business results
 May be applied to various facets of business
 Often used to reflect a business’s most important objectives, not necessarily every
objective
11
Introduction to Key Performance Indicators (“KPI”)
• What kinds of objectives can KPI be used to measure?
 Financial goals and successes/failures
 Customer metrics
 Personnel metrics
 Process metrics
12
Introduction to Key Performance Indicators (“KPI”)
• Why and when is KPI used to improve performance?
 Helps to understand where the company is performing well and where it can
improve
o Management may be blind to improvement opportunities based on experiences
and duration with company; or
o Management may hesitate calling out opportunities to improve due to fear of
criticism and blame
13
Introduction to Key Performance Indicators (“KPI”)
• Why and when is KPI used to improve performance? (cont’d)
 Allows the company to compare performance to other industry participants
o Typically, this is accomplished by benchmarking performance to public
companies, where audited data is available and adjusting the scale where
applicable
 Historical performance can also be used to identify changes and opportunities for
improvement
14
Introduction to Key Performance Indicators (“KPI”)
• Example -
 A retail children’s clothing turnover in a brick and mortar retailer is knowable, such
that if a company turns its inventory only 2x a year and the industry average in the
segment is 5x-6x a year, that helps to identify an area to be investigated
 Similarly, if the company has a 7x a year turnover it could help the company
prioritize other areas for improvement
15
Introduction to Key Performance Indicators (“KPI”)
• Overall, experience helps to understand where deviation is appropriate
 For example, inventory turn for ski jackets is different from inventory turn for college
- licensed pullover sweatshirts, even though both are seasonal outerwear
16
“Don't be afraid to give up the good to go for the great.”
- John D. Rockefeller
17
KPI as Part of Overall Business Strategies and
Considerations
• KPIs should be incorporated into a company’s broader strategy and understanding
of its own performance, and used to measure various aspects of business not
captured by other measurements
• Other measures of business health and position covered in this series:
 EBITDA (Earnings Before Interest, Taxes, Depreciation, and Amortization)
o Essentially, a company’s net operating income
o Used to analyze and compare profitability between companies by
eliminating effects of financing and accounting decisions.
18
KPI as Part of Overall Business Strategies and
Considerations
• Other measures of business health and position covered in this series:
 Balance Sheet Analyses
o Balance sheet tells management & investors how much money company
has, how much it owes, and resulting net worth (shareholder equity)
o Presents a snapshot of the Company’s financial conditions at a specific
time
19
KPI as Part of Overall Business Strategies and
Considerations
• Working Capital
 (Total Current Assets - Total Current Liabilities)
 Positive working capital means that company can pay off its short-term
liabilities. Negative working capital means company currently is unable to
meet its short-term liabilities
20
Common Steps to Developing & Implementing KPI
• Set Goals and Objectives
 Example: increase sales
• Establish success factors related to goals and objectives
 Steps to be taken by team members to reach goals
 Usually takes the form of measurable activity over specified period
 Example: Increase sales leads by 10% in first quarter of year
21
Common Steps to Developing & Implementing KPI
• Establish Key Performance Indicators of goal achievement based on success factors
 E.g., KPI related to increasing sales leads: actual % increase or % decrease in
website visits converting to leads for Q1
• Collect data
• Calculate results
• Draw conclusions
22
Developing KPI – Best Practices and Tips
• KPI should be:
 Well-defined & quantifiable
 Communicated to team members
 Related to important goals & metrics
 Applicable to Line of Business (“LOB”)
23
Developing KPI – Best Practices and Tips
• Tips for developing KPI
 Identify appropriate team members to work on KPI
 Conduct internal interviews/investigations to develop goals & objectives
 SWOT Analysis by team developing KPI
o Strengths, Weaknesses, Opportunities, Threats
 Team may develop SMART goals or objectives to guide KPI:
o Specific, Measurable, Achievable, Relevant, & Time-bound
24
Developing KPI – Best Practices and Tips
• Expectations for KPIs
 KPIs evolve
 What is important today may not be tomorrow
 Perfect data may not exist today
o Start with elements available, build from there
o Put timelines and projects together to build better data
25
Developing KPI – Best Practices and Tips
• Connecting the dots
 Metrics should track from somewhere and lead to somewhere
 High-level metric should also have related, lower level metrics tracked by
individual, and that some plant, department or division also tracks
 Time period should mean something to users of metrics
 Metric must be timely
26
Developing KPI – Best Practices and Tips
• How many KPIs to process
 Most KPIs end up part of bigger picture or group of KPIs
 Humans can handle or react to only so many KPIs
 Best rule of thumb: no one person should be responsible for more than 3 KPIs
 For more than 3 KPIs, a group or multiple responsible parties like a department is
required
27
KPI Examples: Financial Metrics
• Profit
 Simple, but highly relevant
 Analyze both gross and net profit margins
• Cost
 Measure cost effectiveness of business operations to reduce or manage costs
• Line of business revenue vs. Target
 Comparison between actual and projected revenues
 Tracking discrepancies helps identify how specific departments, or company as a
whole, perform
28
KPI Examples: Financial Metrics
• Day Sales Outstanding (“DSO”)
 (Accounts Receivable ÷Total Credit Sales) × Number of days in period examined
 Result = DSO
 Indicates company’s ability to collect accounts receivable
 Lower number = better collections
29
KPI Examples: Financial Metrics
• Day Payables Outstanding (“DPO”)
 (Accounts Payable ÷Total Cost of Goods Sold) × Number of days in time frame
examined
 Result = DPO
 Indicates company’s ability to gain accounts payable credit
 Bigger number = better vendor credit
30
KPI Examples: Financial Metrics
• Days Inventory Outstanding (“DIO”)
 (Inventory ÷Total Cost of Goods Sold) × Number of days in time frame examined
 Result = DIO
 Indicates company’s need to hold inventory
 Lower number = better inventory turnover
31
KPI Examples: Cash Cycle (Aggregating Financial
Metrics)
• Cash Cycle
 Measure of working capital converted to a day-based equation
 DPO - DSO - DIO = Cash Cycle
 Most companies have negative Cash Cycle number
 Cash Cycle result indicates gap in total working capital by days, and how much
company needs from outside sources of capital
32
“Managers and investors alike must understand that
accounting numbers are the beginning, not the end, of
business valuation.”
- Warren Buffett
33
KPI Examples: Financial Metrics
• Sales by Region
 Can be used to compare sales across regions, identify high performers and low
performers, and may provide insight as to how low performers can improve in
specific regions
• LOB Expenses vs. Budget
 Comparison of actual overhead costs against budget
 Aids in developing future budgets
34
KPI Examples: Customer Metrics
• Customer Lifetime Value (“CLV”)
 Determination of optimal customers
 Examines value of long-time customers to company to narrow targets for future
customers likely to form long-term relationships with company
• Customer Acquisition Cost (“CAC”)
 Total Acquisition Costs ÷ No. New Customers over specific period
 Result = CAC
 Important metric to determine effectiveness of marketing campaigns
• Customer Satisfaction & Retention
35
KPI Examples: Customer Metrics
• Net Promoter Score (“NPS”)
 Measures likelihood customers will refer others to company
 May be determined by quarterly customer satisfaction survey incorporating
question relating to likelihood of referring contacts/friends to the company
• Number of Customers
 Measuring gains and losses of total customers aids determining ability to meet
customer needs
36
KPI Examples: Customer Metrics
• Churn Rate
 Measures % of customers that fail to make repeat purchases or discontinue service
during specific period
 (No. customers lost during Period) ÷ (No. customers at beginning of Period) =
(Customer Churn Rate)
• Contact volume by channel
 Tracks customer support requests by phone, email, web portal, etc. to determine
customers’ preferred method of seeking support
37
KPI Examples: Process Metrics
• Customer Support Tickets
 Analysis of number of customer support tickets opened and resolved in specified
time period
 Measures customer service capabilities, strengths, & weaknesses
• Percentage of Product Defects
 No. defective units during time period ÷ total units produced during time period
 Lower is better!
 Can identify process issues if number is high
38
KPI Examples: Process Metrics
• LOB Efficiency Measure
 Measured differently depending on line of business (LOB)
• Example: manufacturing
 No. units produced per hour % time plant is running
39
KPI Examples: Personnel Metrics
• Employee Turnover Rate (“ETR”)
 No. Employees exiting during time period ÷ average no. employees
 Indicates company’s ability to retain talent, determine steps to reducing turnover for
future if ETR is high
• Percentage response to open positions
 High % of qualified applicants may indicate desirability of company to job seekers
 Low % may indicate issues with employee benefits offerings, salary, etc.
• Employee satisfaction
 Internal employee satisfaction surveys may indicate areas for improvement or
continuance/discontinuance of employee programs or other benefits
40
KPI Examples: Personnel Metrics
• Retirement rate
 Key to developing strategic workforce plan with aging workforce
 High retirement rates aid in developing hiring strategies
• Internal promotion vs. external hires
 Measurement of internal promotion vs. external hires when vacancies open
 Effective means of building succession plan
41
“Erroneous assumptions can be disastrous.”
- Peter F. Drucker
42
Common KPI Pitfalls
• Adopting commonly-held business practices instead of developing those specific to a
business
• Recency bias: tending to give weight to most recent information gathered instead of
taking broader history into account
• Reliance on intuition or anecdotal evidence as opposed to measured data
• Confusing lagging indicators (easily measured outputs) with leading indicators (hard-to-
measure inputs)
43
About the Faculty
44
About The Faculty
Chris Cahill - ccahill@lgcounsel.com
Mr. Cahill is Head of the Bankruptcy and Restructuring Practice Group at L&G Law Group
LLP, in Chicago, Illinois. He guides secured lenders, creditors, debtors, creditors’
committees, potential purchasers and others through bankruptcy cases, out-of-court
workouts, assignments for the benefit of creditors, and receiverships. Mr. Cahill has
substantial mega-case experience representing very large debtors, and counsels and litigates
on behalf of manufacturers and secured lenders in large and middle-market cases.
Mr. Cahill also publishes frequently and speaks regularly on commercial insolvency
issues. He is an executive editor of Commercial Bankruptcy Litigation, 2d Edition (Jonathan
P. Friedland, Elizabeth Vandesteeg & Christopher M. Cahill eds., 2020) and is the host of
Financial Poise Radio, a periodic broadcast for investors and other curious persons,
on www.financialpoise.com.
45
About The Faculty
John Levitske - John.Levitske@ankura.com
John Levitske is a Senior Managing Director at Ankura, focused on business valuation and complex financial
disputes. He has served as a senior advisor to companies, owners, executives, and legal counsel in business
disputes, shareholder disputes, and M&A transactions regarding issues of valuation, finance, damages, and
accounting. John is based in Chicago. With more than two decades of Big Four public accounting and
international consulting experience, John is seasoned in business valuation, financial analysis, economic
damage quantification, forensic accounting, retrospective solvency analysis, and post-merger & acquisition
accounting calculations. He handles appraisals of healthy and distressed companies for buyouts of shareholders
and creditors, transaction planning, estate and gift taxation, financial accounting, bankruptcy proceedings, and
litigation disputes. John has provided consulting and expert witness testimony services and has served as a
neutral party in arbitration and mediation. He has testified as an expert witness in the US and Europe in
depositions, hearings, bench and jury court trials, and domestic and international arbitration (ICC, SCC, AAA,
JAMS, FINRA, and ad hoc arbitrations) and has served as a neutral arbitrator. In addition, he has rendered
binding decisions on disputed matters.
To read more, go to https://www.financialpoise.com/financialpoisewebinars/faculty/john-levitske/.
46
About The Faculty
Michael Schwarzmann – michaelschwarzmann@yahoo.com
Michael Schwarzmann has over 20 years’ experience helping identify opportunities to create value for his clients.
I have extensive experience working with established companies when they encounter financial difficulties by
assisting them in developing solutions to address short term cash needs and longer term profitability. My
process includes helping to identify cost savings and value capture scenarios by analyzing historical financial
performance along with current operations and projecting optimizing strategies. Utilizing weekly and monthly
cash flow statements, budgets, and forecasts, I utilize a focused, data driven approach to identifying
opportunities to increase company profitability. Through a broad review of financial, operational and strategic
performance, I help guide companies to increased profitability. Working across the organization, vertically and
horizontally, uncovers additional solutions and generates greater buy-in of the goals, objectives and action plan,
all of which are critical to maximize the impact of proposed changes. I utilize my legal knowledge to seamlessly
work with counsel to identify and address legal issues in a more cost effective manner.
I have guided the development and evaluation of business plans and formulated successful strategies to
preserve or improve asset values. I am a consensus builder. Industry experience includes: health care,
manufacturing, agricultural, construction, restaurants and franchising, energy and travel.
47
About The Faculty
Ken Yager – KYager@newpointadvisors.us
Ken has 25 years of executive leadership experience in stakeholder communication. Mr. Yager regularly takes
on profit and loss and risk-management responsibility for cash-constrained companies in growth, leveraged-
buyout and turnaround situations. He also has successfully worked on implementing dozens of initiatives
involving, operations and project management, team building, marketing, and sales and joint-venture
management. He is a fierce advocate for capital preservation and saving jobs. Ken has worked with clients in a
variety of industries in over 100 engagements. Prior to Newpoint Advisors, Mr. Yager was a Principal at
MorrisAnderson, a national turnaround management firm focused on assisting companies deal with severe
liquidity issues and insolvency. Mr. Yager previously held positions at Newpoint Ventures, a company dedicated
to revitalizing middle-market companies through new management and the introduction of low-cost employee
leveraging tools; Equity Sponsor Business Development at Bank of America; The Assurance practice of Coopers
& Lybrand and the Capital Markets Division of Salomon Brothers. Ken earned a Bachelor’s degree in
Management with majors in Finance and Accounting from Tulane University, A.B. Freeman School of Business,
and received a Master of Management degree from J.L. Kellogg Graduate School of Management. Ken is a
member of the Chicago/Midwest chapter of the Turnaround Management Association (TMA) and was on the
International Board as the Vice President of Education and chairs the Education Oversight Committee. Member
of American Bankruptcy Institute.
48
Questions or Comments?
If you have any questions about this webinar that you did not get to ask during the live
premiere, or if you are watching this webinar On Demand, please do not hesitate to email us
at info@financialpoise.com with any questions or comments you may have. Please include
the name of the webinar in your email and we will do our best to provide a timely response.
IMPORTANT NOTE: The material in this presentation is for general educational purposes
only. It has been prepared primarily for attorneys and accountants for use in the pursuit of
their continuing legal education and continuing professional education.
49
About Financial Poise
50
Financial Poise™ has one mission: to provide
reliable plain English business, financial, and legal
education to individual investors, entrepreneurs,
business owners and executives.
Visit us at www.financialpoise.com
Our free weekly newsletter, Financial Poise
Weekly, updates you on new articles published
on our website and Upcoming Webinars you
may be interested in.
To join our email list, please visit:
https://www.financialpoise.com/subscribe/

The KPI - Cash Flow Modeling and Projections (Series: MBA Boot Camp 2020)

  • 1.
  • 2.
    2 Practical and entertainingeducation for attorneys, accountants, business owners and executives, and investors.
  • 3.
    3 Thank You ToOur Sponsor
  • 5.
    Disclaimer The material inthis webinar is for informational purposes only. It should not be considered legal, financial or other professional advice. You should consult with an attorney or other appropriate professional to determine what may be best for your individual needs. While Financial Poise™ takes reasonable steps to ensure that information it publishes is accurate, Financial Poise™ makes no guaranty in this regard. 5
  • 6.
    Meet the Faculty MODERATOR: ChrisCahill - L&G Law Group LLP PANELISTS: John Levitske - Ankura Consulting Group, LLC Michael Schwarzmann - Independent CRO and Restructuring Advisor Ken Yager - Newpoint Advisors Corporation 6
  • 7.
    About This Webinar TheKPI- Cash Flow Modeling and Projections You can chase a lot of financial measures of your business, but nothing stacks up to cash flow. Like a boat captain on a rough sea, being able to see what is coming at you financially is absolutely invaluable. Cash flow models are the absolute go-to tool for reviewing companies in distress, yet they are also invaluable to venture capitalist who must manage long range investments as well as fast growth. This webinar discusses the basic components of a cash flow model, why it is weekly and not monthly and why 13 weeks is the usual length. This webinar also discusses what type of data is best for making an efficient and practical cash flow model, as well as best practices for reporting and pitfalls associated with modeling and balance roll forwards. 7
  • 8.
    About This Series MBABoot Camp 2020 “If you don’t know your numbers, you don’t know your business.” This is a common refrain that is equally applicable to attorney and other consultants who work with businesses. This webinar series is designed for you if you are a startup founder, business owner, executive, investor, attorney, or consultant who, though not a finance or accounting professional, finds herself needing to understand finance and accounting. It won’t make you an expert but it will give you the tools you need to speak with experts in order to get more out of them and it will provide a solid foundation on which you can build. Packed with illustrative examples, helpful anecdotes and real-world case studies, this series teaches you some of the key take things you need to understand about finance and accounting. Each Financial Poise Webinar is delivered in Plain English, understandable to investors, business owners, and executives without much background in these areas, yet is of primary value to attorneys, accountants, and other seasoned professionals. Each episode brings you into engaging, sometimes humorous, conversations designed to entertain as it teaches. Each episode in the series is designed to be viewed independently of the other episodes so that participants will enhance their knowledge of this area whether they attend one, some, or all episodes. 8
  • 9.
    Episodes in thisSeries #1: EBITDA and Other Scary Words Premiere date: 1/23/20 #2: How to Read a Balance Sheet – And Why You Care! Premiere date: 2/20/20 #3: The KPI- Cash Flow Modeling and Projections Premiere date: 3/19/20 #4: Where Did All My Profits Go? Mastering the Concept of Working Capital Premiere date: 4/16/20 9
  • 10.
    Episode #3 The KPI-Cash Flow Modeling and Projections 10
  • 11.
    Introduction to KeyPerformance Indicators (“KPI”) • What is a Key Performance Indicator?  A measurable value that demonstrates how effectively company achieves key business objectives  An actionable “scorecard” for a business to measure strategies & achieve goals  Can help businesses manage, control, and achieve desired business results  May be applied to various facets of business  Often used to reflect a business’s most important objectives, not necessarily every objective 11
  • 12.
    Introduction to KeyPerformance Indicators (“KPI”) • What kinds of objectives can KPI be used to measure?  Financial goals and successes/failures  Customer metrics  Personnel metrics  Process metrics 12
  • 13.
    Introduction to KeyPerformance Indicators (“KPI”) • Why and when is KPI used to improve performance?  Helps to understand where the company is performing well and where it can improve o Management may be blind to improvement opportunities based on experiences and duration with company; or o Management may hesitate calling out opportunities to improve due to fear of criticism and blame 13
  • 14.
    Introduction to KeyPerformance Indicators (“KPI”) • Why and when is KPI used to improve performance? (cont’d)  Allows the company to compare performance to other industry participants o Typically, this is accomplished by benchmarking performance to public companies, where audited data is available and adjusting the scale where applicable  Historical performance can also be used to identify changes and opportunities for improvement 14
  • 15.
    Introduction to KeyPerformance Indicators (“KPI”) • Example -  A retail children’s clothing turnover in a brick and mortar retailer is knowable, such that if a company turns its inventory only 2x a year and the industry average in the segment is 5x-6x a year, that helps to identify an area to be investigated  Similarly, if the company has a 7x a year turnover it could help the company prioritize other areas for improvement 15
  • 16.
    Introduction to KeyPerformance Indicators (“KPI”) • Overall, experience helps to understand where deviation is appropriate  For example, inventory turn for ski jackets is different from inventory turn for college - licensed pullover sweatshirts, even though both are seasonal outerwear 16
  • 17.
    “Don't be afraidto give up the good to go for the great.” - John D. Rockefeller 17
  • 18.
    KPI as Partof Overall Business Strategies and Considerations • KPIs should be incorporated into a company’s broader strategy and understanding of its own performance, and used to measure various aspects of business not captured by other measurements • Other measures of business health and position covered in this series:  EBITDA (Earnings Before Interest, Taxes, Depreciation, and Amortization) o Essentially, a company’s net operating income o Used to analyze and compare profitability between companies by eliminating effects of financing and accounting decisions. 18
  • 19.
    KPI as Partof Overall Business Strategies and Considerations • Other measures of business health and position covered in this series:  Balance Sheet Analyses o Balance sheet tells management & investors how much money company has, how much it owes, and resulting net worth (shareholder equity) o Presents a snapshot of the Company’s financial conditions at a specific time 19
  • 20.
    KPI as Partof Overall Business Strategies and Considerations • Working Capital  (Total Current Assets - Total Current Liabilities)  Positive working capital means that company can pay off its short-term liabilities. Negative working capital means company currently is unable to meet its short-term liabilities 20
  • 21.
    Common Steps toDeveloping & Implementing KPI • Set Goals and Objectives  Example: increase sales • Establish success factors related to goals and objectives  Steps to be taken by team members to reach goals  Usually takes the form of measurable activity over specified period  Example: Increase sales leads by 10% in first quarter of year 21
  • 22.
    Common Steps toDeveloping & Implementing KPI • Establish Key Performance Indicators of goal achievement based on success factors  E.g., KPI related to increasing sales leads: actual % increase or % decrease in website visits converting to leads for Q1 • Collect data • Calculate results • Draw conclusions 22
  • 23.
    Developing KPI –Best Practices and Tips • KPI should be:  Well-defined & quantifiable  Communicated to team members  Related to important goals & metrics  Applicable to Line of Business (“LOB”) 23
  • 24.
    Developing KPI –Best Practices and Tips • Tips for developing KPI  Identify appropriate team members to work on KPI  Conduct internal interviews/investigations to develop goals & objectives  SWOT Analysis by team developing KPI o Strengths, Weaknesses, Opportunities, Threats  Team may develop SMART goals or objectives to guide KPI: o Specific, Measurable, Achievable, Relevant, & Time-bound 24
  • 25.
    Developing KPI –Best Practices and Tips • Expectations for KPIs  KPIs evolve  What is important today may not be tomorrow  Perfect data may not exist today o Start with elements available, build from there o Put timelines and projects together to build better data 25
  • 26.
    Developing KPI –Best Practices and Tips • Connecting the dots  Metrics should track from somewhere and lead to somewhere  High-level metric should also have related, lower level metrics tracked by individual, and that some plant, department or division also tracks  Time period should mean something to users of metrics  Metric must be timely 26
  • 27.
    Developing KPI –Best Practices and Tips • How many KPIs to process  Most KPIs end up part of bigger picture or group of KPIs  Humans can handle or react to only so many KPIs  Best rule of thumb: no one person should be responsible for more than 3 KPIs  For more than 3 KPIs, a group or multiple responsible parties like a department is required 27
  • 28.
    KPI Examples: FinancialMetrics • Profit  Simple, but highly relevant  Analyze both gross and net profit margins • Cost  Measure cost effectiveness of business operations to reduce or manage costs • Line of business revenue vs. Target  Comparison between actual and projected revenues  Tracking discrepancies helps identify how specific departments, or company as a whole, perform 28
  • 29.
    KPI Examples: FinancialMetrics • Day Sales Outstanding (“DSO”)  (Accounts Receivable ÷Total Credit Sales) × Number of days in period examined  Result = DSO  Indicates company’s ability to collect accounts receivable  Lower number = better collections 29
  • 30.
    KPI Examples: FinancialMetrics • Day Payables Outstanding (“DPO”)  (Accounts Payable ÷Total Cost of Goods Sold) × Number of days in time frame examined  Result = DPO  Indicates company’s ability to gain accounts payable credit  Bigger number = better vendor credit 30
  • 31.
    KPI Examples: FinancialMetrics • Days Inventory Outstanding (“DIO”)  (Inventory ÷Total Cost of Goods Sold) × Number of days in time frame examined  Result = DIO  Indicates company’s need to hold inventory  Lower number = better inventory turnover 31
  • 32.
    KPI Examples: CashCycle (Aggregating Financial Metrics) • Cash Cycle  Measure of working capital converted to a day-based equation  DPO - DSO - DIO = Cash Cycle  Most companies have negative Cash Cycle number  Cash Cycle result indicates gap in total working capital by days, and how much company needs from outside sources of capital 32
  • 33.
    “Managers and investorsalike must understand that accounting numbers are the beginning, not the end, of business valuation.” - Warren Buffett 33
  • 34.
    KPI Examples: FinancialMetrics • Sales by Region  Can be used to compare sales across regions, identify high performers and low performers, and may provide insight as to how low performers can improve in specific regions • LOB Expenses vs. Budget  Comparison of actual overhead costs against budget  Aids in developing future budgets 34
  • 35.
    KPI Examples: CustomerMetrics • Customer Lifetime Value (“CLV”)  Determination of optimal customers  Examines value of long-time customers to company to narrow targets for future customers likely to form long-term relationships with company • Customer Acquisition Cost (“CAC”)  Total Acquisition Costs ÷ No. New Customers over specific period  Result = CAC  Important metric to determine effectiveness of marketing campaigns • Customer Satisfaction & Retention 35
  • 36.
    KPI Examples: CustomerMetrics • Net Promoter Score (“NPS”)  Measures likelihood customers will refer others to company  May be determined by quarterly customer satisfaction survey incorporating question relating to likelihood of referring contacts/friends to the company • Number of Customers  Measuring gains and losses of total customers aids determining ability to meet customer needs 36
  • 37.
    KPI Examples: CustomerMetrics • Churn Rate  Measures % of customers that fail to make repeat purchases or discontinue service during specific period  (No. customers lost during Period) ÷ (No. customers at beginning of Period) = (Customer Churn Rate) • Contact volume by channel  Tracks customer support requests by phone, email, web portal, etc. to determine customers’ preferred method of seeking support 37
  • 38.
    KPI Examples: ProcessMetrics • Customer Support Tickets  Analysis of number of customer support tickets opened and resolved in specified time period  Measures customer service capabilities, strengths, & weaknesses • Percentage of Product Defects  No. defective units during time period ÷ total units produced during time period  Lower is better!  Can identify process issues if number is high 38
  • 39.
    KPI Examples: ProcessMetrics • LOB Efficiency Measure  Measured differently depending on line of business (LOB) • Example: manufacturing  No. units produced per hour % time plant is running 39
  • 40.
    KPI Examples: PersonnelMetrics • Employee Turnover Rate (“ETR”)  No. Employees exiting during time period ÷ average no. employees  Indicates company’s ability to retain talent, determine steps to reducing turnover for future if ETR is high • Percentage response to open positions  High % of qualified applicants may indicate desirability of company to job seekers  Low % may indicate issues with employee benefits offerings, salary, etc. • Employee satisfaction  Internal employee satisfaction surveys may indicate areas for improvement or continuance/discontinuance of employee programs or other benefits 40
  • 41.
    KPI Examples: PersonnelMetrics • Retirement rate  Key to developing strategic workforce plan with aging workforce  High retirement rates aid in developing hiring strategies • Internal promotion vs. external hires  Measurement of internal promotion vs. external hires when vacancies open  Effective means of building succession plan 41
  • 42.
    “Erroneous assumptions canbe disastrous.” - Peter F. Drucker 42
  • 43.
    Common KPI Pitfalls •Adopting commonly-held business practices instead of developing those specific to a business • Recency bias: tending to give weight to most recent information gathered instead of taking broader history into account • Reliance on intuition or anecdotal evidence as opposed to measured data • Confusing lagging indicators (easily measured outputs) with leading indicators (hard-to- measure inputs) 43
  • 44.
  • 45.
    About The Faculty ChrisCahill - ccahill@lgcounsel.com Mr. Cahill is Head of the Bankruptcy and Restructuring Practice Group at L&G Law Group LLP, in Chicago, Illinois. He guides secured lenders, creditors, debtors, creditors’ committees, potential purchasers and others through bankruptcy cases, out-of-court workouts, assignments for the benefit of creditors, and receiverships. Mr. Cahill has substantial mega-case experience representing very large debtors, and counsels and litigates on behalf of manufacturers and secured lenders in large and middle-market cases. Mr. Cahill also publishes frequently and speaks regularly on commercial insolvency issues. He is an executive editor of Commercial Bankruptcy Litigation, 2d Edition (Jonathan P. Friedland, Elizabeth Vandesteeg & Christopher M. Cahill eds., 2020) and is the host of Financial Poise Radio, a periodic broadcast for investors and other curious persons, on www.financialpoise.com. 45
  • 46.
    About The Faculty JohnLevitske - John.Levitske@ankura.com John Levitske is a Senior Managing Director at Ankura, focused on business valuation and complex financial disputes. He has served as a senior advisor to companies, owners, executives, and legal counsel in business disputes, shareholder disputes, and M&A transactions regarding issues of valuation, finance, damages, and accounting. John is based in Chicago. With more than two decades of Big Four public accounting and international consulting experience, John is seasoned in business valuation, financial analysis, economic damage quantification, forensic accounting, retrospective solvency analysis, and post-merger & acquisition accounting calculations. He handles appraisals of healthy and distressed companies for buyouts of shareholders and creditors, transaction planning, estate and gift taxation, financial accounting, bankruptcy proceedings, and litigation disputes. John has provided consulting and expert witness testimony services and has served as a neutral party in arbitration and mediation. He has testified as an expert witness in the US and Europe in depositions, hearings, bench and jury court trials, and domestic and international arbitration (ICC, SCC, AAA, JAMS, FINRA, and ad hoc arbitrations) and has served as a neutral arbitrator. In addition, he has rendered binding decisions on disputed matters. To read more, go to https://www.financialpoise.com/financialpoisewebinars/faculty/john-levitske/. 46
  • 47.
    About The Faculty MichaelSchwarzmann – michaelschwarzmann@yahoo.com Michael Schwarzmann has over 20 years’ experience helping identify opportunities to create value for his clients. I have extensive experience working with established companies when they encounter financial difficulties by assisting them in developing solutions to address short term cash needs and longer term profitability. My process includes helping to identify cost savings and value capture scenarios by analyzing historical financial performance along with current operations and projecting optimizing strategies. Utilizing weekly and monthly cash flow statements, budgets, and forecasts, I utilize a focused, data driven approach to identifying opportunities to increase company profitability. Through a broad review of financial, operational and strategic performance, I help guide companies to increased profitability. Working across the organization, vertically and horizontally, uncovers additional solutions and generates greater buy-in of the goals, objectives and action plan, all of which are critical to maximize the impact of proposed changes. I utilize my legal knowledge to seamlessly work with counsel to identify and address legal issues in a more cost effective manner. I have guided the development and evaluation of business plans and formulated successful strategies to preserve or improve asset values. I am a consensus builder. Industry experience includes: health care, manufacturing, agricultural, construction, restaurants and franchising, energy and travel. 47
  • 48.
    About The Faculty KenYager – KYager@newpointadvisors.us Ken has 25 years of executive leadership experience in stakeholder communication. Mr. Yager regularly takes on profit and loss and risk-management responsibility for cash-constrained companies in growth, leveraged- buyout and turnaround situations. He also has successfully worked on implementing dozens of initiatives involving, operations and project management, team building, marketing, and sales and joint-venture management. He is a fierce advocate for capital preservation and saving jobs. Ken has worked with clients in a variety of industries in over 100 engagements. Prior to Newpoint Advisors, Mr. Yager was a Principal at MorrisAnderson, a national turnaround management firm focused on assisting companies deal with severe liquidity issues and insolvency. Mr. Yager previously held positions at Newpoint Ventures, a company dedicated to revitalizing middle-market companies through new management and the introduction of low-cost employee leveraging tools; Equity Sponsor Business Development at Bank of America; The Assurance practice of Coopers & Lybrand and the Capital Markets Division of Salomon Brothers. Ken earned a Bachelor’s degree in Management with majors in Finance and Accounting from Tulane University, A.B. Freeman School of Business, and received a Master of Management degree from J.L. Kellogg Graduate School of Management. Ken is a member of the Chicago/Midwest chapter of the Turnaround Management Association (TMA) and was on the International Board as the Vice President of Education and chairs the Education Oversight Committee. Member of American Bankruptcy Institute. 48
  • 49.
    Questions or Comments? Ifyou have any questions about this webinar that you did not get to ask during the live premiere, or if you are watching this webinar On Demand, please do not hesitate to email us at info@financialpoise.com with any questions or comments you may have. Please include the name of the webinar in your email and we will do our best to provide a timely response. IMPORTANT NOTE: The material in this presentation is for general educational purposes only. It has been prepared primarily for attorneys and accountants for use in the pursuit of their continuing legal education and continuing professional education. 49
  • 50.
    About Financial Poise 50 FinancialPoise™ has one mission: to provide reliable plain English business, financial, and legal education to individual investors, entrepreneurs, business owners and executives. Visit us at www.financialpoise.com Our free weekly newsletter, Financial Poise Weekly, updates you on new articles published on our website and Upcoming Webinars you may be interested in. To join our email list, please visit: https://www.financialpoise.com/subscribe/