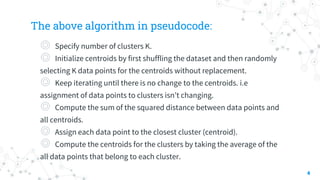
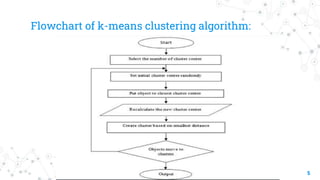
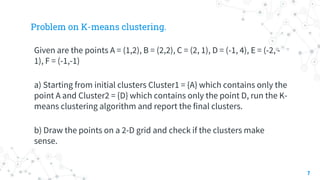
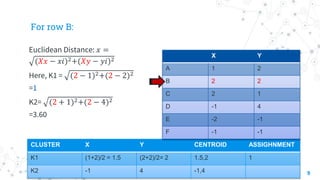
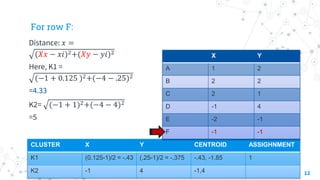
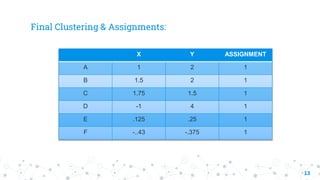
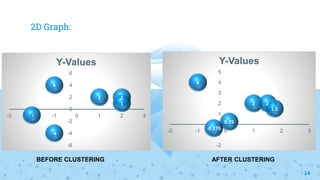
The document discusses two algorithms for matrix multiplication and finding the median of an unsorted list:
1) Strassen's algorithm improves on the traditional O(n^3) matrix multiplication algorithm by using divide and conquer to achieve O(n^lg7) time complexity.
2) Finding the median can be done in expected O(n) time using quickselect, or deterministically in O(n) time by choosing the median of medians as the pivot.
Introduction of metric dimension of circular graphs is connected graph , The distance and diameter , Resolving sets and location number then Examples . Application in facility location problems . is has motivation (Applications in Chemistry and Networks systems). Definitions of Certain Regular Graphs. Main Results for three graphs (Prism , Antiprism and generalized Petersen graphs .
Strassen's algorithm improves on the basic matrix multiplication algorithm which runs in O(N3) time. It achieves this by dividing the matrices into sub-matrices and performing 7 multiplications and 18 additions on the sub-matrices, rather than the 8 multiplications of the basic algorithm. This results in a runtime of O(N2.81) using divide and conquer, providing an asymptotic improvement over the basic O(N3) algorithm.
This document describes how to solve the traveling salesperson problem (TSP) using dynamic programming. It defines g(i,S) as the length of the shortest path from vertex i through all vertices in S to vertex 1. It shows that g(1,V-{1}) gives the optimal tour length, and that g(i,S) can be calculated using g values for smaller sets S via an equation. The complexity is O(n22n) time and O(n2n) space, which is better than brute force but still prohibitive for large n due to the exponential space needed.
This document describes how to solve the traveling salesperson problem (TSP) using dynamic programming. It defines g(i,S) as the length of the shortest path from vertex i through vertices in S to vertex 1. It shows that g(1,V-{1}) gives the optimal tour length, and that g(i,S) can be calculated using equation (2) by considering neighboring vertices. This runs in O(n2^n) time but requires O(n2^n) space, which is infeasible for large n.
Strassen's algorithm improves upon the standard matrix multiplication algorithm by using divide and conquer and only requiring 7 recursive multiplications to multiply 2x2 submatrices rather than 8. This results in a running time of O(n^2.81) rather than O(n^3) for large matrix sizes. The algorithm divides the matrices into submatrices, recursively multiplies the submatrices using 7 intermediate terms rather than relying on the commutativity of multiplication, and combines the results. While the improvement may seem small, the reduced exponent means Strassen's algorithm performs better than the standard algorithm for matrices larger than about 32x32 due to the impact of the exponent on runtime.
The document contains information about graphing a quadratic equation. It provides the vertex of (-5,-2) and finds the equation by using the vertex form y=a(x-h)^2+k. The calculated equation is y=-1/9(x-5)^2-2. This equation is compared to the graphing calculator's equation of y=-.473x^2+4.81x-14.33, which is similar but not exactly the same. Both equations are negative and open down. The actual equation given is y=-.473x^2+4.81x-14.33.
The document contains information about graphing a quadratic equation. It provides the vertex of (-5,-2) and finds the equation -3=-1/9(x-5)^2-2 by using the vertex form. It then compares the graphing calculator's graph of y=-0.473x^2+4.81x-14.33 to the equation -1/9(x-5)^2-2 derived. Both graphs open down and have negative equations, showing the steps were close to the actual equation.
The document discusses identifying quadratic, linear, and constant terms in functions. It then provides examples of determining if functions are quadratic or linear and finding the vertex and axis of symmetry of quadratic functions. The document concludes by using a table of data to model a real-world scenario with a quadratic function.
The document contains notes and examples about functions and relations. It defines functions and relations, and shows how to determine if a relation is a function using the vertical line test. Examples demonstrate evaluating functions for given inputs and writing the outputs in set notation. Steps are provided for mapping relations and identifying if they are functions. Practice problems have students substitute values into functions and write the outputs.
Fuzzy c means clustering protocol for wireless sensor networksmourya chandra
This document discusses clustering techniques for wireless sensor networks. It describes hierarchical routing protocols that involve clustering sensor nodes into cluster heads and non-cluster heads. It then explains fuzzy c-means clustering, which allows data points to belong to multiple clusters to different degrees, unlike hard clustering methods. Finally, it proposes using fuzzy c-means clustering as an energy-efficient routing protocol for wireless sensor networks due to its ability to handle uncertain or incomplete data.
The document contains learning objectives and examples for teaching students about limits of functions. It includes:
1) Examples of finding the limit of functions as x approaches specific values using tables of values. This shows that as x gets closer to the given value, f(x) gets closer to the limit value.
2) A definition of limit that states the limit of a function f(x) as x approaches a is L if, given any positive epsilon, there exists a delta such that if the difference between x and a is less than delta, the difference between f(x) and L will be less than epsilon.
3) Three theorems about limits: the limit of a sum or difference is the
A Mathematically Derived Number of Resamplings for Noisy Optimization (GECCO2...Jialin LIU
"A Mathematically Derived Number of Resamplings for Noisy Optimization". Jialin Liu, David L. St-Pierre and Olivier Teytaud. (Accepted as short paper) Genetic and Evolutionary Computation Conference (GECCO), 2014.
The document contains details of three tasks completed in MATLAB:
1. Addition, subtraction and multiplication of two transfer functions G1(s) and G2(s) using parallel and series functions.
2. Determining the transfer function of a rotational mechanical system and plotting its step and impulse responses.
3. Simulating the motion of a compound pendulum with different initial conditions and observing its position over time.
The document contains notes from a math lesson on November 12, 2013. It includes the following:
1) An assignment is due on Thursday November 14th and asks if a test was signed.
2) Warm-up problems include finding the area and circumference of a circle with diameter 6m, writing a number in scientific notation, and simplifying expressions.
3) The lesson defines functions, linear functions, and what makes a graph proportional. Linear functions that pass through (0,0) and rise to the right are proportional.
4) Examples are given to make function tables and graph linear equations to determine if they are proportional, including the functions y=3x, y=2x-
The document explores logarithm bases and patterns in logarithmic sequences. It finds that the value of logmn(mk) can be expressed as kn. It also determines that if loga(x)=c and logb(x)=d, then logab(x) can be calculated as cdc+d, allowing the third term in sequences to be determined.
The document explains the Pythagorean theorem and distance formula. The Pythagorean theorem states that for any right triangle, the square of the hypotenuse is equal to the sum of the squares of the other two sides. The distance formula calculates the distance between two points by taking the difference of their x- and y-coordinates, squaring each difference, and summing the results, taking the square root of the sum. An example of each formula is shown to demonstrate how to apply the formulas to solve for missing lengths or distances.
The document explains the Pythagorean theorem and distance formula. The Pythagorean theorem states that for any right triangle, the square of the hypotenuse is equal to the sum of the squares of the other two sides. The distance formula calculates the distance between two points by taking the difference of their x- and y-coordinates, squaring each difference, and summing the results, taking the square root of the total. An example problem demonstrates calculating the length of the hypotenuse using the Pythagorean theorem and finding the distance between two points using the distance formula.
The document provides instructions for several tasks in MATLAB and Simulink. It includes finding the roots of polynomials using MATLAB, performing operations on polynomials such as addition and subtraction, and modeling transfer functions and differential equations in Simulink. For each task, it shows the relevant code, MATLAB/Simulink models, and output responses. It also includes comments analyzing the step and impulse responses.
The document discusses matrices in MATLAB including:
1) How to generate matrices by separating columns with spaces or commas and rows with semicolons.
2) Common matrix operations in MATLAB like concatenation, replication, and arithmetic operations between matrices using multiplication, division, and exponentiation.
3) Examples of deleting rows from a matrix and performing operations on matrices like replication, concatenation, and transpose.
The document discusses shortest path problems and algorithms for finding shortest paths in graphs. It describes Dijkstra's algorithm for finding the shortest path between two nodes in a graph with non-negative edge weights. Prim's algorithm is presented for finding a minimum spanning tree, which is a subgraph connecting all nodes with minimum total edge weight. An example graph is given and steps are outlined for applying Prim's algorithm to find its minimum spanning tree.
The document provides instructions for a written test for admission to the Tata Institute of Fundamental Research. It describes that the test will have three parts, with Part A being common to both Computer Science and Systems Science streams. Part B will cover topics specific to Computer Science, while Part C will cover topics specific to Systems Science. Sample topics and questions are provided for each stream. The test will be three hours, multiple choice, and involve negative marking for incorrect answers. Calculators will not be permitted.
The document presents mathematical analysis of the Birch and Swinnerton-Dyer conjecture using power series. It derives formulas for the coefficients of the power series involving the sums and derivatives of the coefficients. It then applies these formulas and the Legendre polynomial to obtain an equation relating the coefficients to the value of the parameter λ.
The document discusses using imaginary numbers and derivatives to evaluate the Birch and Swinnerton-Dyer conjecture, which relates elliptic curves to special values of L-functions. It shows applying the product rule formula to take the derivative of a function F(r) involving imaginary numbers. Through integration by parts, it arrives at the solution L(C,s) = c(-2) + C, relating the L-function to constants.
K Means Clustering Algorithm | K Means Clustering Example | Machine Learning ...Simplilearn
This K-Means clustering algorithm presentation will take you through the machine learning introduction, types of clustering algorithms, k-means clustering, how does K-Means clustering work and at least explains K-Means clustering by taking a real life use case. This Machine Learning algorithm tutorial video is ideal for beginners to learn how K-Means clustering work.
Below topics are covered in this K-Means Clustering Algorithm presentation:
1. Types of Machine Learning?
2. What is K-Means Clustering?
3. Applications of K-Means Clustering
4. Common distance measure
5. How does K-Means Clustering work?
6. K-Means Clustering Algorithm
7. Demo: k-Means Clustering
8. Use case: Color compression
- - - - - - - -
About Simplilearn Machine Learning course:
A form of artificial intelligence, Machine Learning is revolutionizing the world of computing as well as all people’s digital interactions. Machine Learning powers such innovative automated technologies as recommendation engines, facial recognition, fraud protection and even self-driving cars.This Machine Learning course prepares engineers, data scientists and other professionals with knowledge and hands-on skills required for certification and job competency in Machine Learning.
- - - - - - -
Why learn Machine Learning?
Machine Learning is taking over the world- and with that, there is a growing need among companies for professionals to know the ins and outs of Machine Learning
The Machine Learning market size is expected to grow from USD 1.03 Billion in 2016 to USD 8.81 Billion by 2022, at a Compound Annual Growth Rate (CAGR) of 44.1% during the forecast period.
- - - - - -
What skills will you learn from this Machine Learning course?
By the end of this Machine Learning course, you will be able to:
1. Master the concepts of supervised, unsupervised and reinforcement learning concepts and modeling.
2. Gain practical mastery over principles, algorithms, and applications of Machine Learning through a hands-on approach which includes working on 28 projects and one capstone project.
3. Acquire thorough knowledge of the mathematical and heuristic aspects of Machine Learning.
4. Understand the concepts and operation of support vector machines, kernel SVM, naive bayes, decision tree classifier, random forest classifier, logistic regression, K-nearest neighbors, K-means clustering and more.
5. Be able to model a wide variety of robust Machine Learning algorithms including deep learning, clustering, and recommendation systems
- - - - - - -
This document provides information about clustering and cluster analysis. It begins by defining clustering as the process of grouping objects into classes of similar objects. It then discusses what a cluster is and different types of clustering techniques, including partitioning methods like k-means clustering. K-means clustering is explained as an algorithm that assigns objects to clusters based on minimizing distance between objects and cluster centers, then updating the cluster centers. Examples are provided to demonstrate how k-means clustering works on a sample dataset.
The document discusses coefficient of variation (CV), which is the ratio of the standard deviation to the mean. It provides an example comparing the CV of two multiple choice tests with different conditions. Formulas for calculating CV by hand and in Excel are shown. Methods for finding quartiles in ungrouped and grouped data are explained. The document also demonstrates how to calculate quartile deviation and construct box and whisker plots, and provides references for further information.
Enhance The K Means Algorithm On Spatial DatasetAlaaZ
The document describes an enhancement to the standard k-means clustering algorithm. The enhancement aims to improve computational speed by storing additional information from each iteration, such as the closest cluster and distance for each data point. This avoids needing to recompute distances to all cluster centers in subsequent iterations if a point does not change clusters. The complexity of the enhanced algorithm is reduced from O(nkl) to O(nk) where n is points, k is clusters, and l is iterations.
This document contains solutions to exercises on conic sections (hyperbolas, ellipses, circles, and parabolas) from a geometry guide.
The solutions include finding the center, vertices, foci, and eccentricity of various hyperbolas and ellipses given in standard form. One example given is a circle, for which the center and radius are identified. Another example is completed by rewriting the equation in canonical form.
The purpose is to understand these geometry topics for future professional careers by solving the guide's problems and verifying answers using GeoGebra.
The K-Nearest Neighbors (KNN) algorithm is a robust and intuitive machine learning method employed to tackle classification and regression problems. By capitalizing on the concept of similarity, KNN predicts the label or value of a new data point by considering its K closest neighbours in the training dataset. In this article, we will learn about a supervised learning algorithm (KNN) or the k – Nearest Neighbours, highlighting it’s user-friendly nature.
What is the K-Nearest Neighbors Algorithm?
K-Nearest Neighbours is one of the most basic yet essential classification algorithms in Machine Learning. It belongs to the supervised learning domain and finds intense application in pattern recognition, data mining, and intrusion detection.
It is widely disposable in real-life scenarios since it is non-parametric, meaning, it does not make any underlying assumptions about the distribution of data (as opposed to other algorithms such as GMM, which assume a Gaussian distribution of the given data). We are given some prior data (also called training data), which classifies coordinates into groups identified by an attribute.
This document discusses different types of clustering analysis techniques in data mining. It describes clustering as the task of grouping similar objects together. The document outlines several key clustering algorithms including k-means clustering and hierarchical clustering. It provides an example to illustrate how k-means clustering works by randomly selecting initial cluster centers and iteratively assigning data points to clusters and recomputing cluster centers until convergence. The document also discusses limitations of k-means and how hierarchical clustering builds nested clusters through sequential merging of clusters based on a similarity measure.
The k-means clustering algorithm partitions n observations into k clusters where each observation belongs to the cluster with the nearest mean. It works by assigning every observation to a cluster whose mean yields the least within-cluster sum of squares, then recalculating the means to be the centroids of the new clusters. The algorithm iterates between these two steps until convergence is achieved. K-means clustering is commonly used for data mining and machine learning applications such as image segmentation.
The document discusses circles in the coordinate plane. It provides examples of writing the equation of a circle given its center and radius or given two points it passes through. It also gives examples of graphing circles given their equations by identifying the center and radius. Additionally, it presents an example of using three points and their perpendicular bisectors to find the center of a circle passing through those three points, and applies this to solving a problem about finding the location of a structure.
Branch and bound is a state space search method that generates all children of a node before expanding any children. It associates a cost or profit with each node and uses a min or max heap to select the next node to expand. For the travelling salesman problem, it constructs a permutation tree representing all possible routes and uses lower bounds and reduced cost matrices at each node to prune the search space and find an optimal solution.
The student is able to (I can):
• Find the midpoint of two given points.
• Find the coordinates of an endpoint given one endpoint
and a midpoint.
• Find the distance between two points.
This document summarizes the K-means clustering algorithm. It provides an outline of the topics covered, which include an introduction to clustering and K-means, how to calculate K-means using steps 0 through 2, results and suggestions, and references. It then provides more detail on the three steps of K-means: 1) initialize centroids, 2) assign points to closest centroids, and 3) recalculate centroids. Pseudocode is provided to demonstrate how to code K-means in Visual Basic.
This document discusses two types of clustering algorithms: partitional and hierarchical clustering. It provides details on K-means, a popular partitional clustering algorithm, including the pseudocode and an example. It also discusses hierarchical clustering, including different cluster distance measures, the agglomerative algorithm, and provides an example of applying the agglomerative approach. Evaluation of K-means performance using sum of squared errors is also covered.
tIt appears that you've provided a set of instructions or input format for a machine learning task, particularly clustering using K-Means. Let's break down what each component means:
(number of clusters):
This is a placeholder for an actual numerical value that represents the desired number of clusters into which you want to divide your training data. In K-Means clustering, you need to specify in advance how many clusters (K) you want the algorithm to find in your data.
Training set:
The "training set" is your dataset, which contains the data points that you want to cluster. Each data point represents an observation or sample in your dataset.
(drop convention):
It's not clear from this input what "(drop convention)" refers to. It could be related to a specific data preprocessing or handling instruction, but without additional context or information, it's challenging to provide a precise explanation for this part.
In summary, you are expected to provide the number of clusters (K) that you want to discover in your training data, and the training data itself contains the observations or samples that will be used for clustering. The "(drop convention)" part may require further clarification or context to provide a meaningful explanation.Clustering is a fundamental concept in the field of machine learning and data analysis that involves grouping similar data points together based on certain criteria or patterns. It is a technique used to discover inherent structures, relationships, or similarities within a dataset when there are no predefined labels or categories. Clustering is widely employed in various domains, including marketing, biology, image analysis, recommendation systems, and more. In this comprehensive explanation of clustering, we will explore its principles, methods, applications, and key considerations.
Table of Contents
Introduction to Clustering
Key Concepts and Terminology
Types of Clustering
3.1. Partitioning Clustering
3.2. Hierarchical Clustering
3.3. Density-Based Clustering
3.4. Model-Based Clustering
Distance Metrics and Similarity Measures
Common Clustering Algorithms
5.1. K-Means Clustering
5.2. Hierarchical Agglomerative Clustering
5.3. DBSCAN (Density-Based Spatial Clustering of Applications with Noise)
5.4. Gaussian Mixture Models (GMM)
Evaluation of Clusters
Applications of Clustering
7.1. Customer Segmentation
7.2. Image Segmentation
7.3. Anomaly Detection
7.4. Document Clustering
7.5. Recommender Systems
7.6. Genomic Clustering
Challenges and Considerations
8.1. Determining the Number of Clusters (K)
8.2. Handling High-Dimensional Data
8.3. Initial Centroid Selection
8.4. Scaling and Normalization
8.5. Interpretation of Results
Best Practices in Clustering
Future Trends and Advances
Conclusion
1. Introduction to Clustering
Clustering, in the context of data analysis and machine learning, refers to the process of grouping a set of data points into subsets,
This document discusses various statistical measures including the coefficient of variation, quartile deviation, and box and whisker plots. It defines the coefficient of variation as the ratio of the standard deviation to the mean. Formulas for calculating the coefficient of variation by hand and in Excel are provided. Quartile deviation is defined as the semi-variation between the upper and lower quartiles, or the interquartile range. Steps for calculating quartile deviation from a data set are outlined. Finally, box and whisker plots are introduced as a way to visually represent the minimum, maximum, median, quartiles and interquartile range of a data set.
This document summarizes a distributed cloud-based genetic algorithm framework called TunUp for tuning the parameters of data clustering algorithms. TunUp integrates existing machine learning libraries and implements genetic algorithm techniques to tune parameters like K (number of clusters) and distance measures for K-means clustering. It evaluates internal clustering quality metrics on sample datasets and tunes parameters to optimize a chosen metric like AIC. The document outlines TunUp's features, describes how it implements genetic algorithms and parallelization, and concludes it is an open solution for clustering algorithm evaluation, validation and tuning.
This document defines and explains ordered pairs, rectangular coordinate systems, and formulas for distance and midpoint between points in a coordinate plane. It begins by defining ordered pairs and how they represent relationships between elements of two sets. It then introduces the rectangular coordinate system using perpendicular x and y axes intersecting at the origin, and how points are located using ordered pair coordinates. It provides the distance formula for finding the distance between any two points using their x and y coordinates. Examples are given to demonstrate using the formula and interpreting results. The midpoint formula is also defined for finding the midpoint of a line segment given the endpoints. Examples are worked through for both formulas.
ExcelR is the fastest growing company in providing Business analytics course in Delhi. In Data analytics training we are providing you key benefits, after completing the Business analytics course in Delhi successfully ExcelR is providing you certification from Malaysian University. ExcelR is based out and have multiple branches in India if you wish to learn in Business analytics course in Delhi in Chennai your search ends at ExcelR.
Our Business Analytics certification training course is designed by the industry experts, which is precisely tailored for the professionals who wants to pursue a career as a Data Scientist in job market.
Association Rule Mining || Data MiningIffat Firozy
Association rule mining is used to discover relationships between data items in large datasets. It finds frequent itemsets whose occurrence exceeds a minimum support threshold, and generates association rules with confidence above a minimum confidence level. The Apriori algorithm is commonly used for association rule mining. It works in multiple passes over the dataset, identifying frequent itemsets at each pass and pruning the search space by removing itemsets whose subsets were not frequent. An example application finds rules for items commonly purchased together based on transaction records, such as customers that buy milk and bread also frequently buy butter.
Data preprocessing techniques are applied before mining. These can improve the overall quality of the patterns mined and the time required for the actual mining.
Some important data preprocessing that must be needed before applying the data mining algorithm to any data sets are completely described in these slides.
A decision tree is a structure that includes a root node, branches, and leaf nodes. Each internal node denotes a test on an attribute, each branch denotes the outcome of a test, and each leaf node holds a class label. The document then provides an example of how to generate a decision tree from a dataset by calculating the information gain of different attributes to determine the optimal attribute to split the tree on at each node. It shows calculating the information gain, entropy, and gain for attributes A and B to determine that attribute B has the highest information gain and should be used to split the root node of the decision tree.
I don't know why this is not showing the slide no.7 .. don't worry.. you can also have it from this link: https://drive.google.com/file/d/1wWW_VxYfmdVdduz0J020wEM4VYmMe9X2/view?usp=sharing
The Internet of Things (IoT) is a system of interrelated computing devices, mechanical and digital machines, objects, animals or people that are provided with unique identifiers (UIDs) and the ability to transfer data over a network without requiring human-to-human or human-to-computer interaction.
Hospital Introducer & Direction Giving Robot.Iffat Firozy
This document describes a proposed hospital introducer and direction giving robot. The robot would help patients and their families find their way around the hospital by providing directions to specific doctors' offices, testing departments, the pharmacy, blood bank, and other locations. It would answer questions about things like which doctor to see for a given health problem and the process for appointments or tests. This would solve common problems faced by those unfamiliar with the hospital's layout. The robot is intended to assist people efficiently using sensors and effectors while allowing automated reasoning about goals and states. Potential advantages include improved guidance, but disadvantages could include costs or efficiency limitations of the technology.
SGPA is the Sessional Grade Point Average calculated each semester by dividing the total grade points earned by the total credits for courses taken in that semester. CGPA is the Cumulative Grade Point Average calculated by dividing the total grade points earned over all semesters by the total credits taken over all semesters. The document provides examples of calculating SGPA for a semester where the student earned 38.25 grade points over 11 credits, yielding an SGPA of 3.48. It also provides an example of calculating CGPA where the student earned a total of 161.64 grade points over 48 credits over 4 semesters, yielding a CGPA of 3.37.
Temple of Asclepius in Thrace. Excavation resultsKrassimira Luka
The temple and the sanctuary around were dedicated to Asklepios Zmidrenus. This name has been known since 1875 when an inscription dedicated to him was discovered in Rome. The inscription is dated in 227 AD and was left by soldiers originating from the city of Philippopolis (modern Plovdiv).
A Visual Guide to 1 Samuel | A Tale of Two HeartsSteve Thomason
These slides walk through the story of 1 Samuel. Samuel is the last judge of Israel. The people reject God and want a king. Saul is anointed as the first king, but he is not a good king. David, the shepherd boy is anointed and Saul is envious of him. David shows honor while Saul continues to self destruct.
This presentation was provided by Rebecca Benner, Ph.D., of the American Society of Anesthesiologists, for the second session of NISO's 2024 Training Series "DEIA in the Scholarly Landscape." Session Two: 'Expanding Pathways to Publishing Careers,' was held June 13, 2024.
Beyond Degrees - Empowering the Workforce in the Context of Skills-First.pptxEduSkills OECD
Iván Bornacelly, Policy Analyst at the OECD Centre for Skills, OECD, presents at the webinar 'Tackling job market gaps with a skills-first approach' on 12 June 2024
Chapter wise All Notes of First year Basic Civil Engineering.pptxDenish Jangid
Chapter wise All Notes of First year Basic Civil Engineering
Syllabus
Chapter-1
Introduction to objective, scope and outcome the subject
Chapter 2
Introduction: Scope and Specialization of Civil Engineering, Role of civil Engineer in Society, Impact of infrastructural development on economy of country.
Chapter 3
Surveying: Object Principles & Types of Surveying; Site Plans, Plans & Maps; Scales & Unit of different Measurements.
Linear Measurements: Instruments used. Linear Measurement by Tape, Ranging out Survey Lines and overcoming Obstructions; Measurements on sloping ground; Tape corrections, conventional symbols. Angular Measurements: Instruments used; Introduction to Compass Surveying, Bearings and Longitude & Latitude of a Line, Introduction to total station.
Levelling: Instrument used Object of levelling, Methods of levelling in brief, and Contour maps.
Chapter 4
Buildings: Selection of site for Buildings, Layout of Building Plan, Types of buildings, Plinth area, carpet area, floor space index, Introduction to building byelaws, concept of sun light & ventilation. Components of Buildings & their functions, Basic concept of R.C.C., Introduction to types of foundation
Chapter 5
Transportation: Introduction to Transportation Engineering; Traffic and Road Safety: Types and Characteristics of Various Modes of Transportation; Various Road Traffic Signs, Causes of Accidents and Road Safety Measures.
Chapter 6
Environmental Engineering: Environmental Pollution, Environmental Acts and Regulations, Functional Concepts of Ecology, Basics of Species, Biodiversity, Ecosystem, Hydrological Cycle; Chemical Cycles: Carbon, Nitrogen & Phosphorus; Energy Flow in Ecosystems.
Water Pollution: Water Quality standards, Introduction to Treatment & Disposal of Waste Water. Reuse and Saving of Water, Rain Water Harvesting. Solid Waste Management: Classification of Solid Waste, Collection, Transportation and Disposal of Solid. Recycling of Solid Waste: Energy Recovery, Sanitary Landfill, On-Site Sanitation. Air & Noise Pollution: Primary and Secondary air pollutants, Harmful effects of Air Pollution, Control of Air Pollution. . Noise Pollution Harmful Effects of noise pollution, control of noise pollution, Global warming & Climate Change, Ozone depletion, Greenhouse effect
Text Books:
1. Palancharmy, Basic Civil Engineering, McGraw Hill publishers.
2. Satheesh Gopi, Basic Civil Engineering, Pearson Publishers.
3. Ketki Rangwala Dalal, Essentials of Civil Engineering, Charotar Publishing House.
4. BCP, Surveying volume 1
Level 3 NCEA - NZ: A Nation In the Making 1872 - 1900 SML.pptHenry Hollis
The History of NZ 1870-1900.
Making of a Nation.
From the NZ Wars to Liberals,
Richard Seddon, George Grey,
Social Laboratory, New Zealand,
Confiscations, Kotahitanga, Kingitanga, Parliament, Suffrage, Repudiation, Economic Change, Agriculture, Gold Mining, Timber, Flax, Sheep, Dairying,
This presentation was provided by Racquel Jemison, Ph.D., Christina MacLaughlin, Ph.D., and Paulomi Majumder. Ph.D., all of the American Chemical Society, for the second session of NISO's 2024 Training Series "DEIA in the Scholarly Landscape." Session Two: 'Expanding Pathways to Publishing Careers,' was held June 13, 2024.
The chapter Lifelines of National Economy in Class 10 Geography focuses on the various modes of transportation and communication that play a vital role in the economic development of a country. These lifelines are crucial for the movement of goods, services, and people, thereby connecting different regions and promoting economic activities.
3. “
We are given a data set of items, with certain features, and
values for these features (like a vector). The task is to
categorize those items into groups. To achieve this, we will
use the kMeans algorithm; an unsupervised learning
algorithm.
3
4. The above algorithm in pseudocode:
◎ Specify number of clusters K.
◎ Initialize centroids by first shuffling the dataset and then randomly
selecting K data points for the centroids without replacement.
◎ Keep iterating until there is no change to the centroids. i.e
assignment of data points to clusters isn’t changing.
◎ Compute the sum of the squared distance between data points and
all centroids.
◎ Assign each data point to the closest cluster (centroid).
◎ Compute the centroids for the clusters by taking the average of the
all data points that belong to each cluster.
4
7. Problem on K-means clustering.
Given are the points A = (1,2), B = (2,2), C = (2, 1), D = (-1, 4), E = (-2, -
1), F = (-1,-1)
a) Starting from initial clusters Cluster1 = {A} which contains only the
point A and Cluster2 = {D} which contains only the point D, run the K-
means clustering algorithm and report the final clusters.
b) Draw the points on a 2-D grid and check if the clusters make
sense.
7
8. Initially:
8
X Y
A 1 2
B 2 2
C 2 1
D -1 4
E -2 -1
F -1 -1
CLUSTER X Y CENTROID ASSIGHNMENT
K1 1 2 1,2 1
K2 -1 4 -1,4 2
9. For row B:
Euclidean Distance: 𝑥 =
(𝑋𝑥 − 𝑥𝑖)2+(𝑋𝑦 − 𝑦𝑖)2
Here, K1 = (2 − 1)2+(2 − 2)2
=1
K2= (2 + 1)2+(2 − 4)2
=3.60
9
CLUSTER X Y CENTROID ASSIGHNMENT
K1 (1+2)/2 = 1.5 (2+2)/2= 2 1.5,2 1
K2 -1 4 -1,4
X Y
A 1 2
B 2 2
C 2 1
D -1 4
E -2 -1
F -1 -1
10. For row C:
Distance: 𝑥 =
(𝑋𝑥 − 𝑥𝑖)2+(𝑋𝑦 − 𝑦𝑖)2
Here, K1 = (2 − 1.5)2+(1 − 2)2
=1.11
K2= (2 + 1)2+(1 − 4)2
=4.24
10
CLUSTER X Y CENTROID ASSIGHNMENT
K1 (1.5+2)/2 = 1.75 (2+1)/2 = 1.5 1.75,1.5 1
K2 -1 4 -1,4
X Y
A 1 2
B 2 2
C 2 1
D -1 4
E -2 -1
F -1 -1
11. For row E:
Distance: 𝑥 =
(𝑋𝑥 − 𝑥𝑖)2+(𝑋𝑦 − 𝑦𝑖)2
Here, K1 =
(−2 − 1.75)2+(−1 − 1.5)2
=4.50
K2= (−2 + 1)2+(−1 − 4)2
=5.09
11
CLUSTER X Y CENTROID ASSIGHNMENT
K1 (1.75-2)/2 = -
0.125
(1.5-1)/2 = 0.25 -0.125, 0.25 1
K2 -1 4 -1,4
X Y
A 1 2
B 2 2
C 2 1
D -1 4
E -2 -1
F -1 -4
12. For row F:
Distance: 𝑥 =
(𝑋𝑥 − 𝑥𝑖)2+(𝑋𝑦 − 𝑦𝑖)2
Here, K1 =
(−1 + 0.125 )2+(−4 − .25)2
=4.33
K2= (−1 + 1)2+(−4 − 4)2
=5
12
CLUSTER X Y CENTROID ASSIGHNMENT
K1 (0.125-1)/2 = -.43 (.25-1)/2 = -.375 -.43, -1.85 1
K2 -1 4 -1,4
X Y
A 1 2
B 2 2
C 2 1
D -1 4
E -2 -1
F -1 -1
13. Final Clustering & Assignments:
13
X Y ASSIGNMENT
A 1 2 1
B 1.5 2 1
C 1.75 1.5 1
D -1 4 1
E .125 .25 1
F -..43 -.375 1