Downloaded 564 times
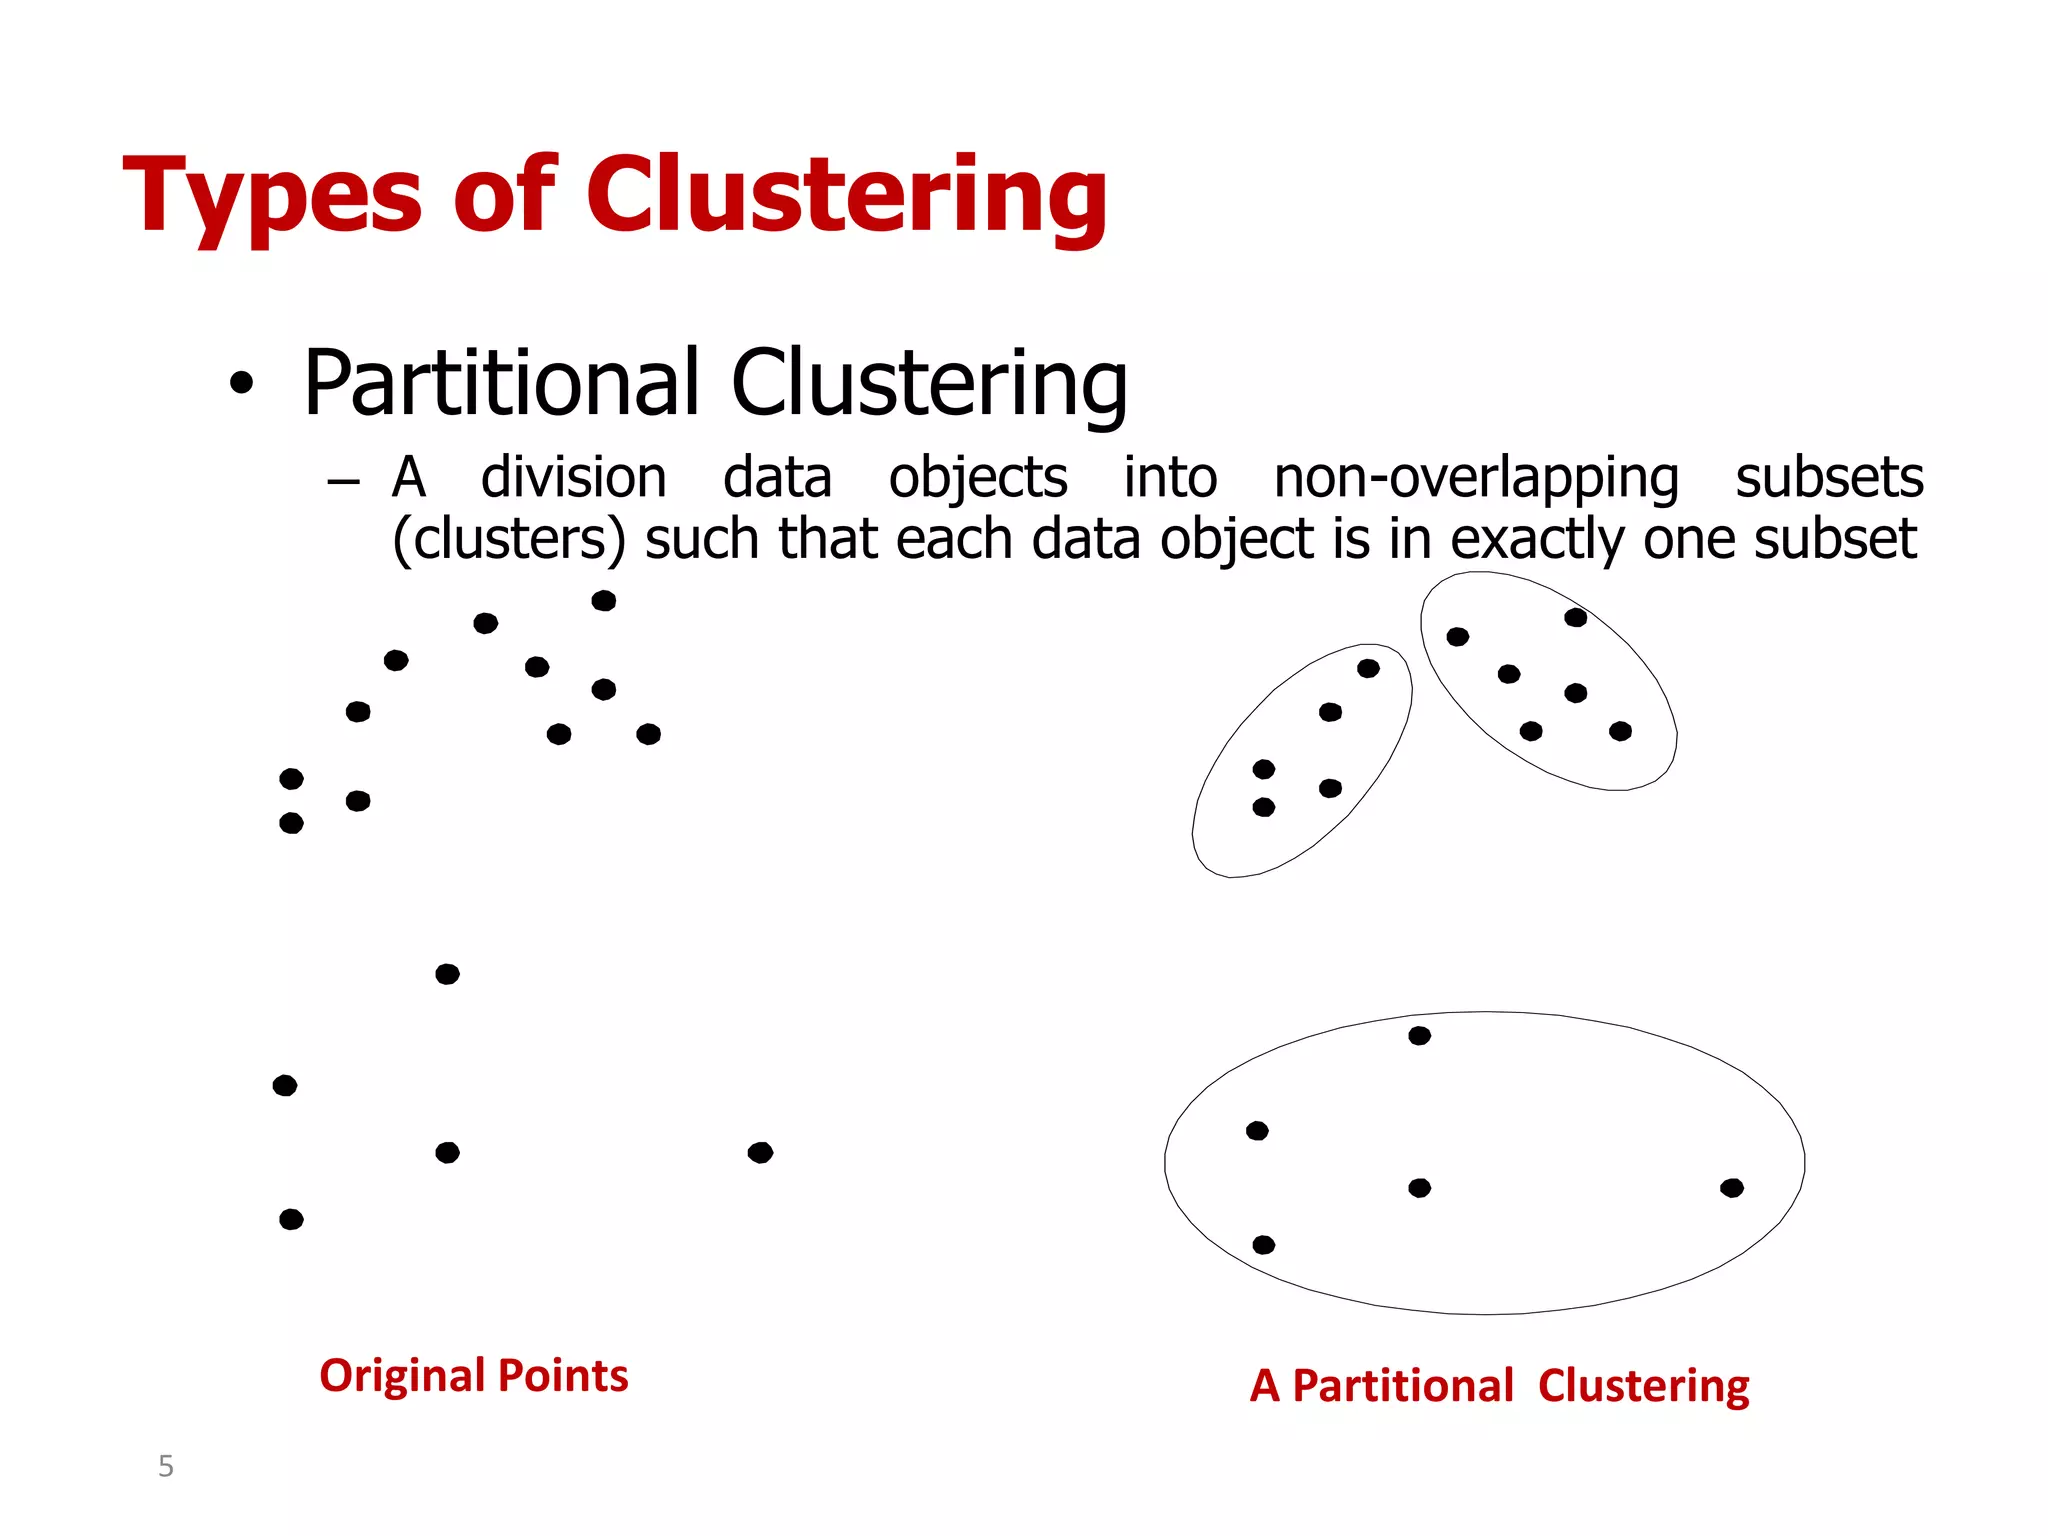
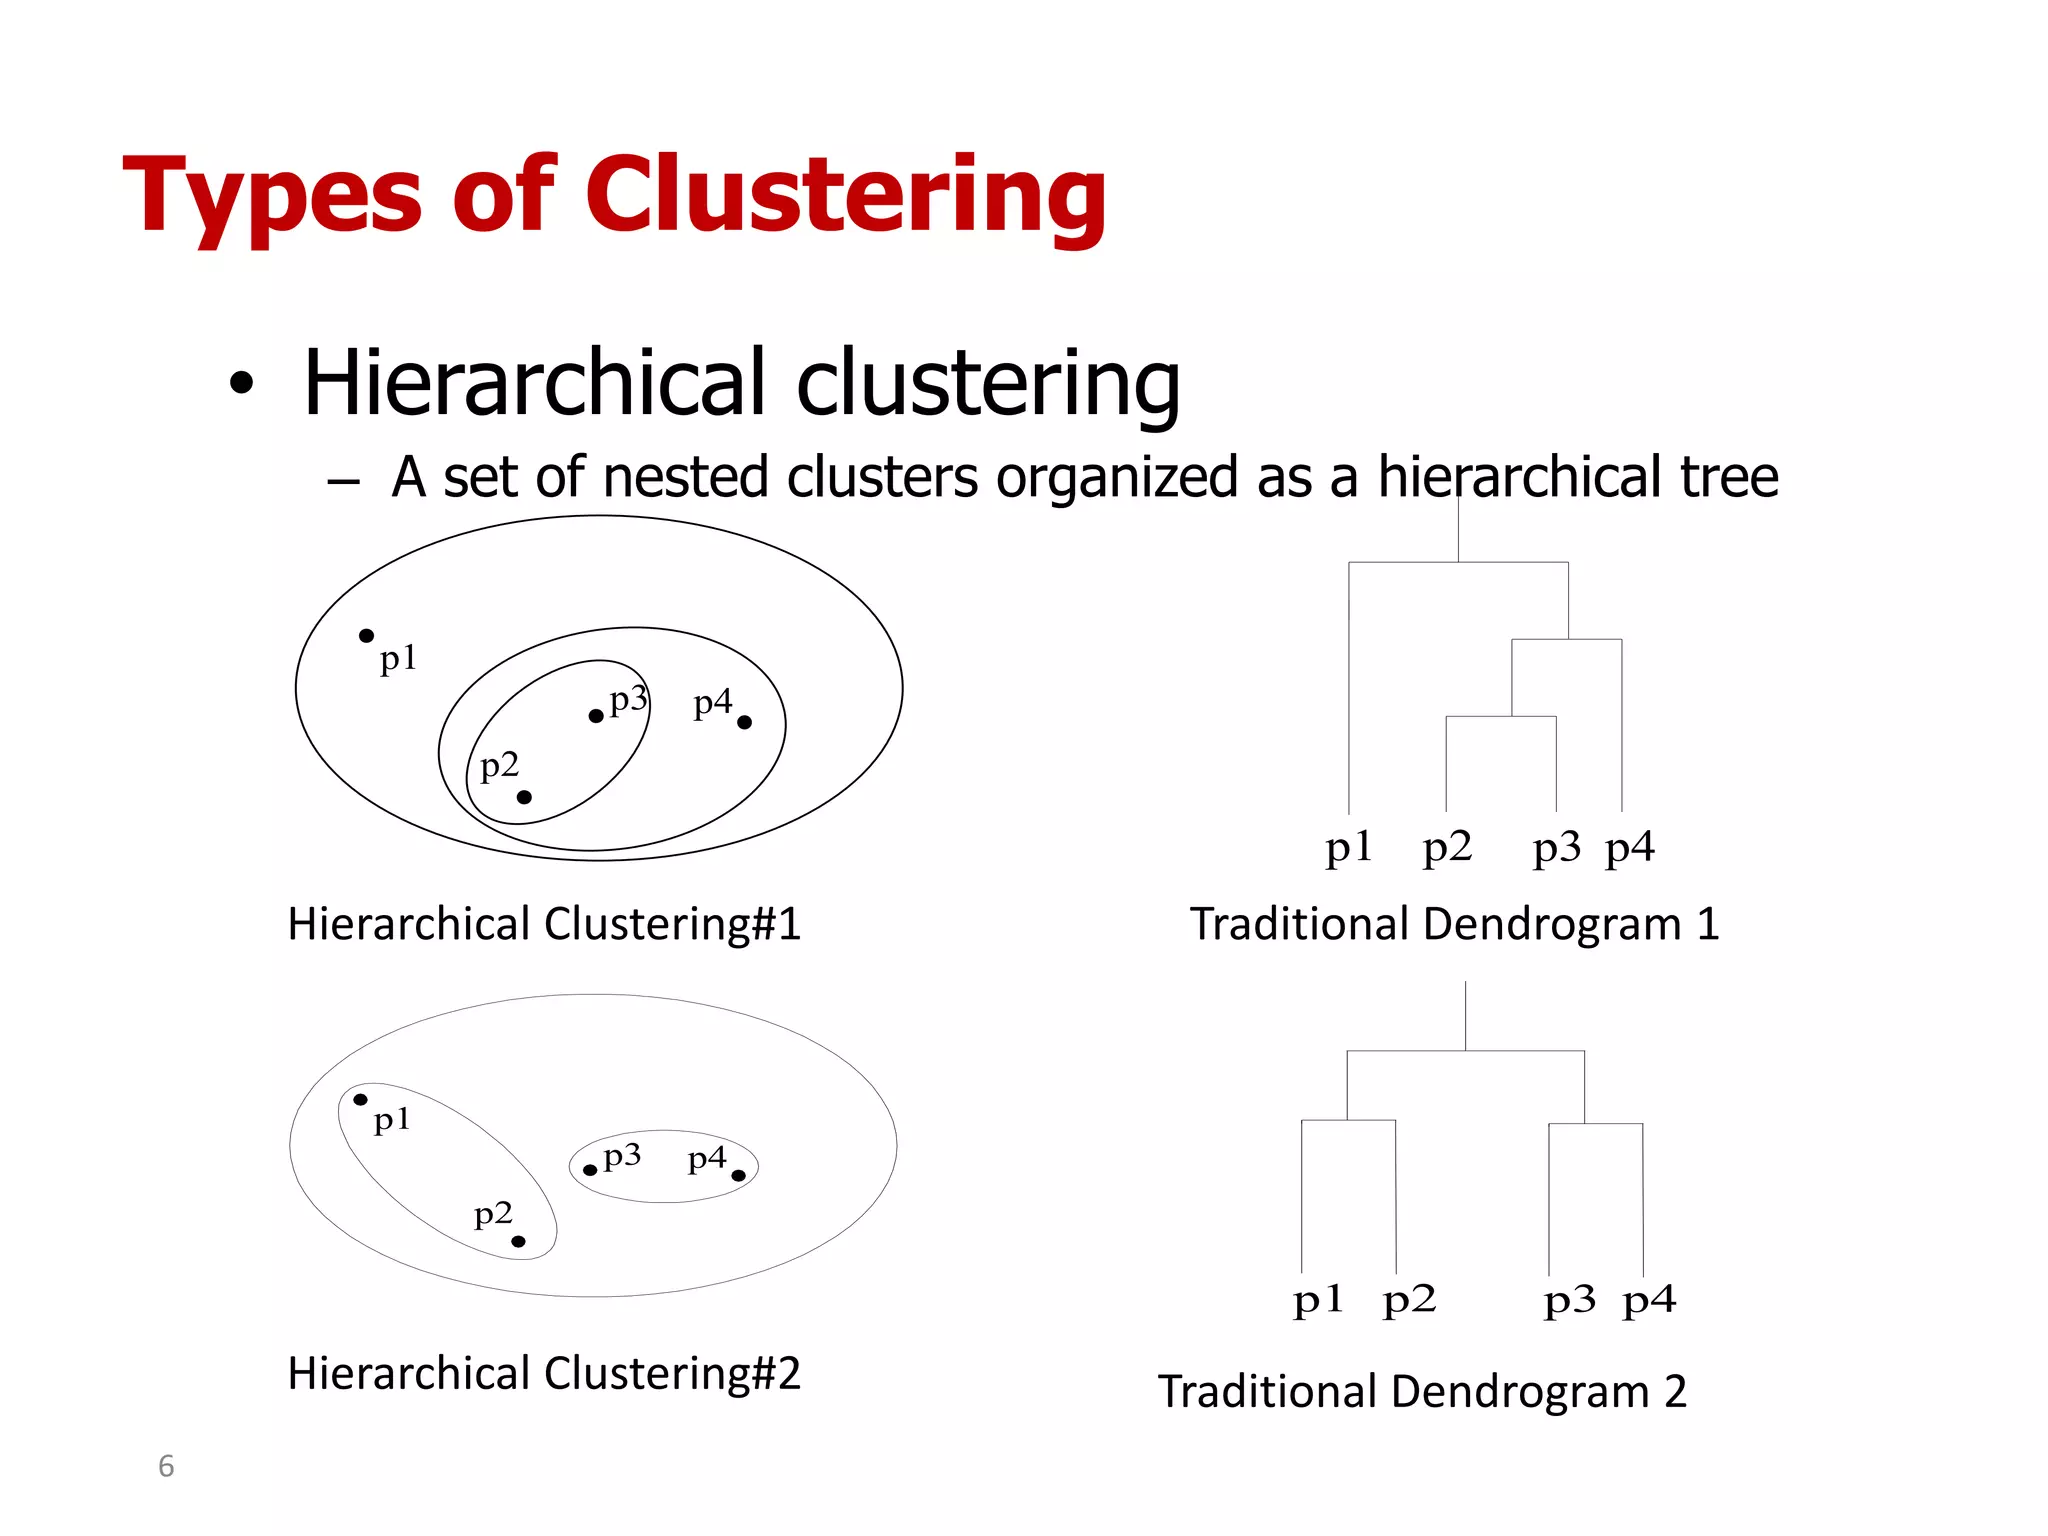
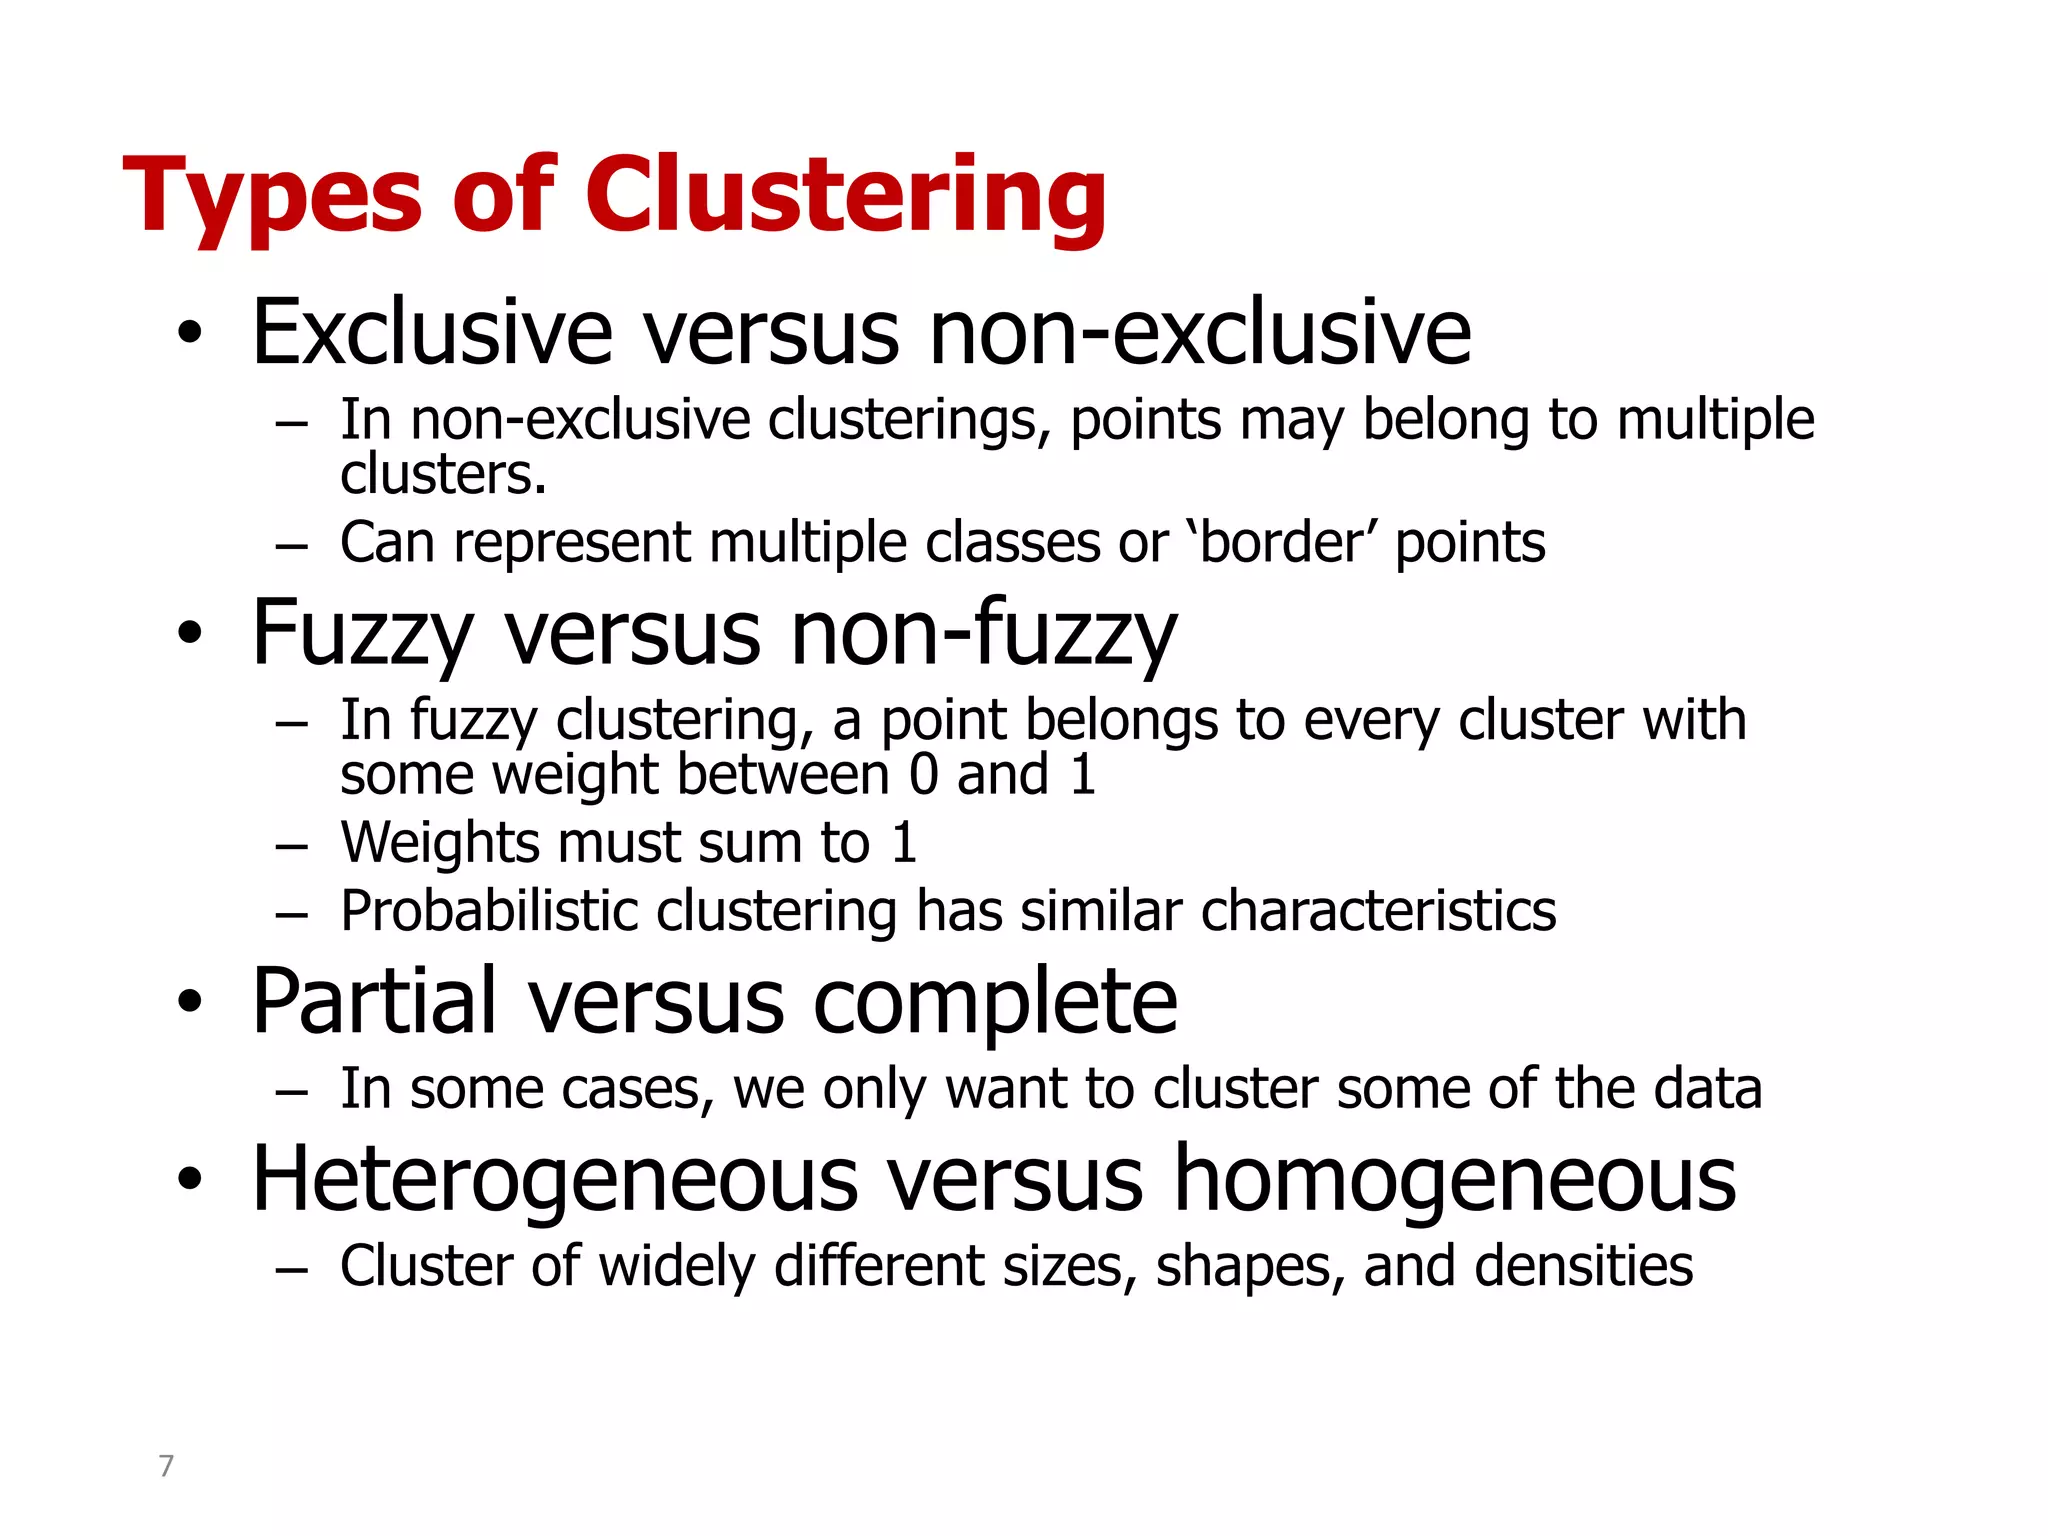

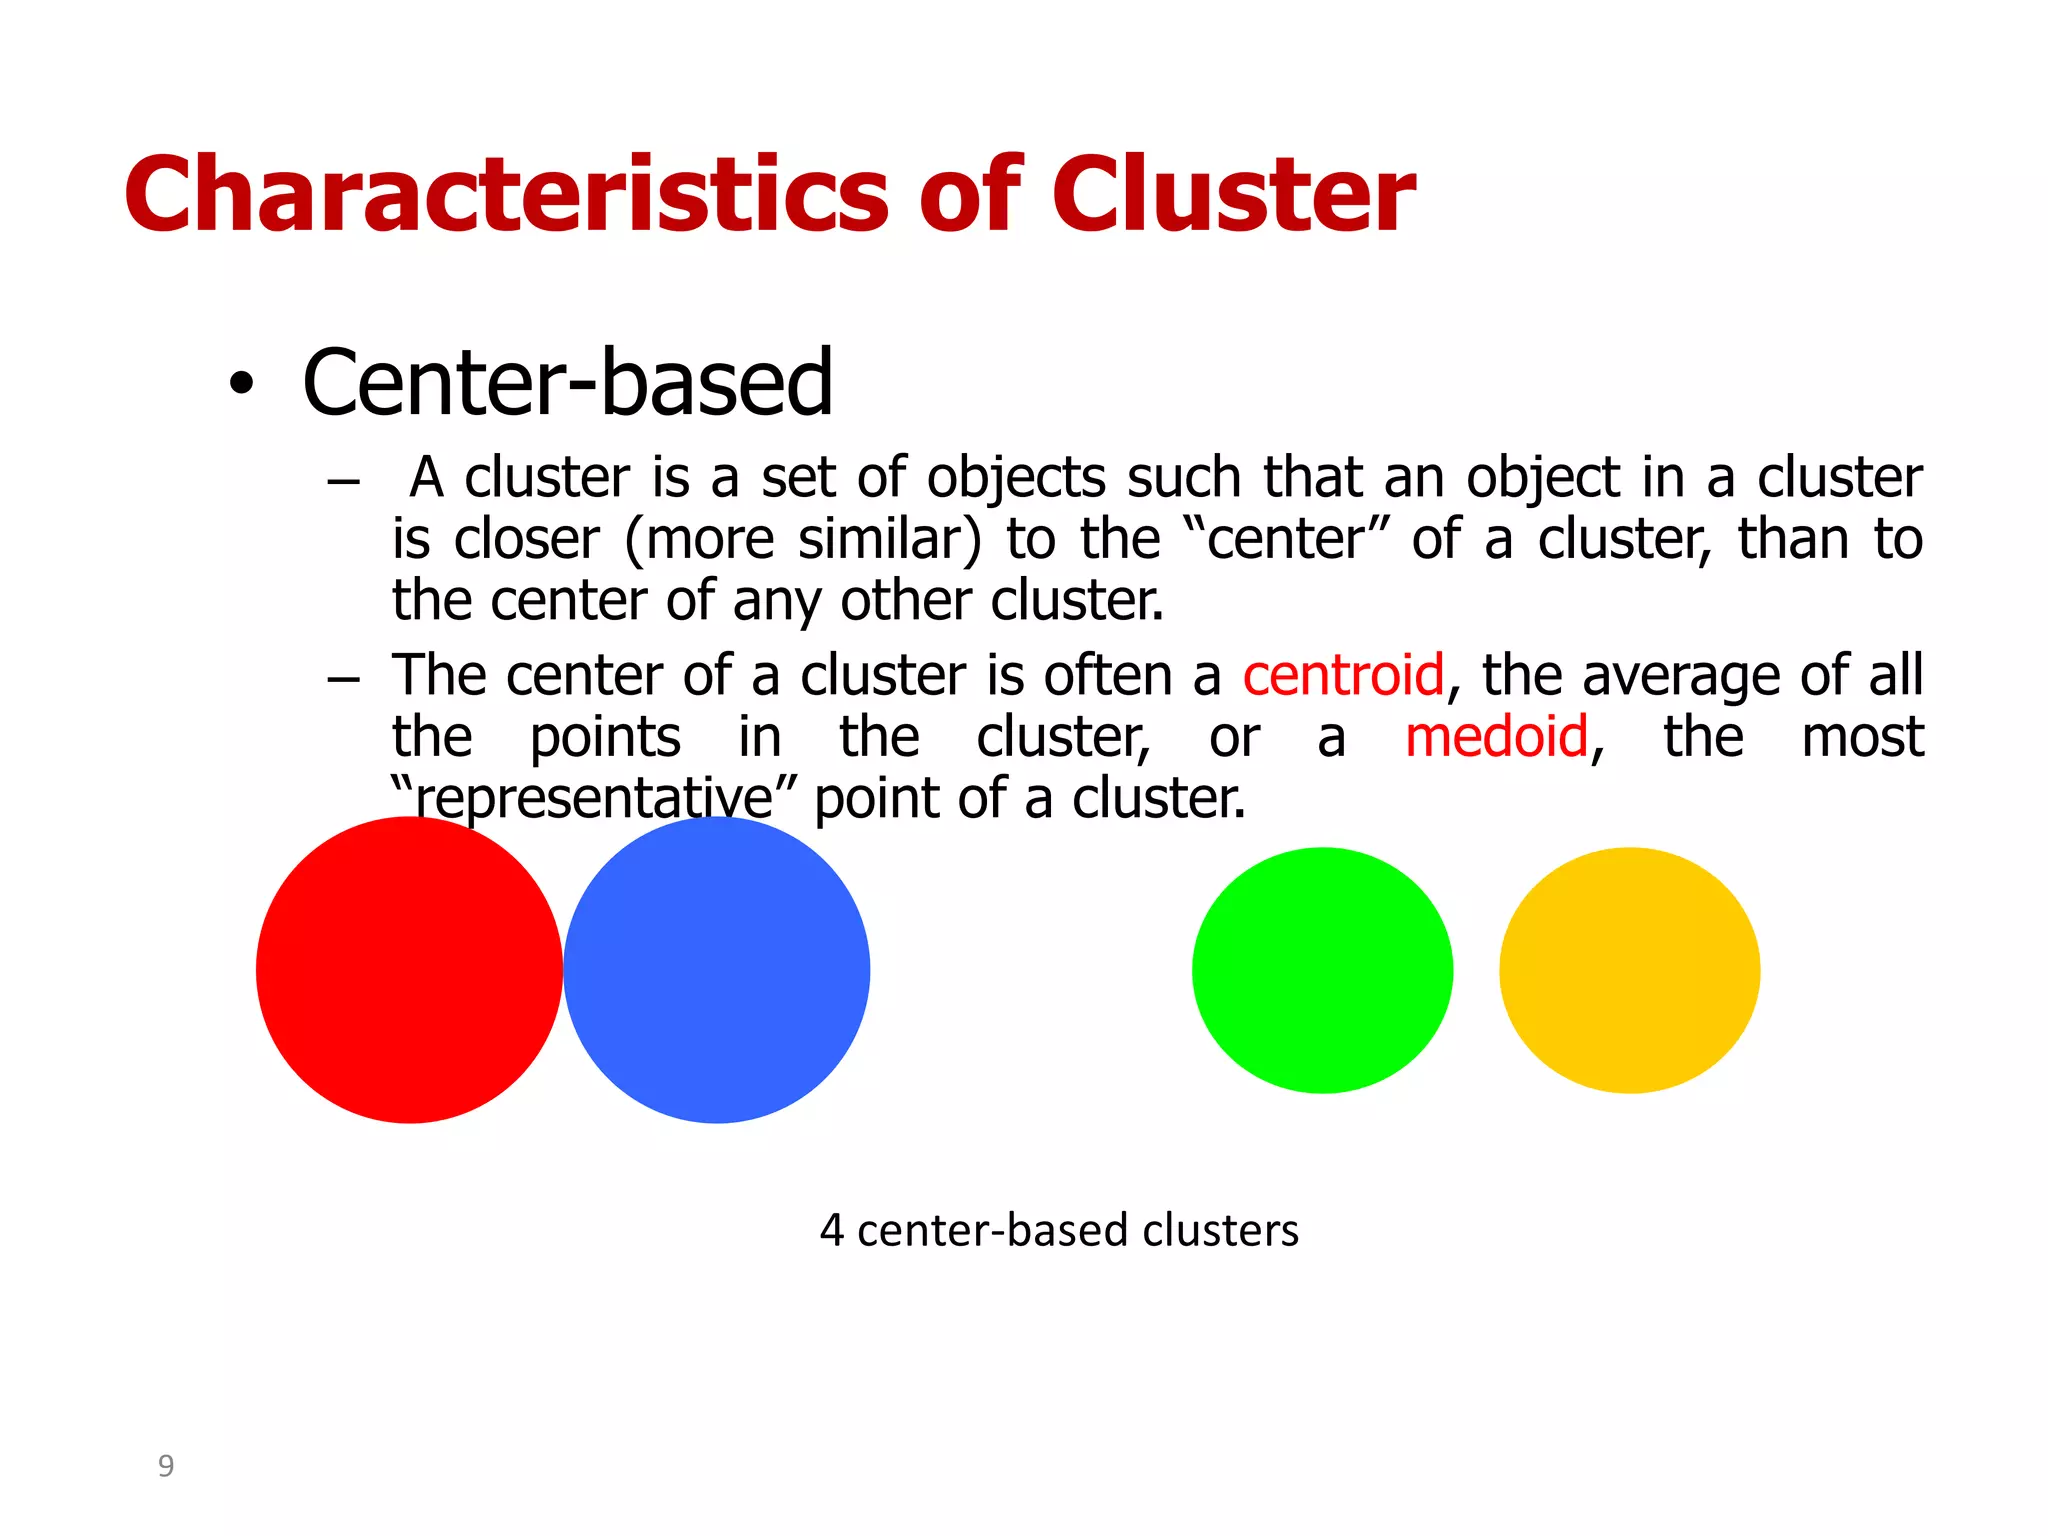
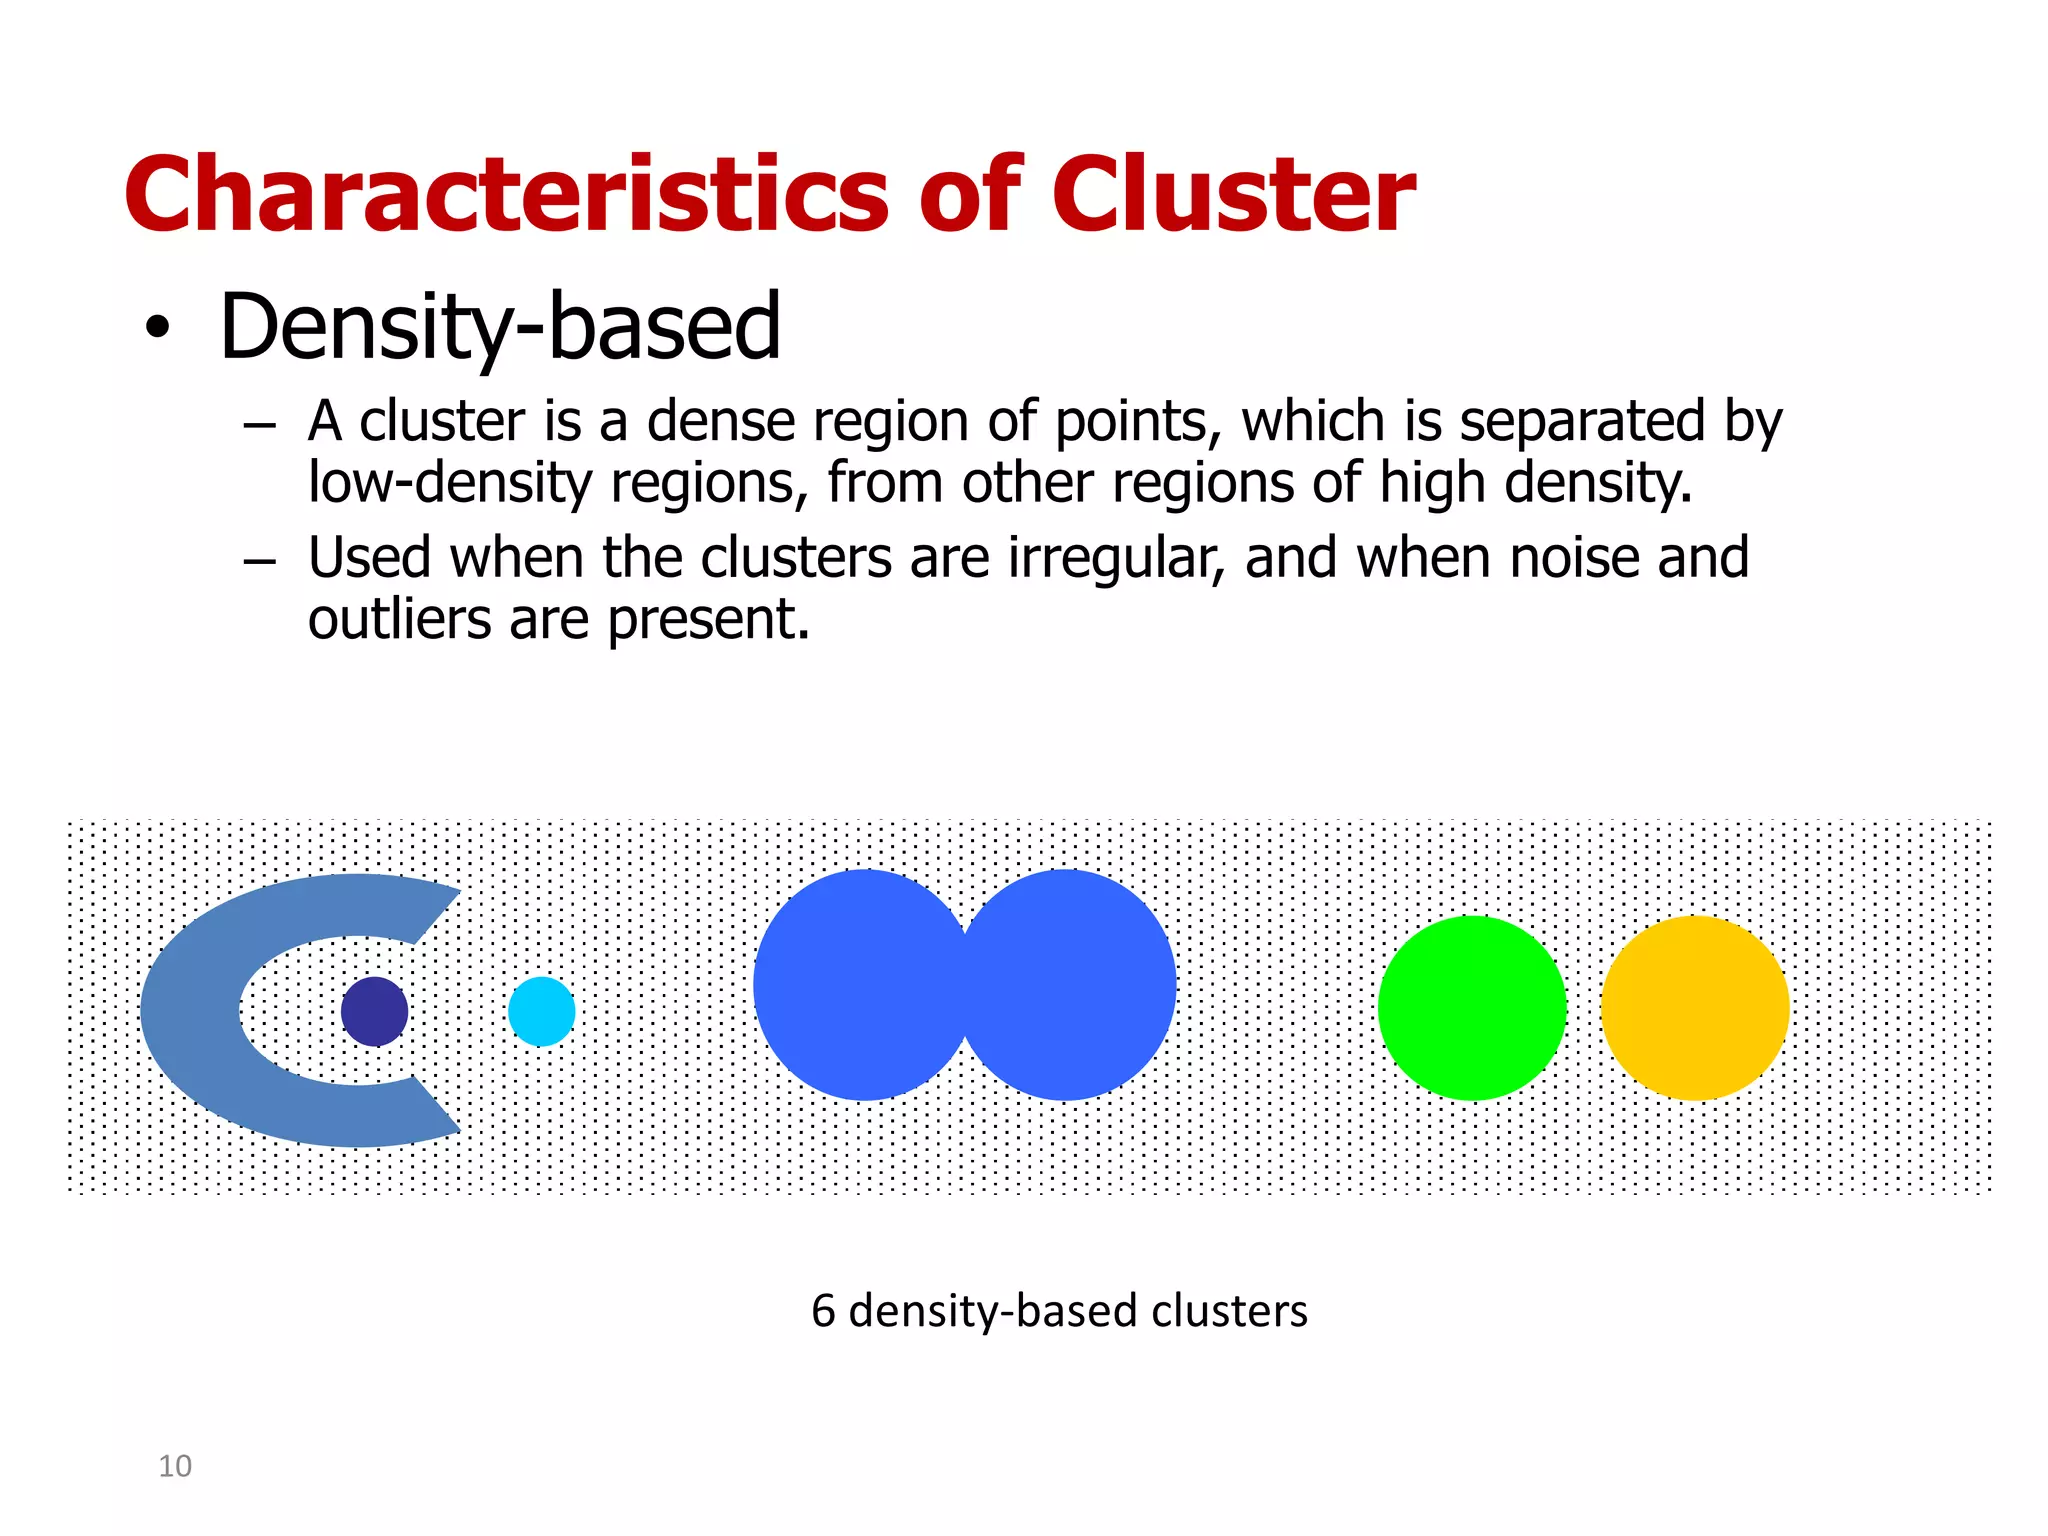
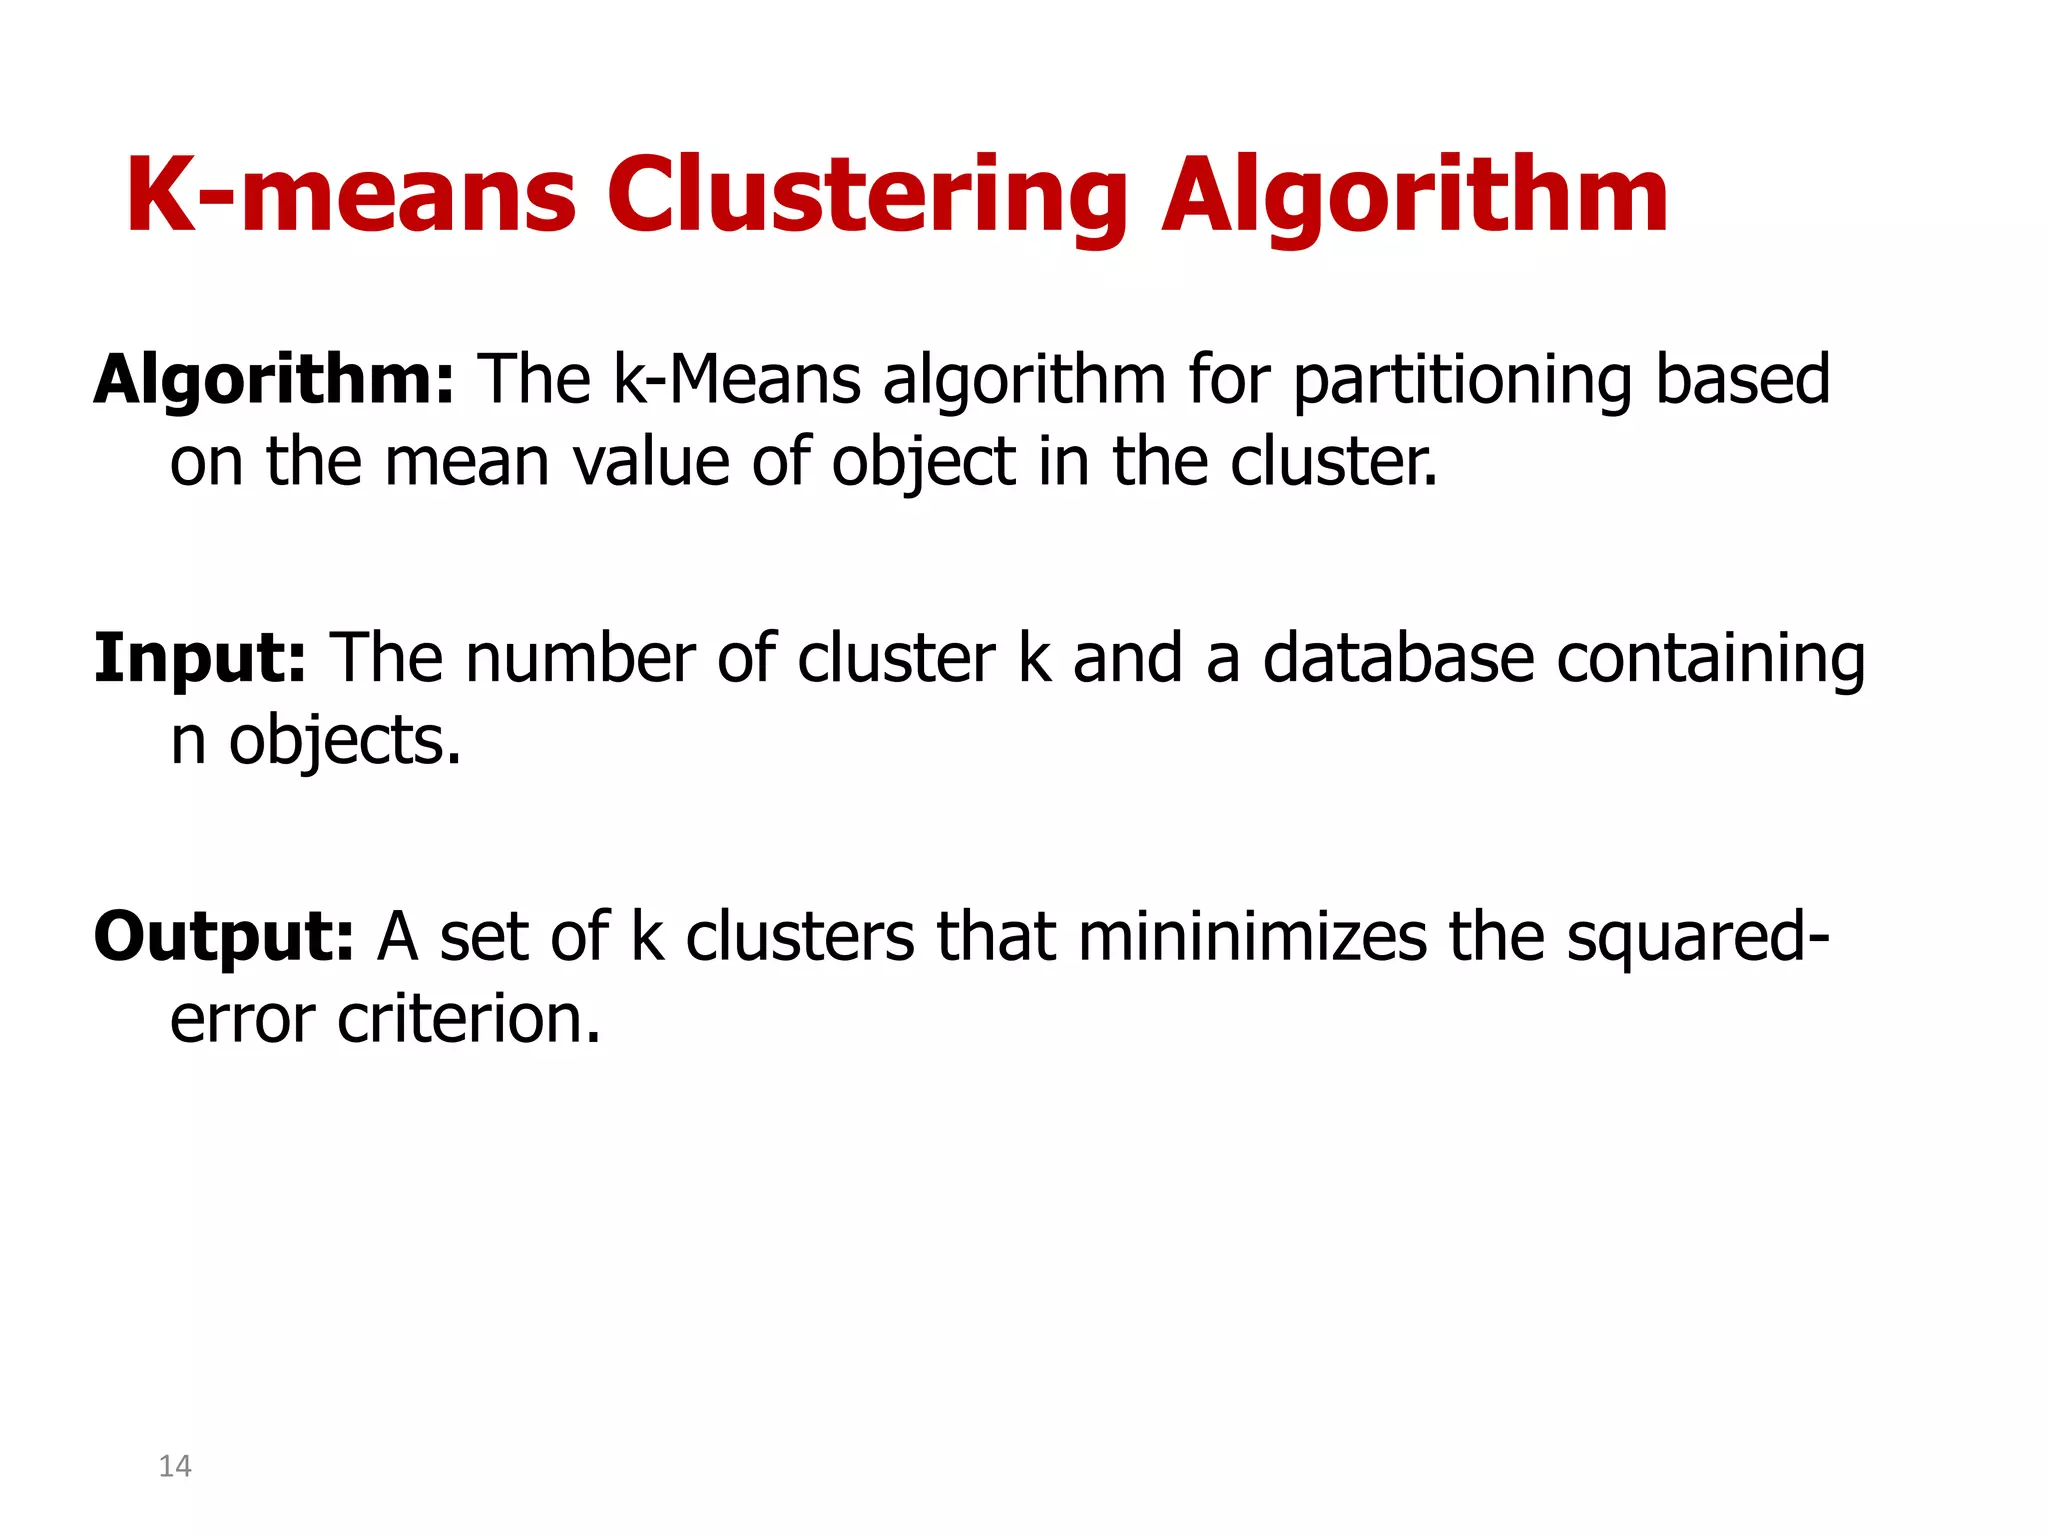
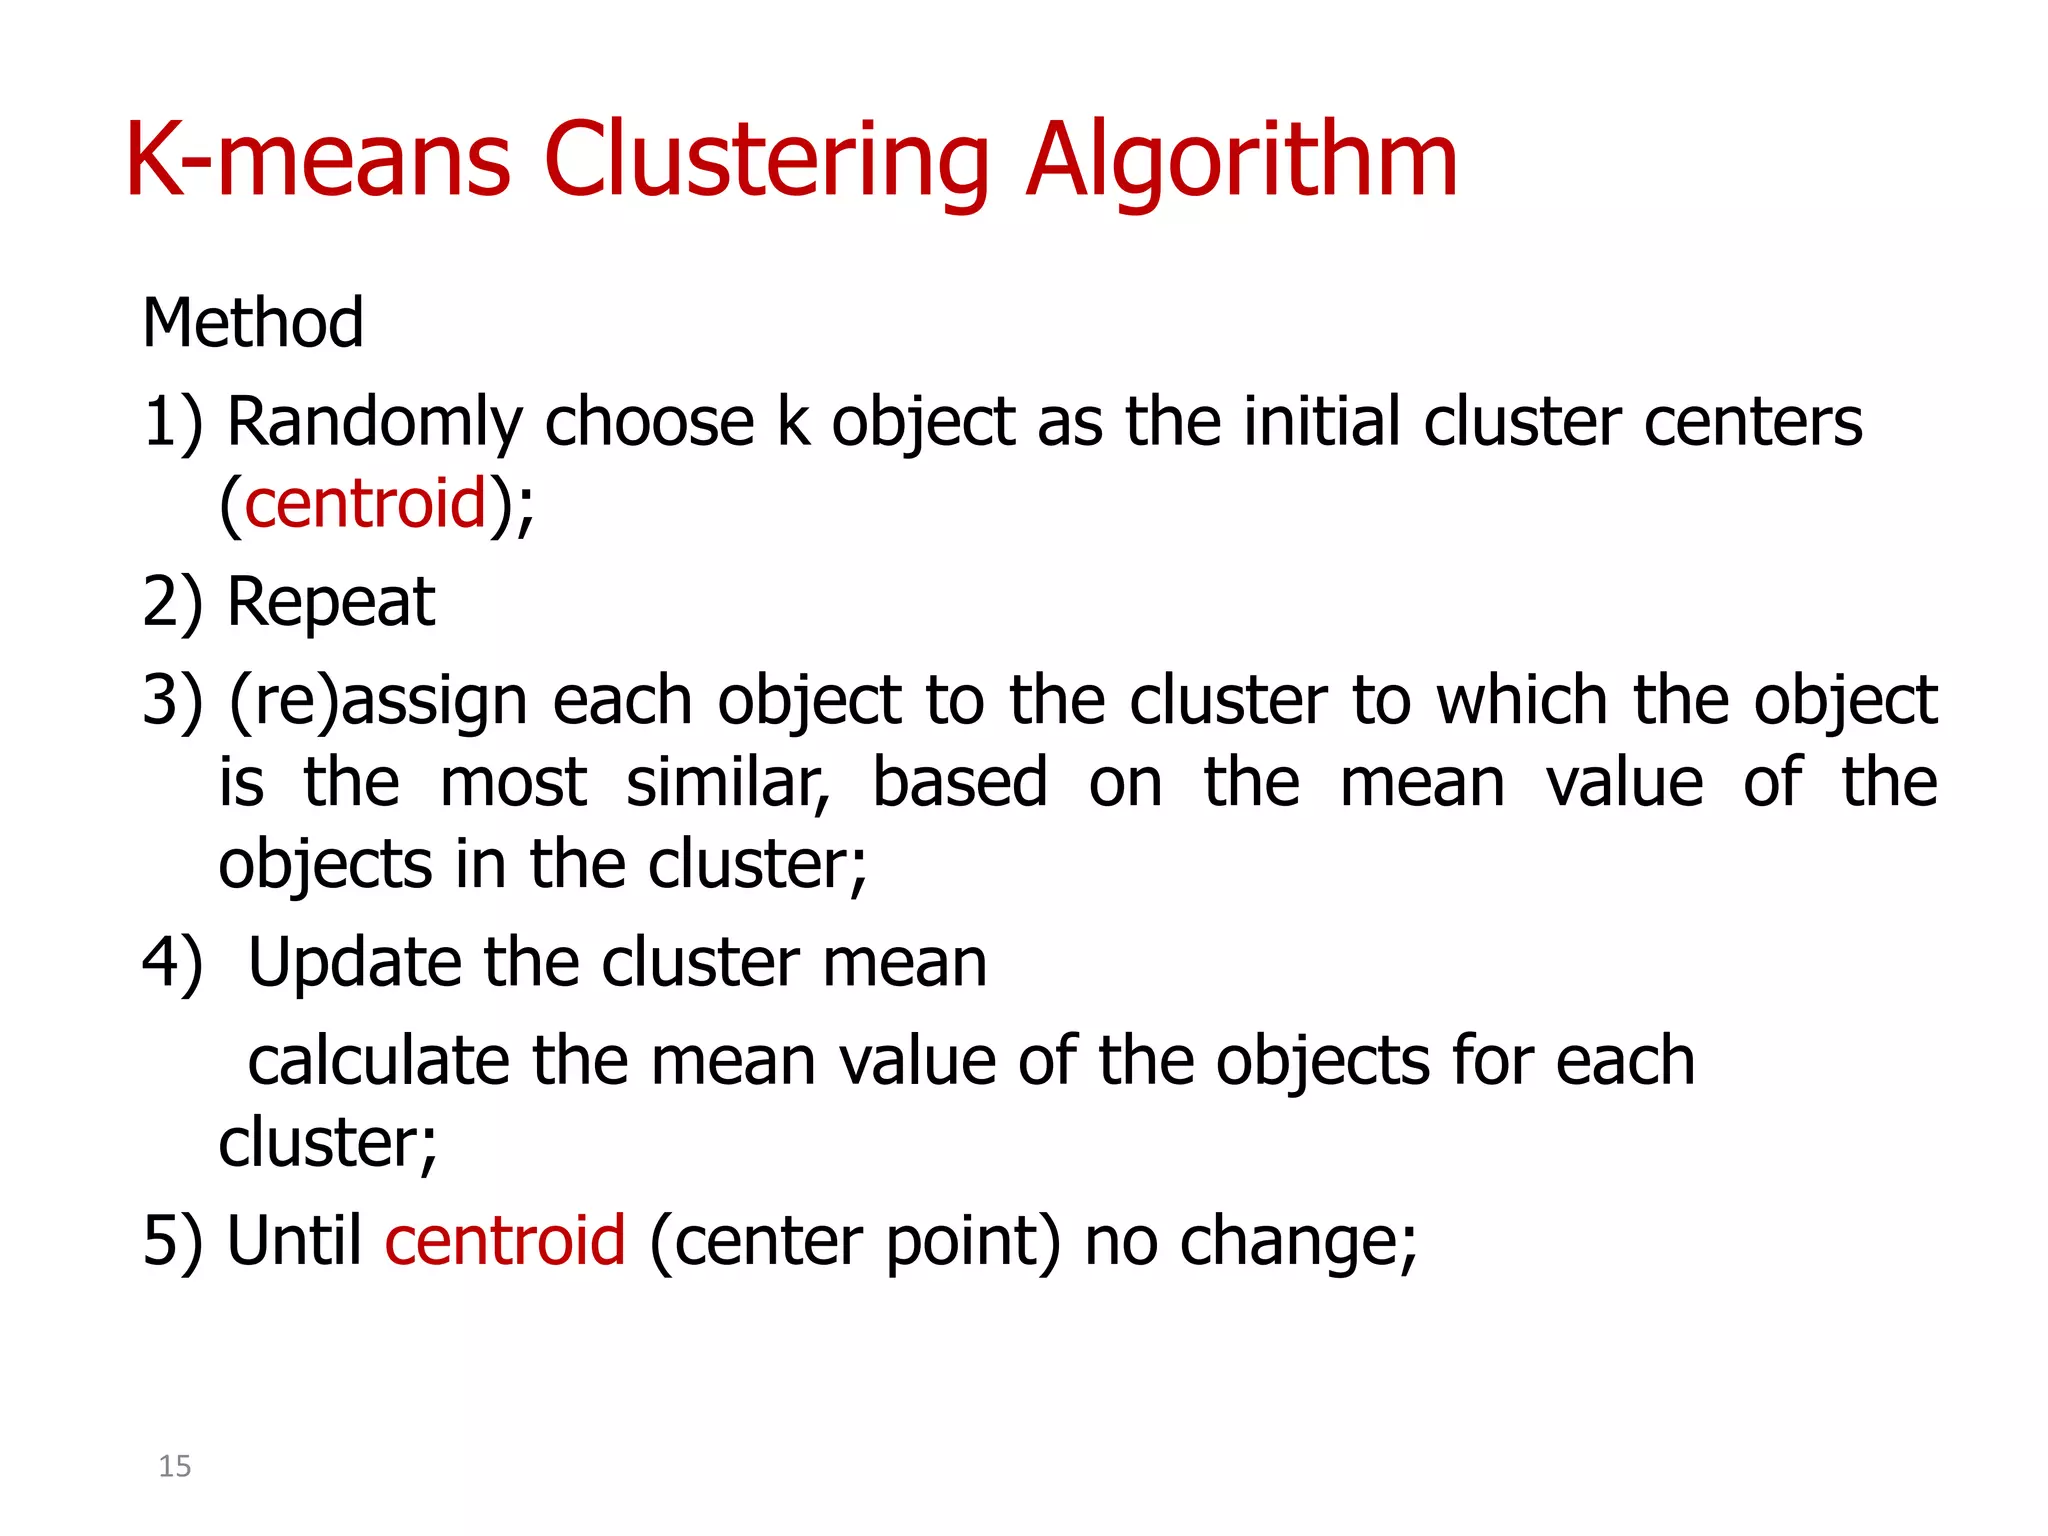
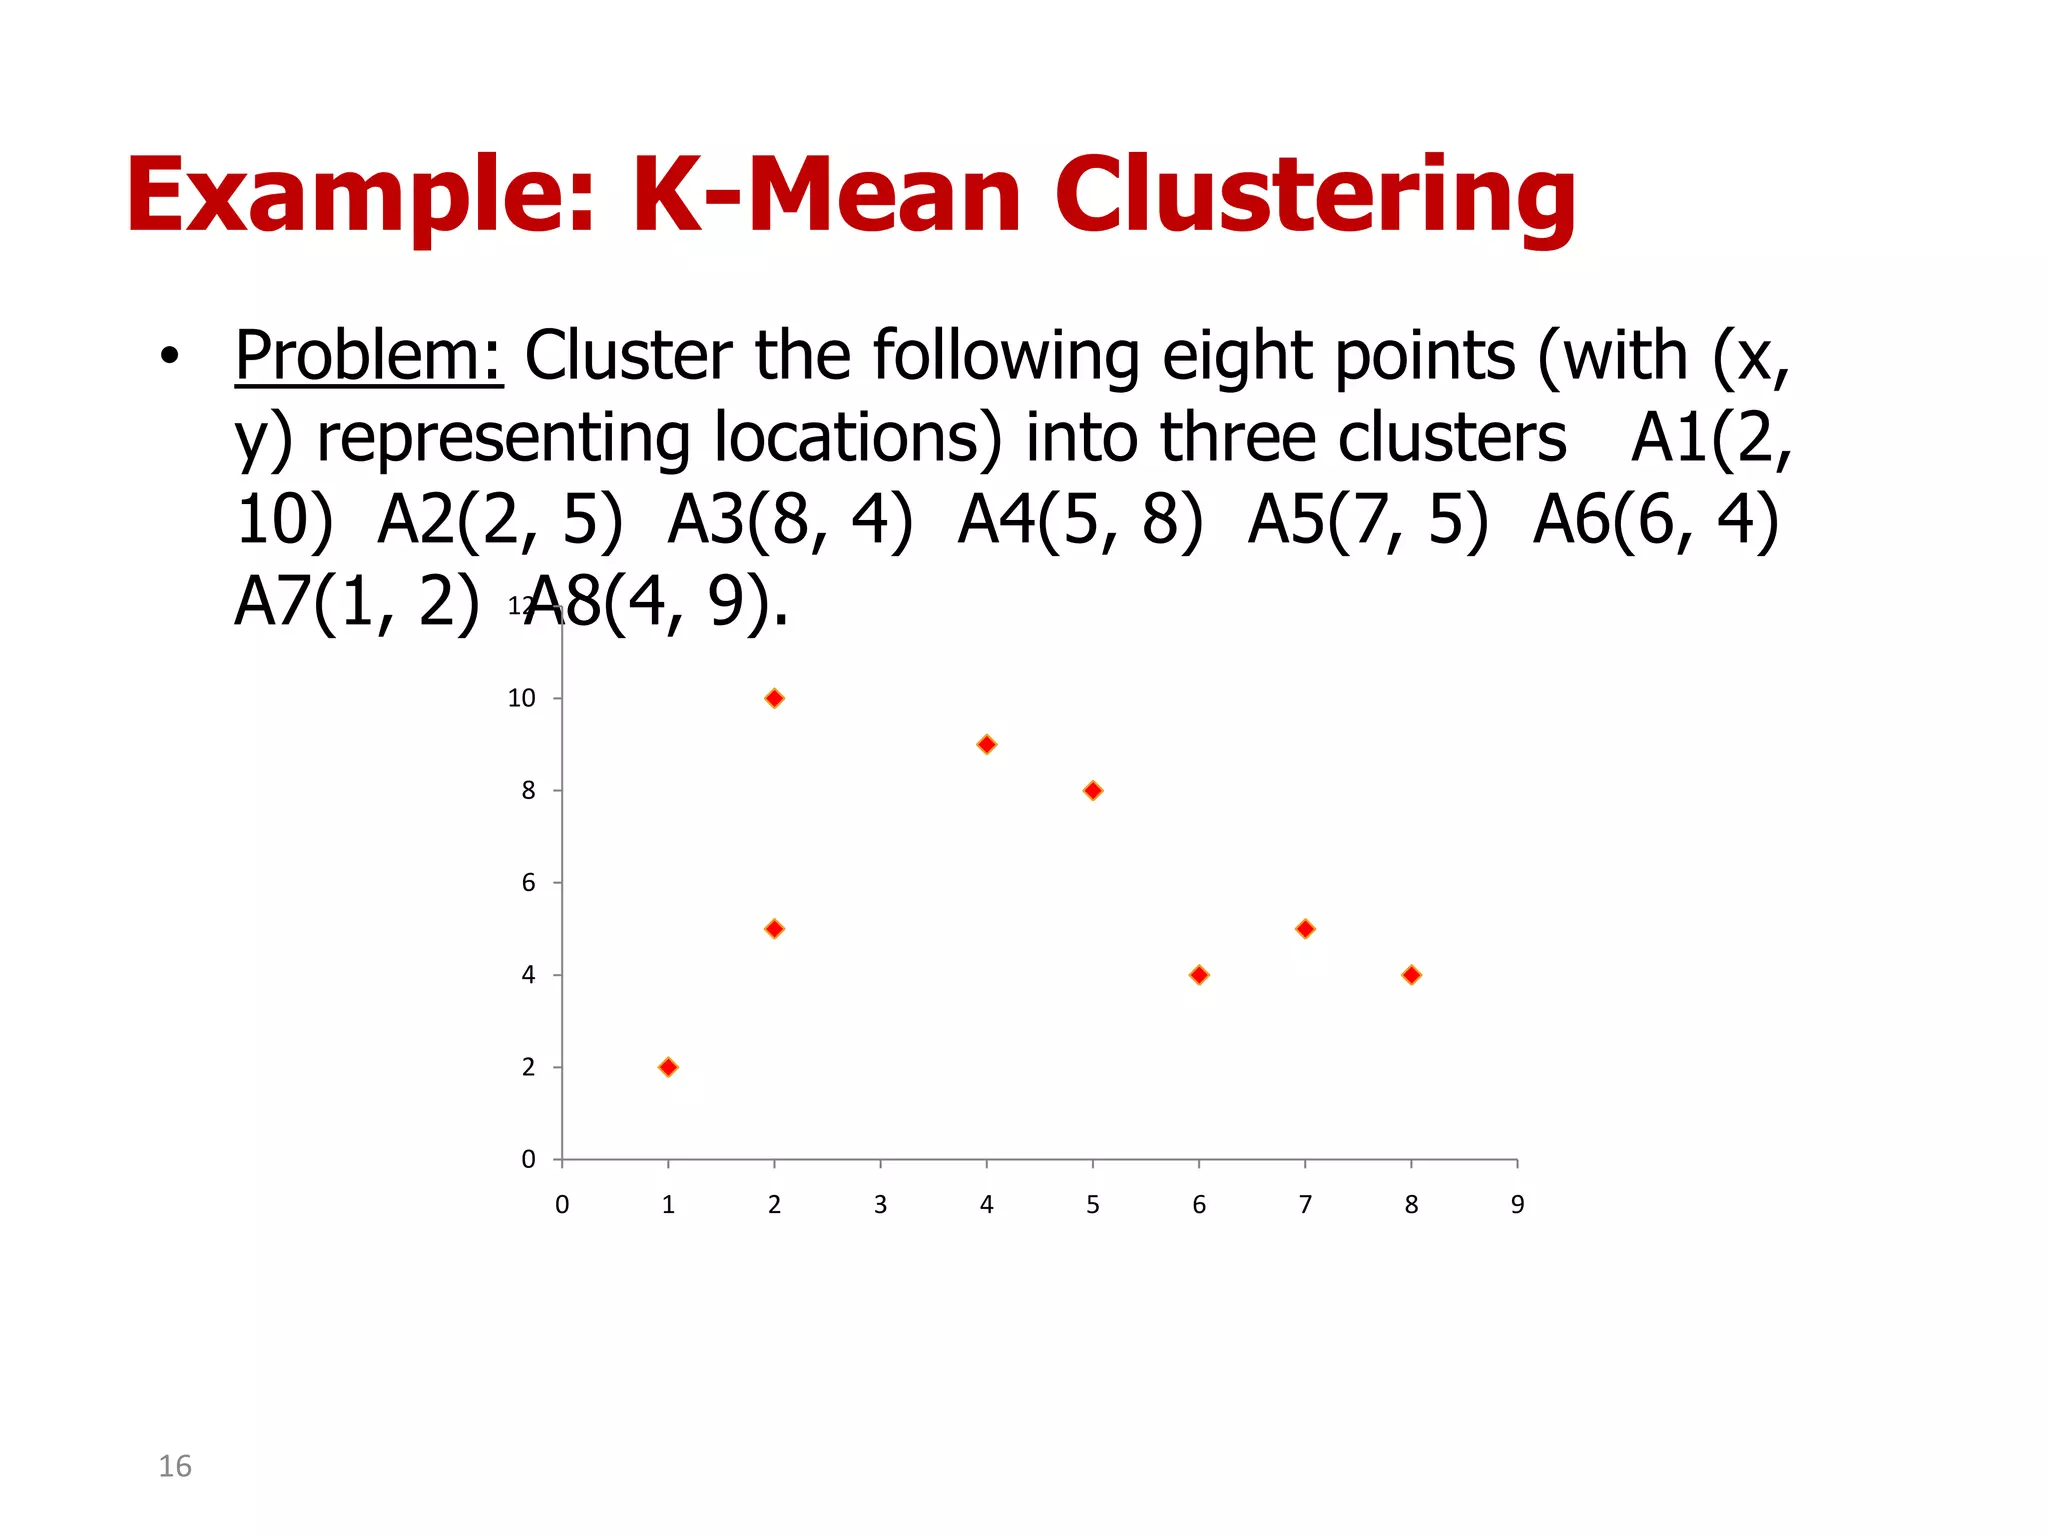
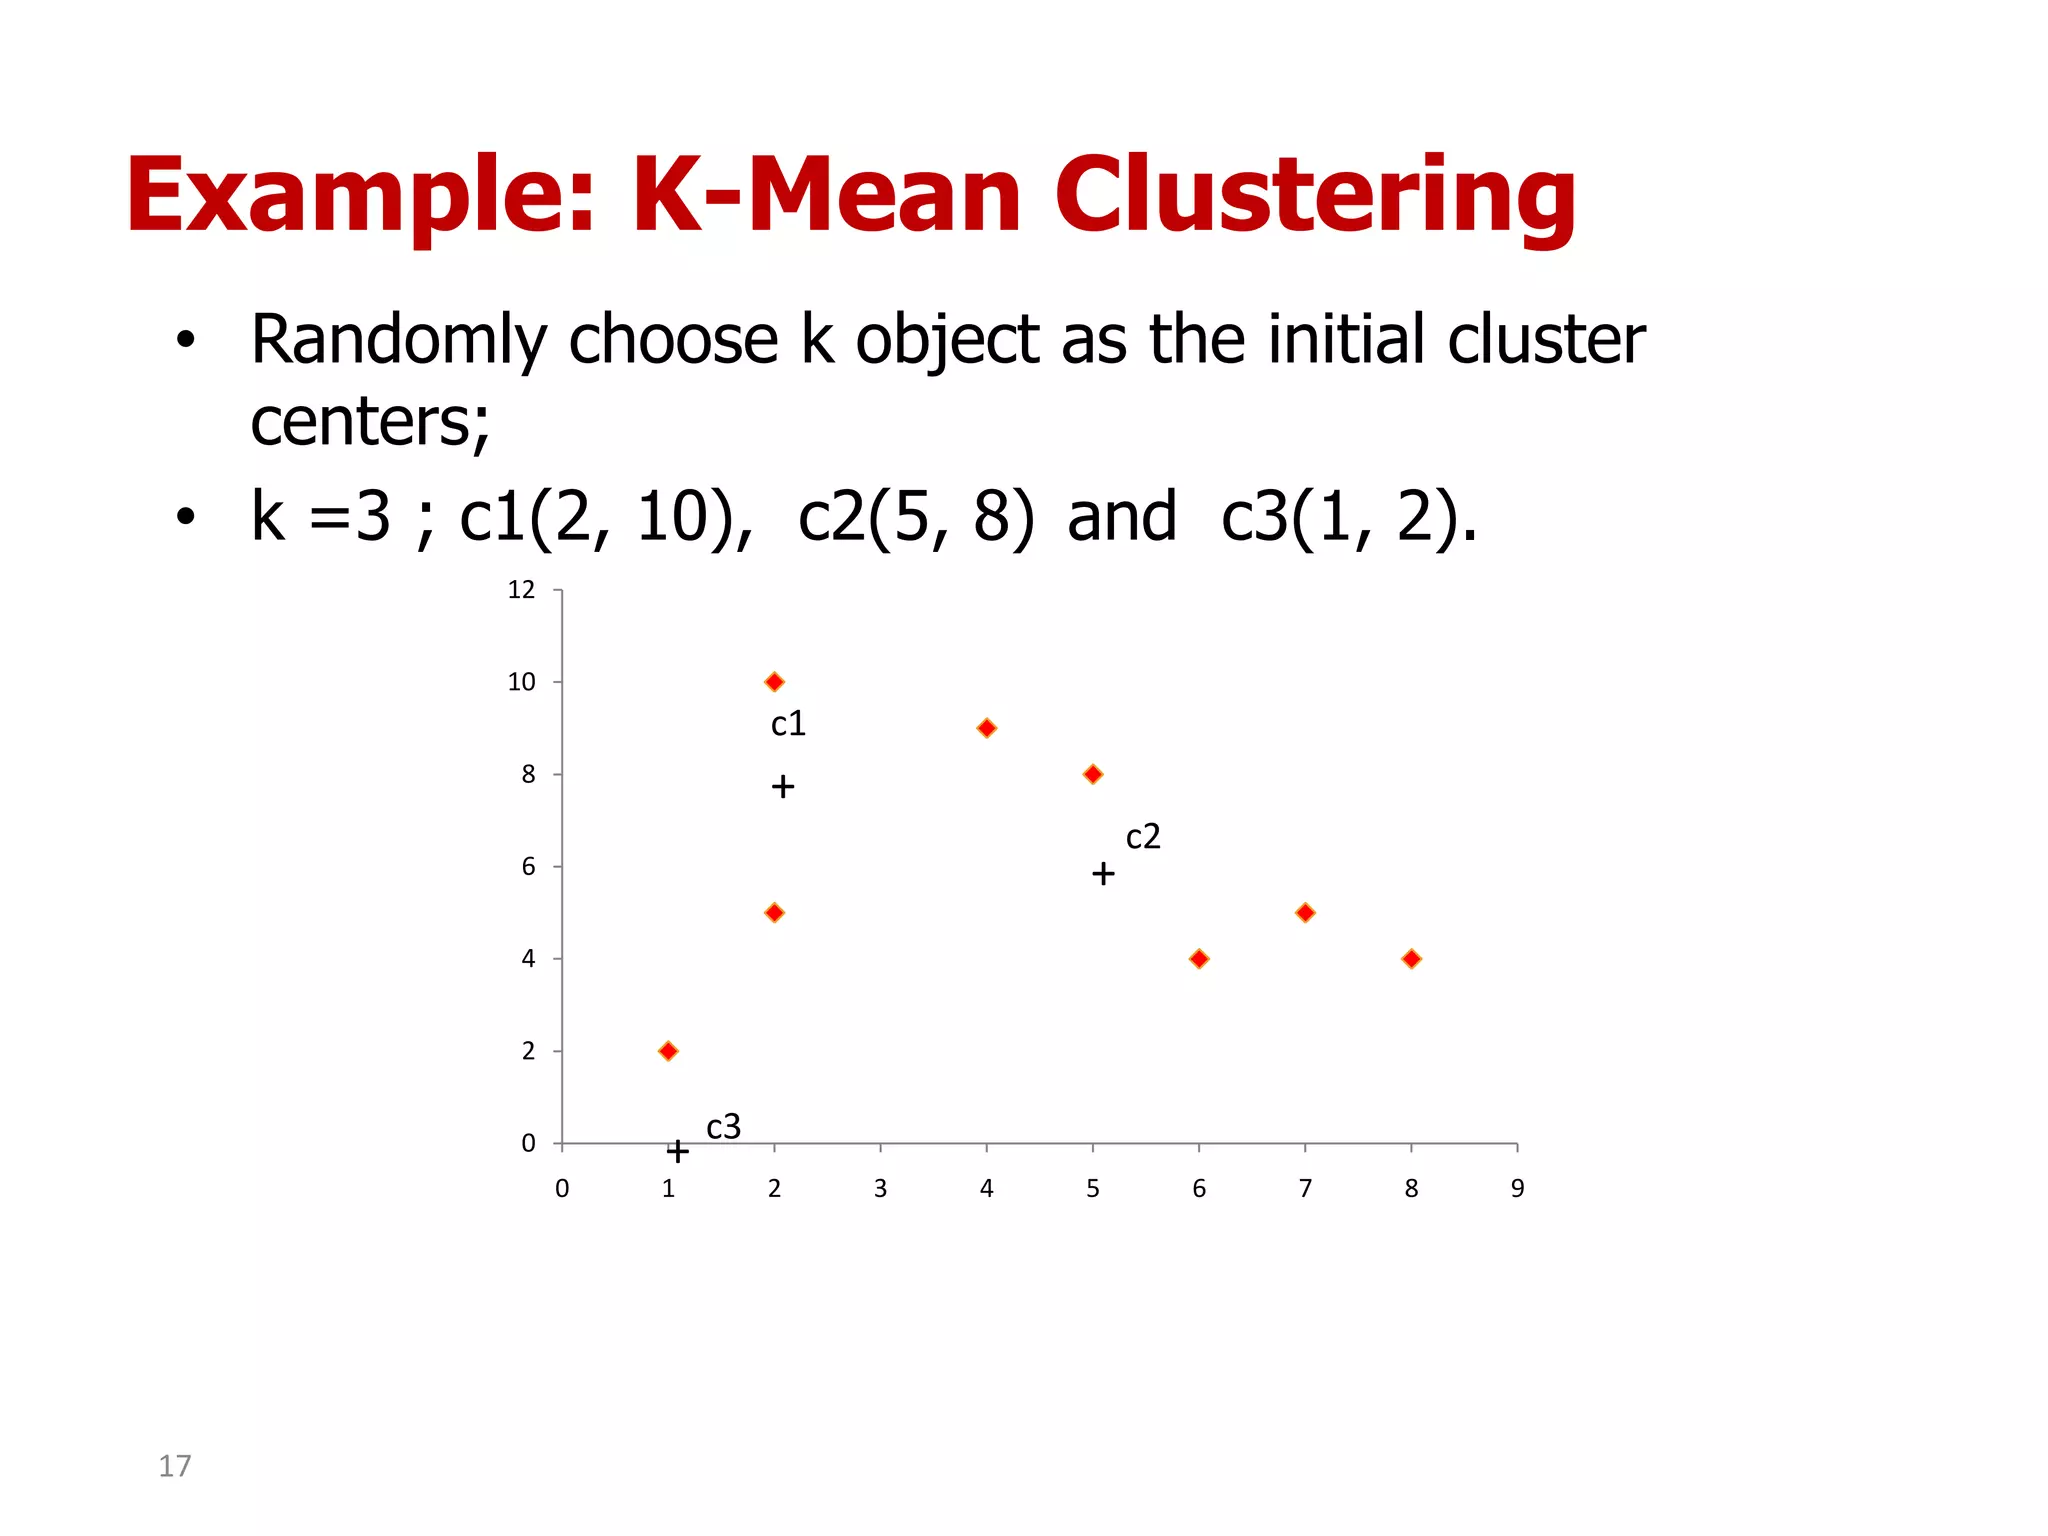
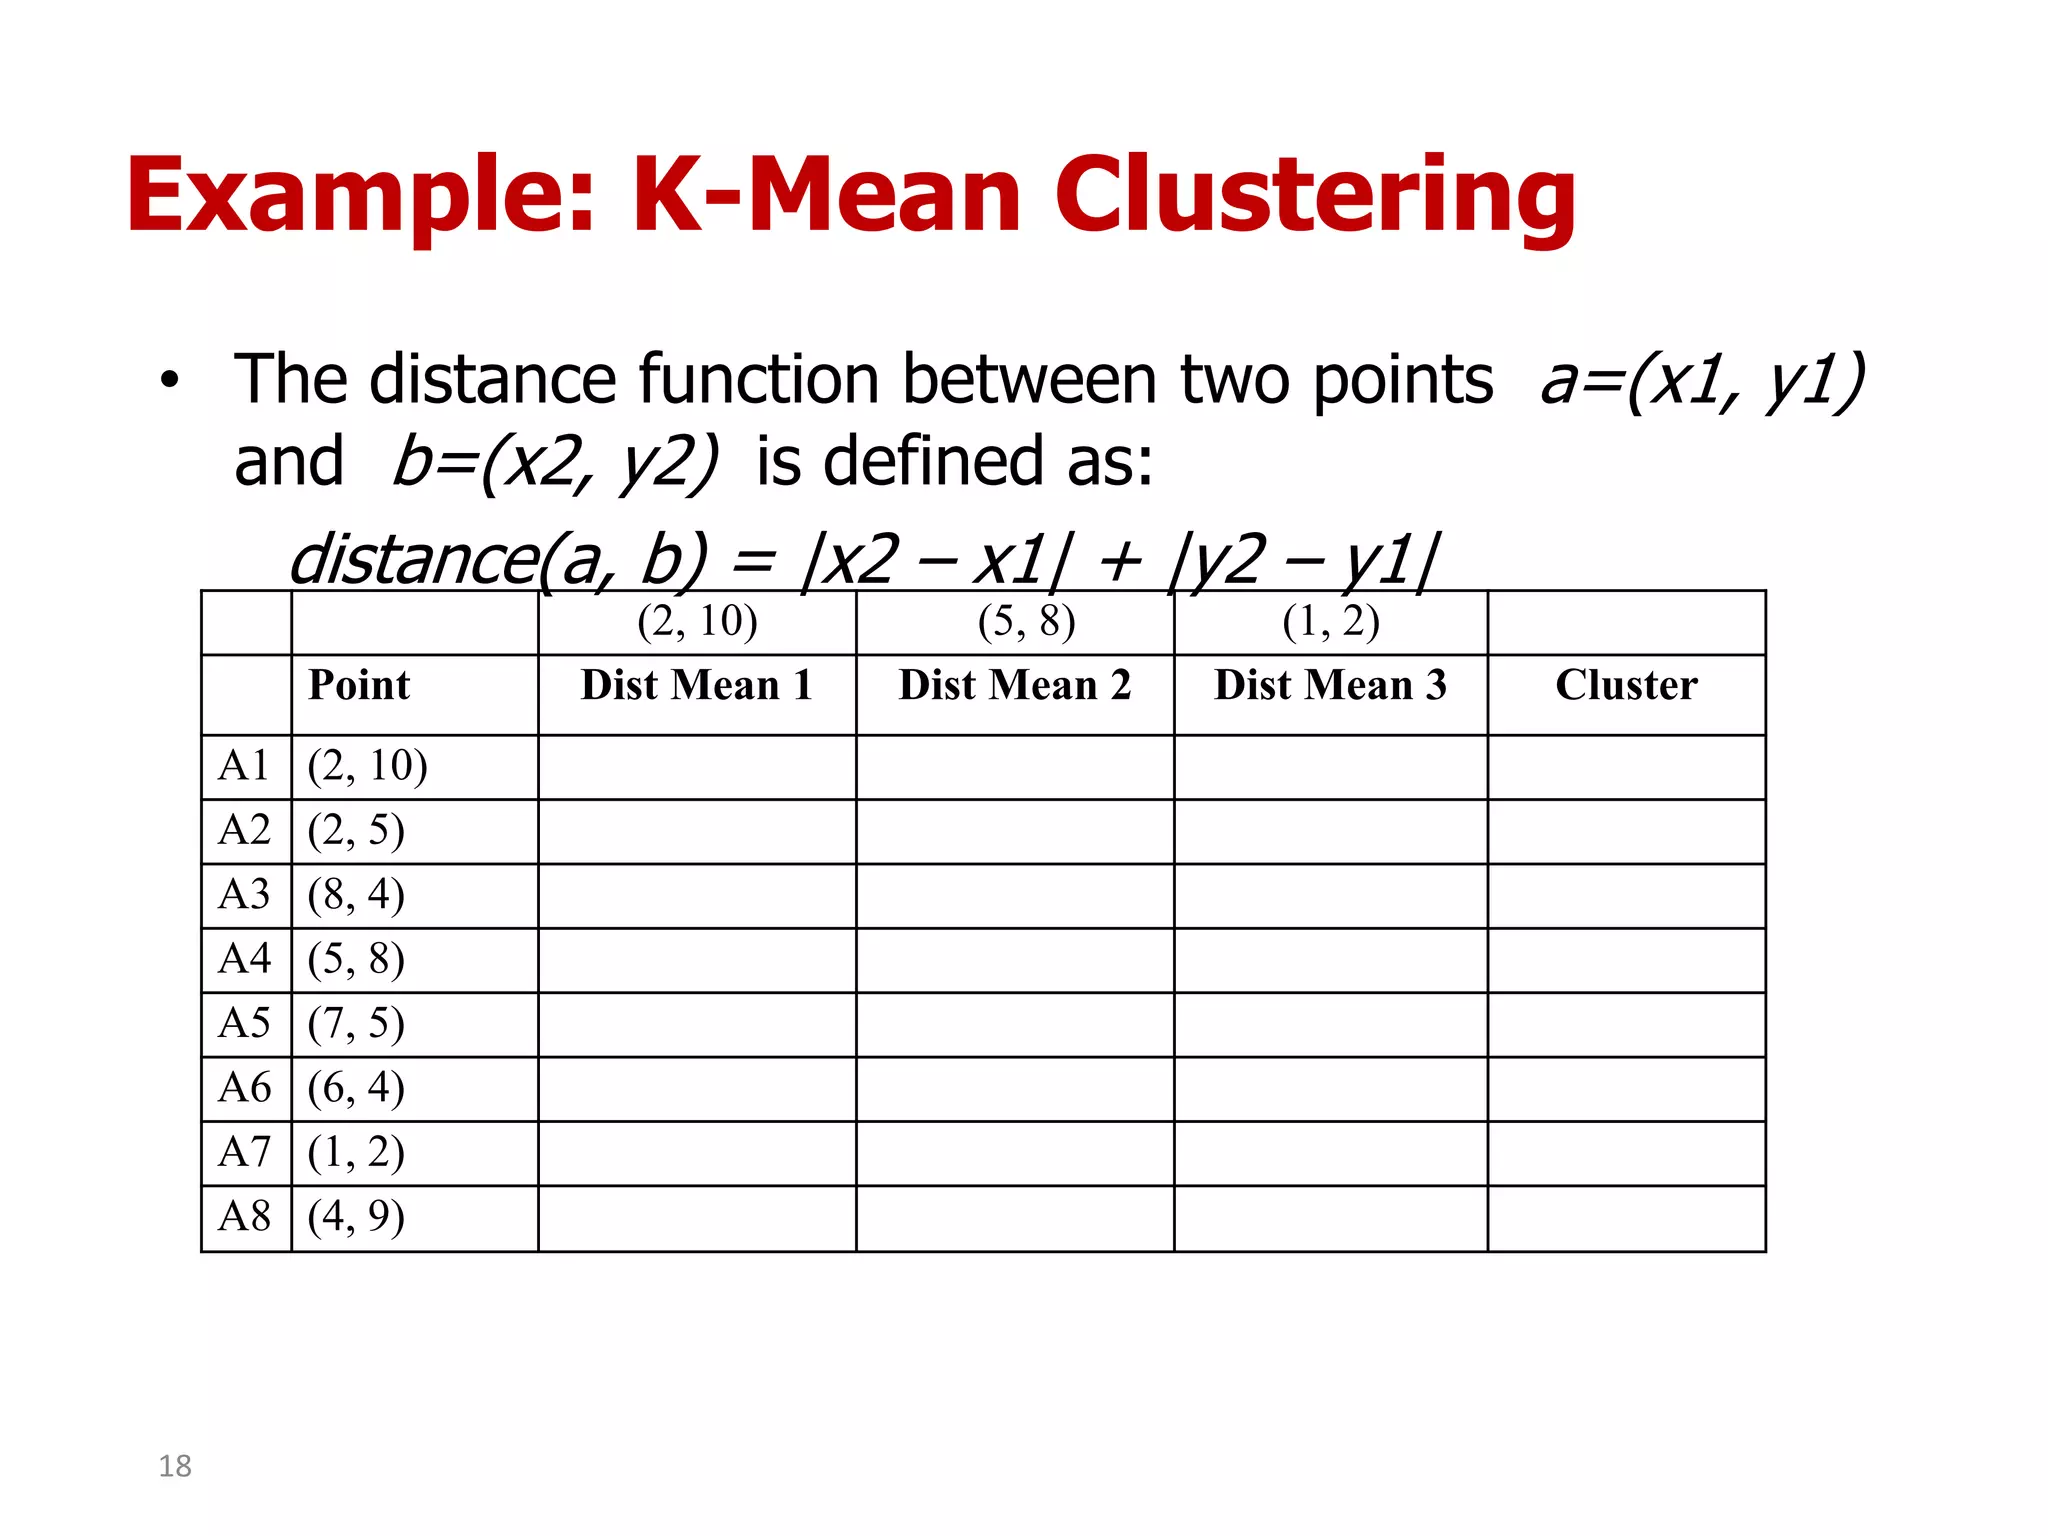
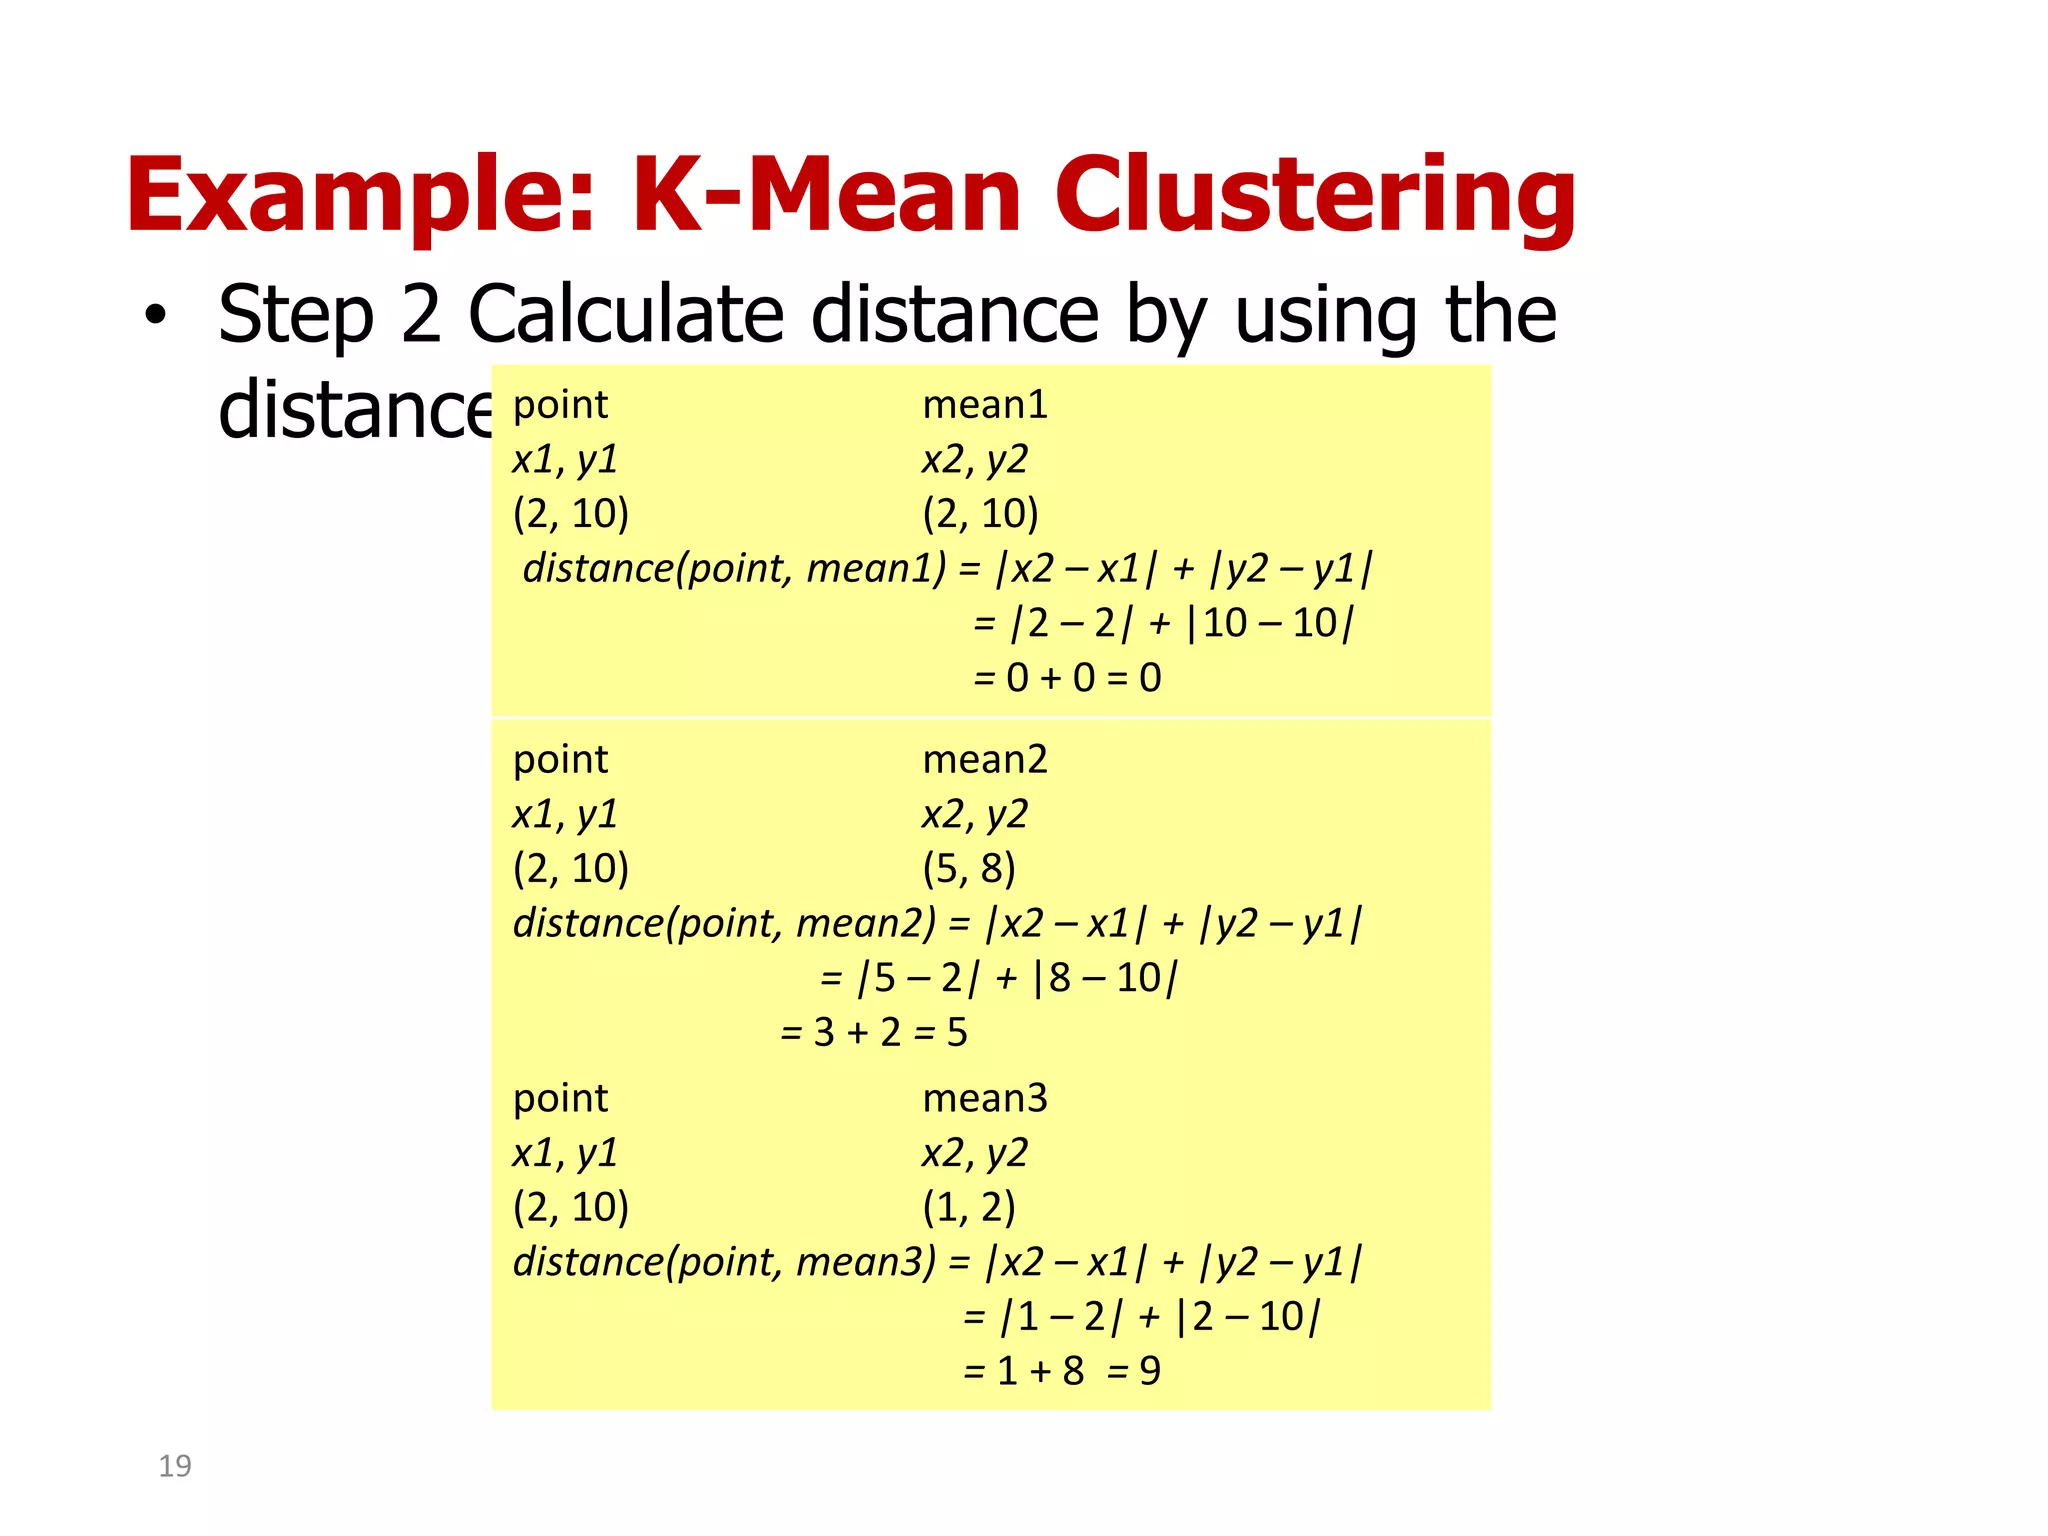
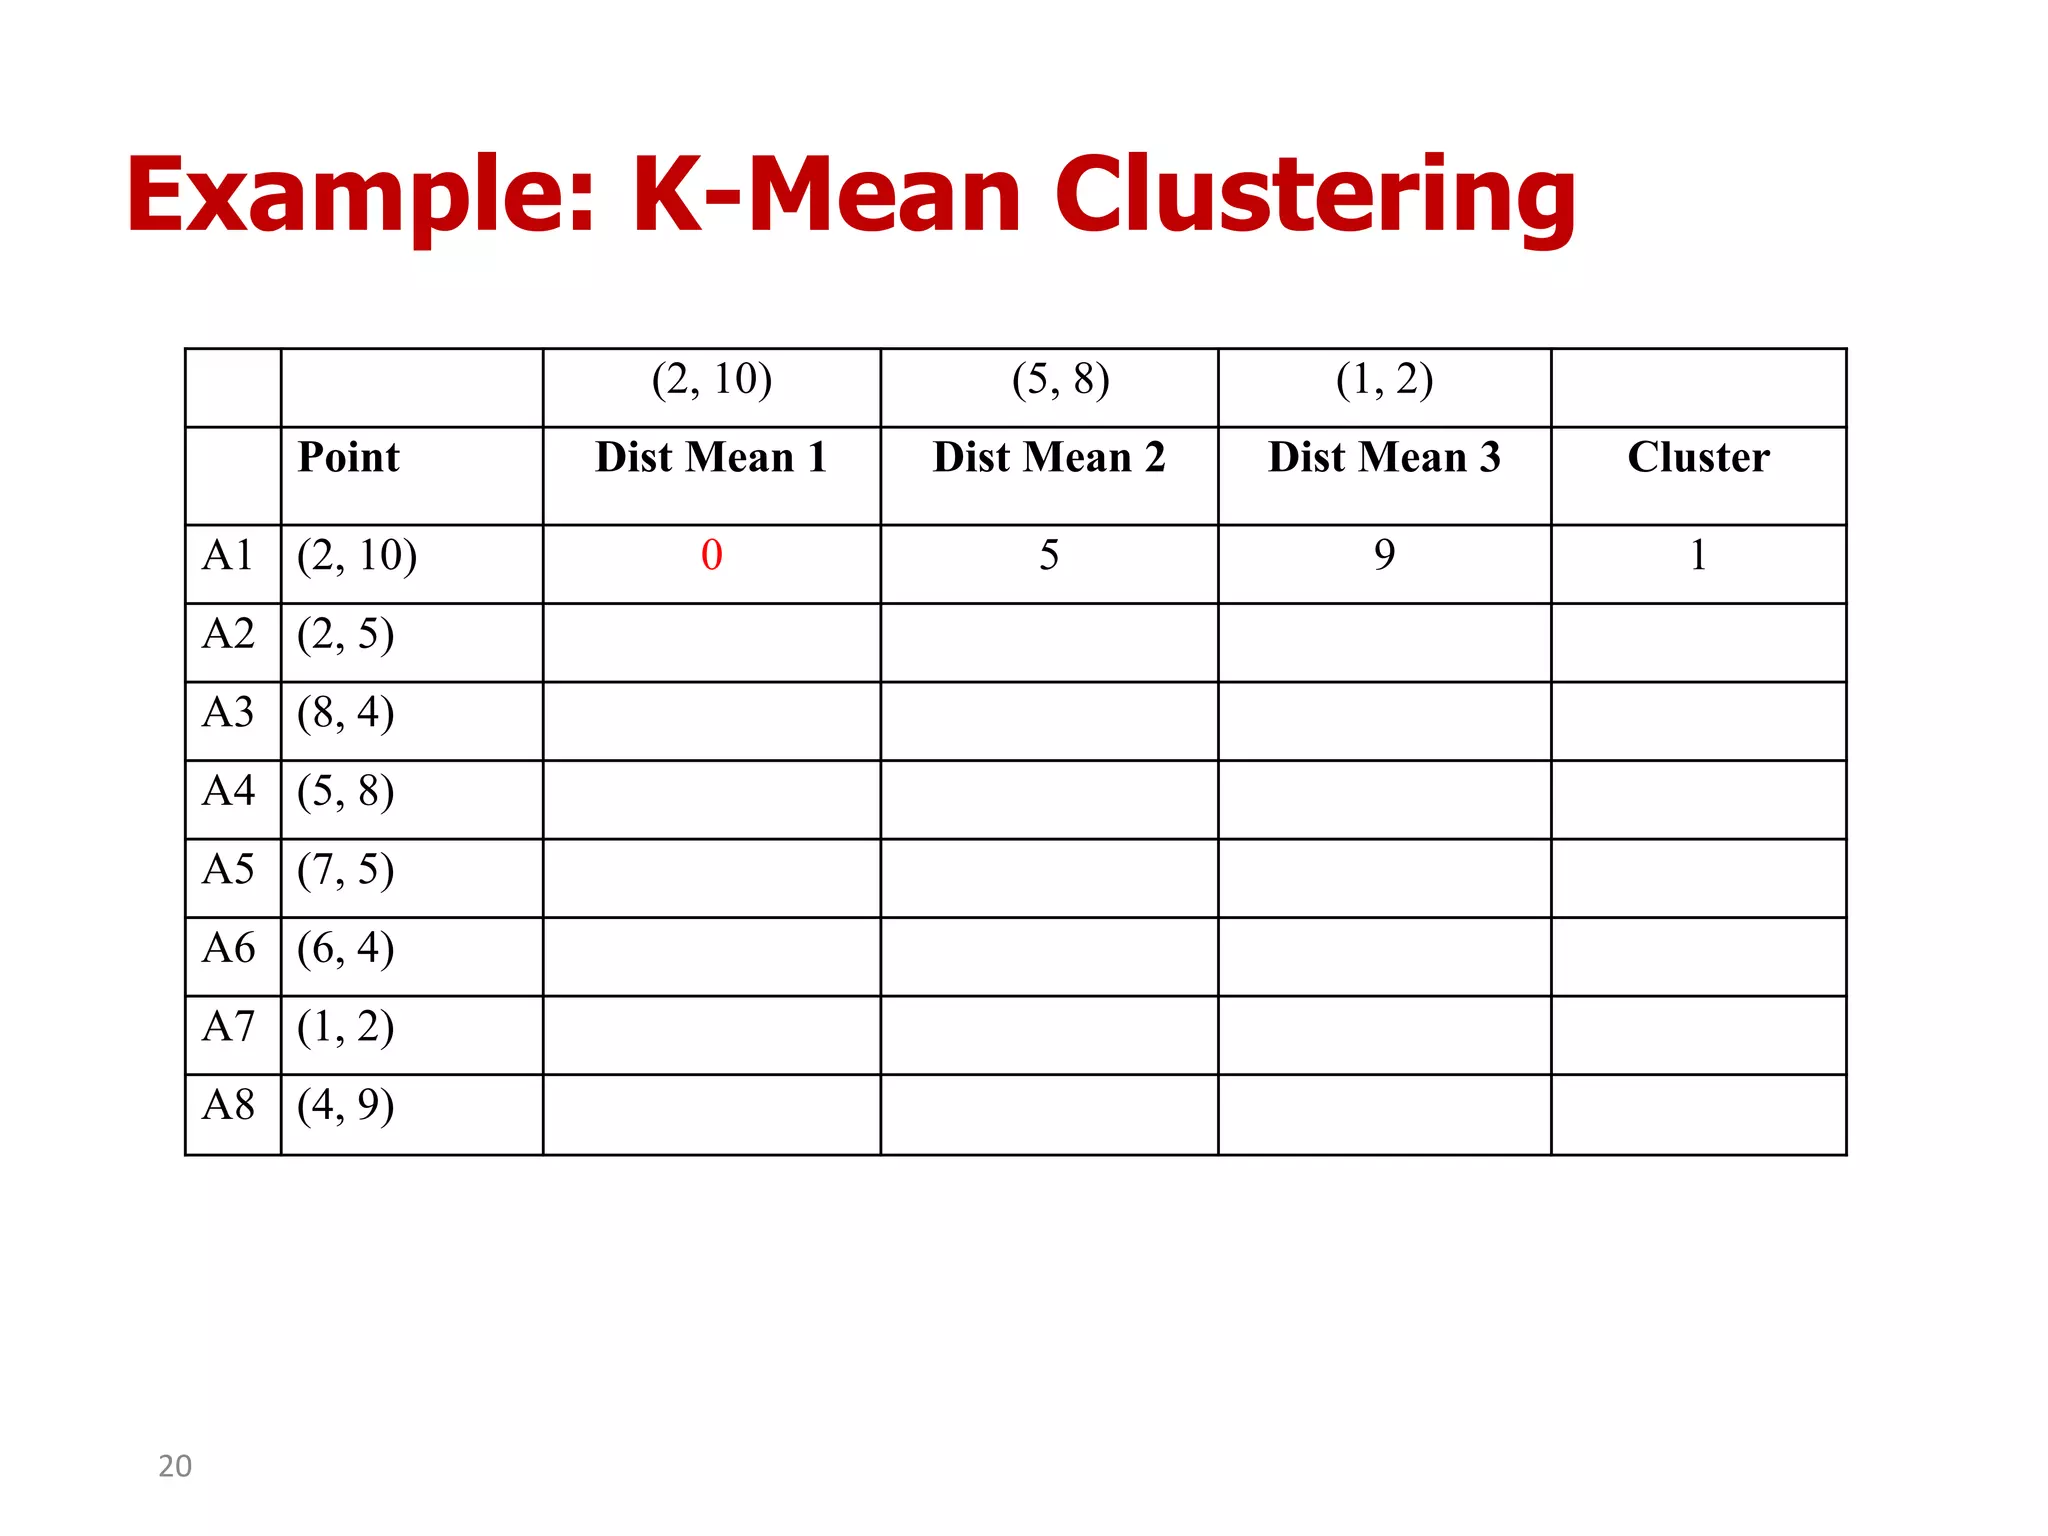
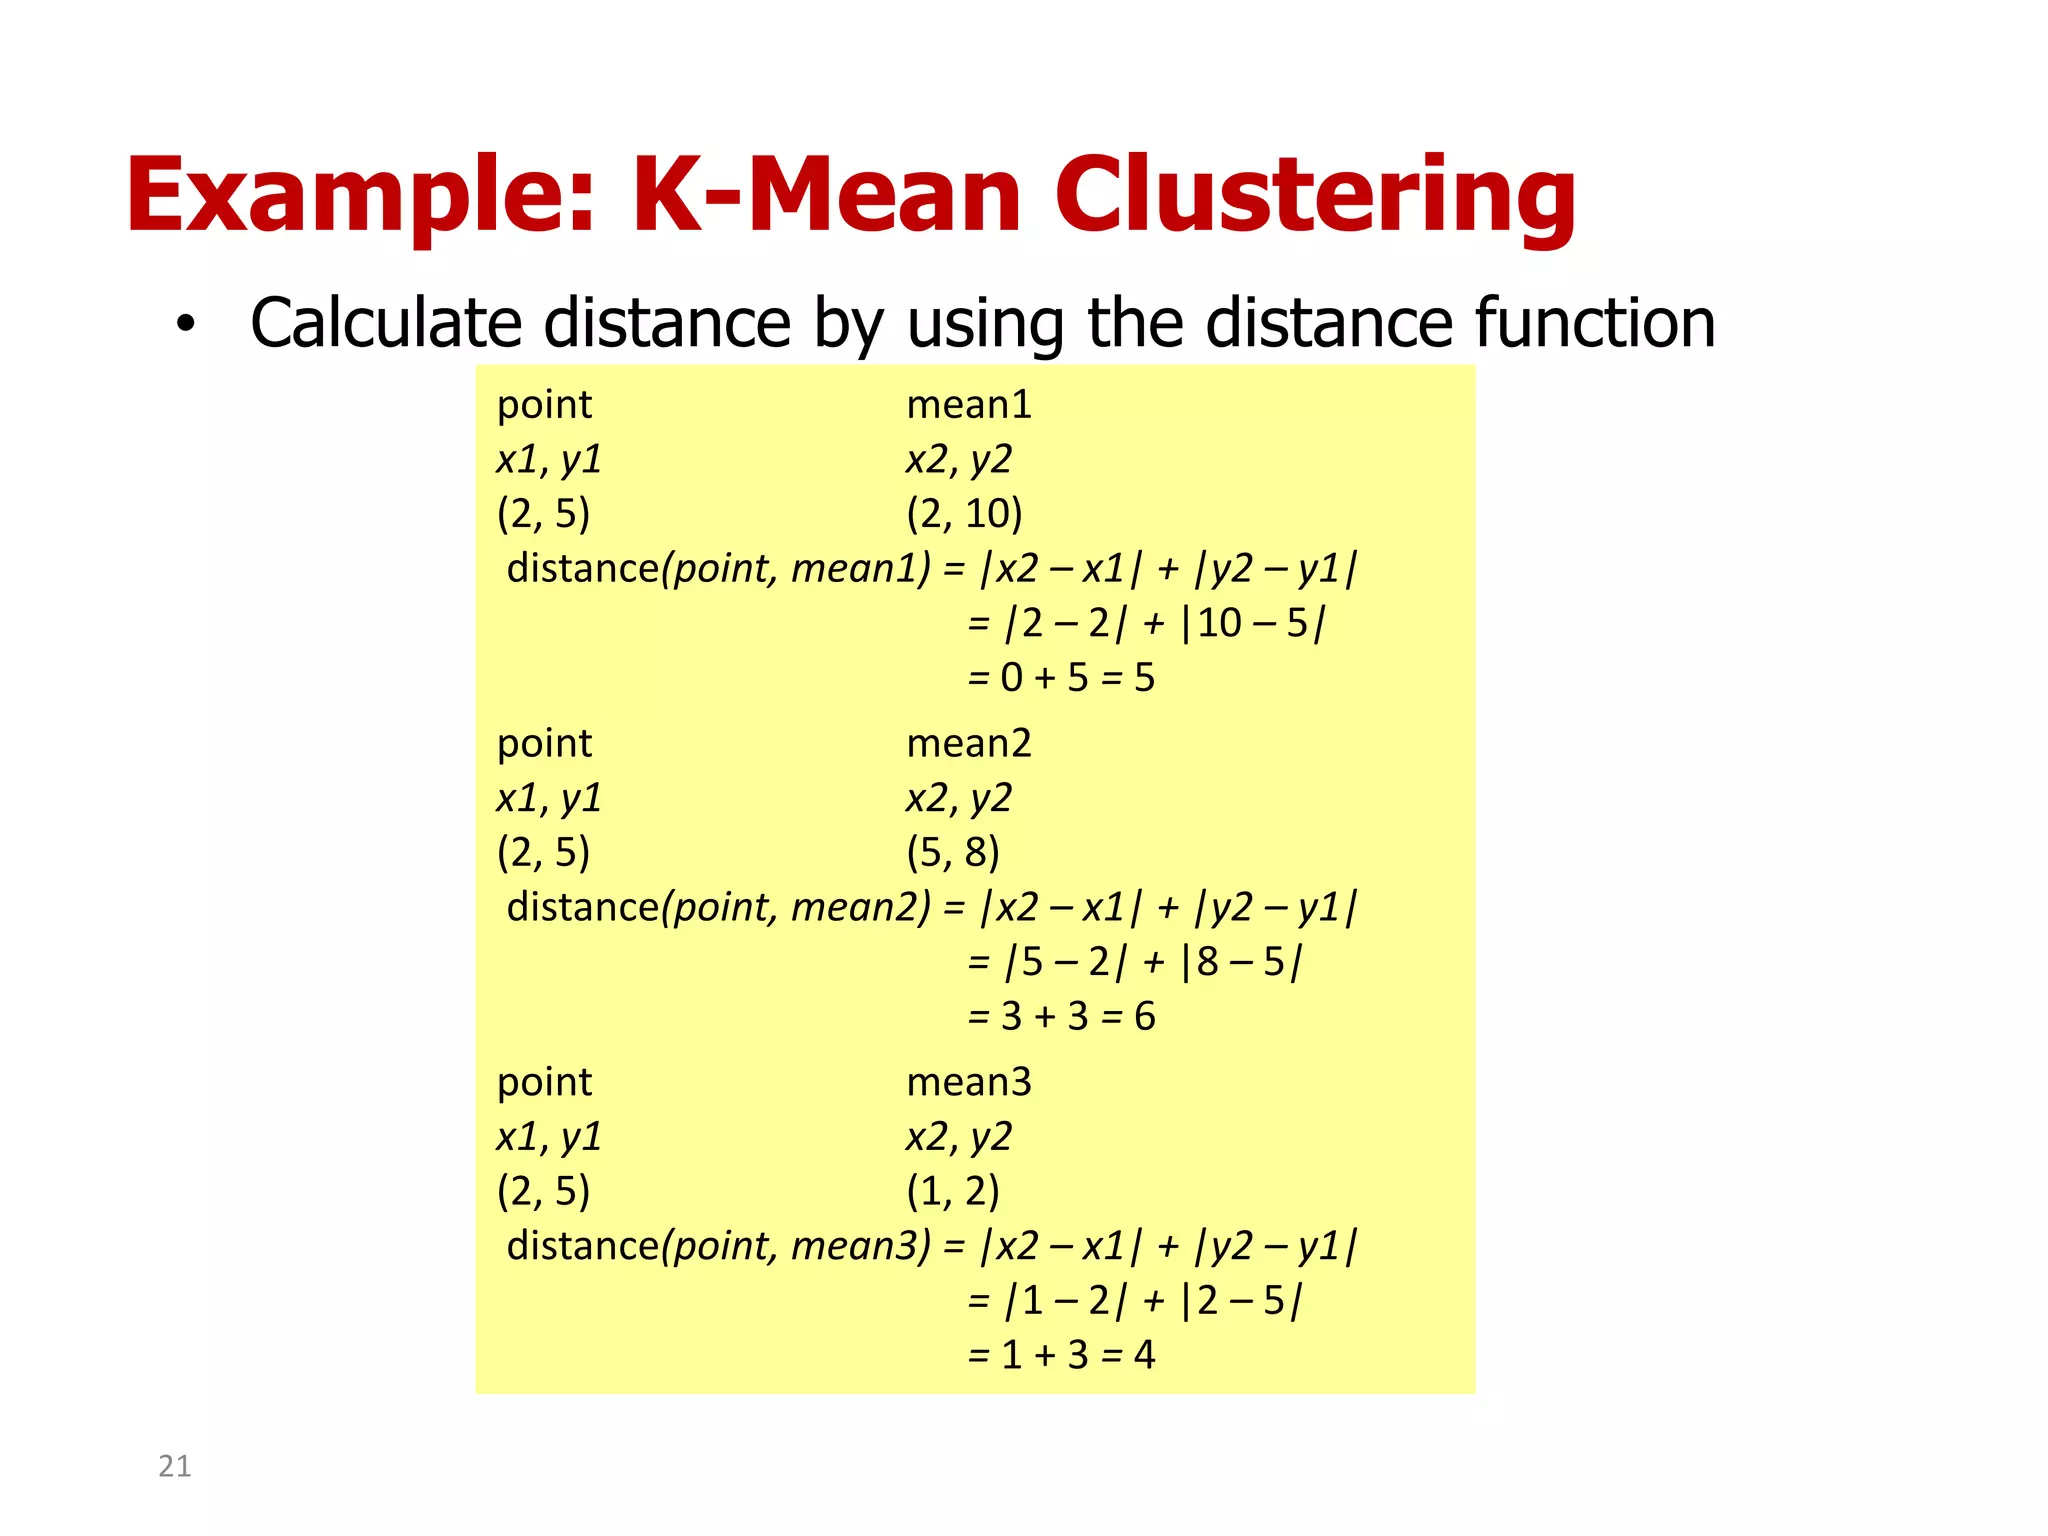
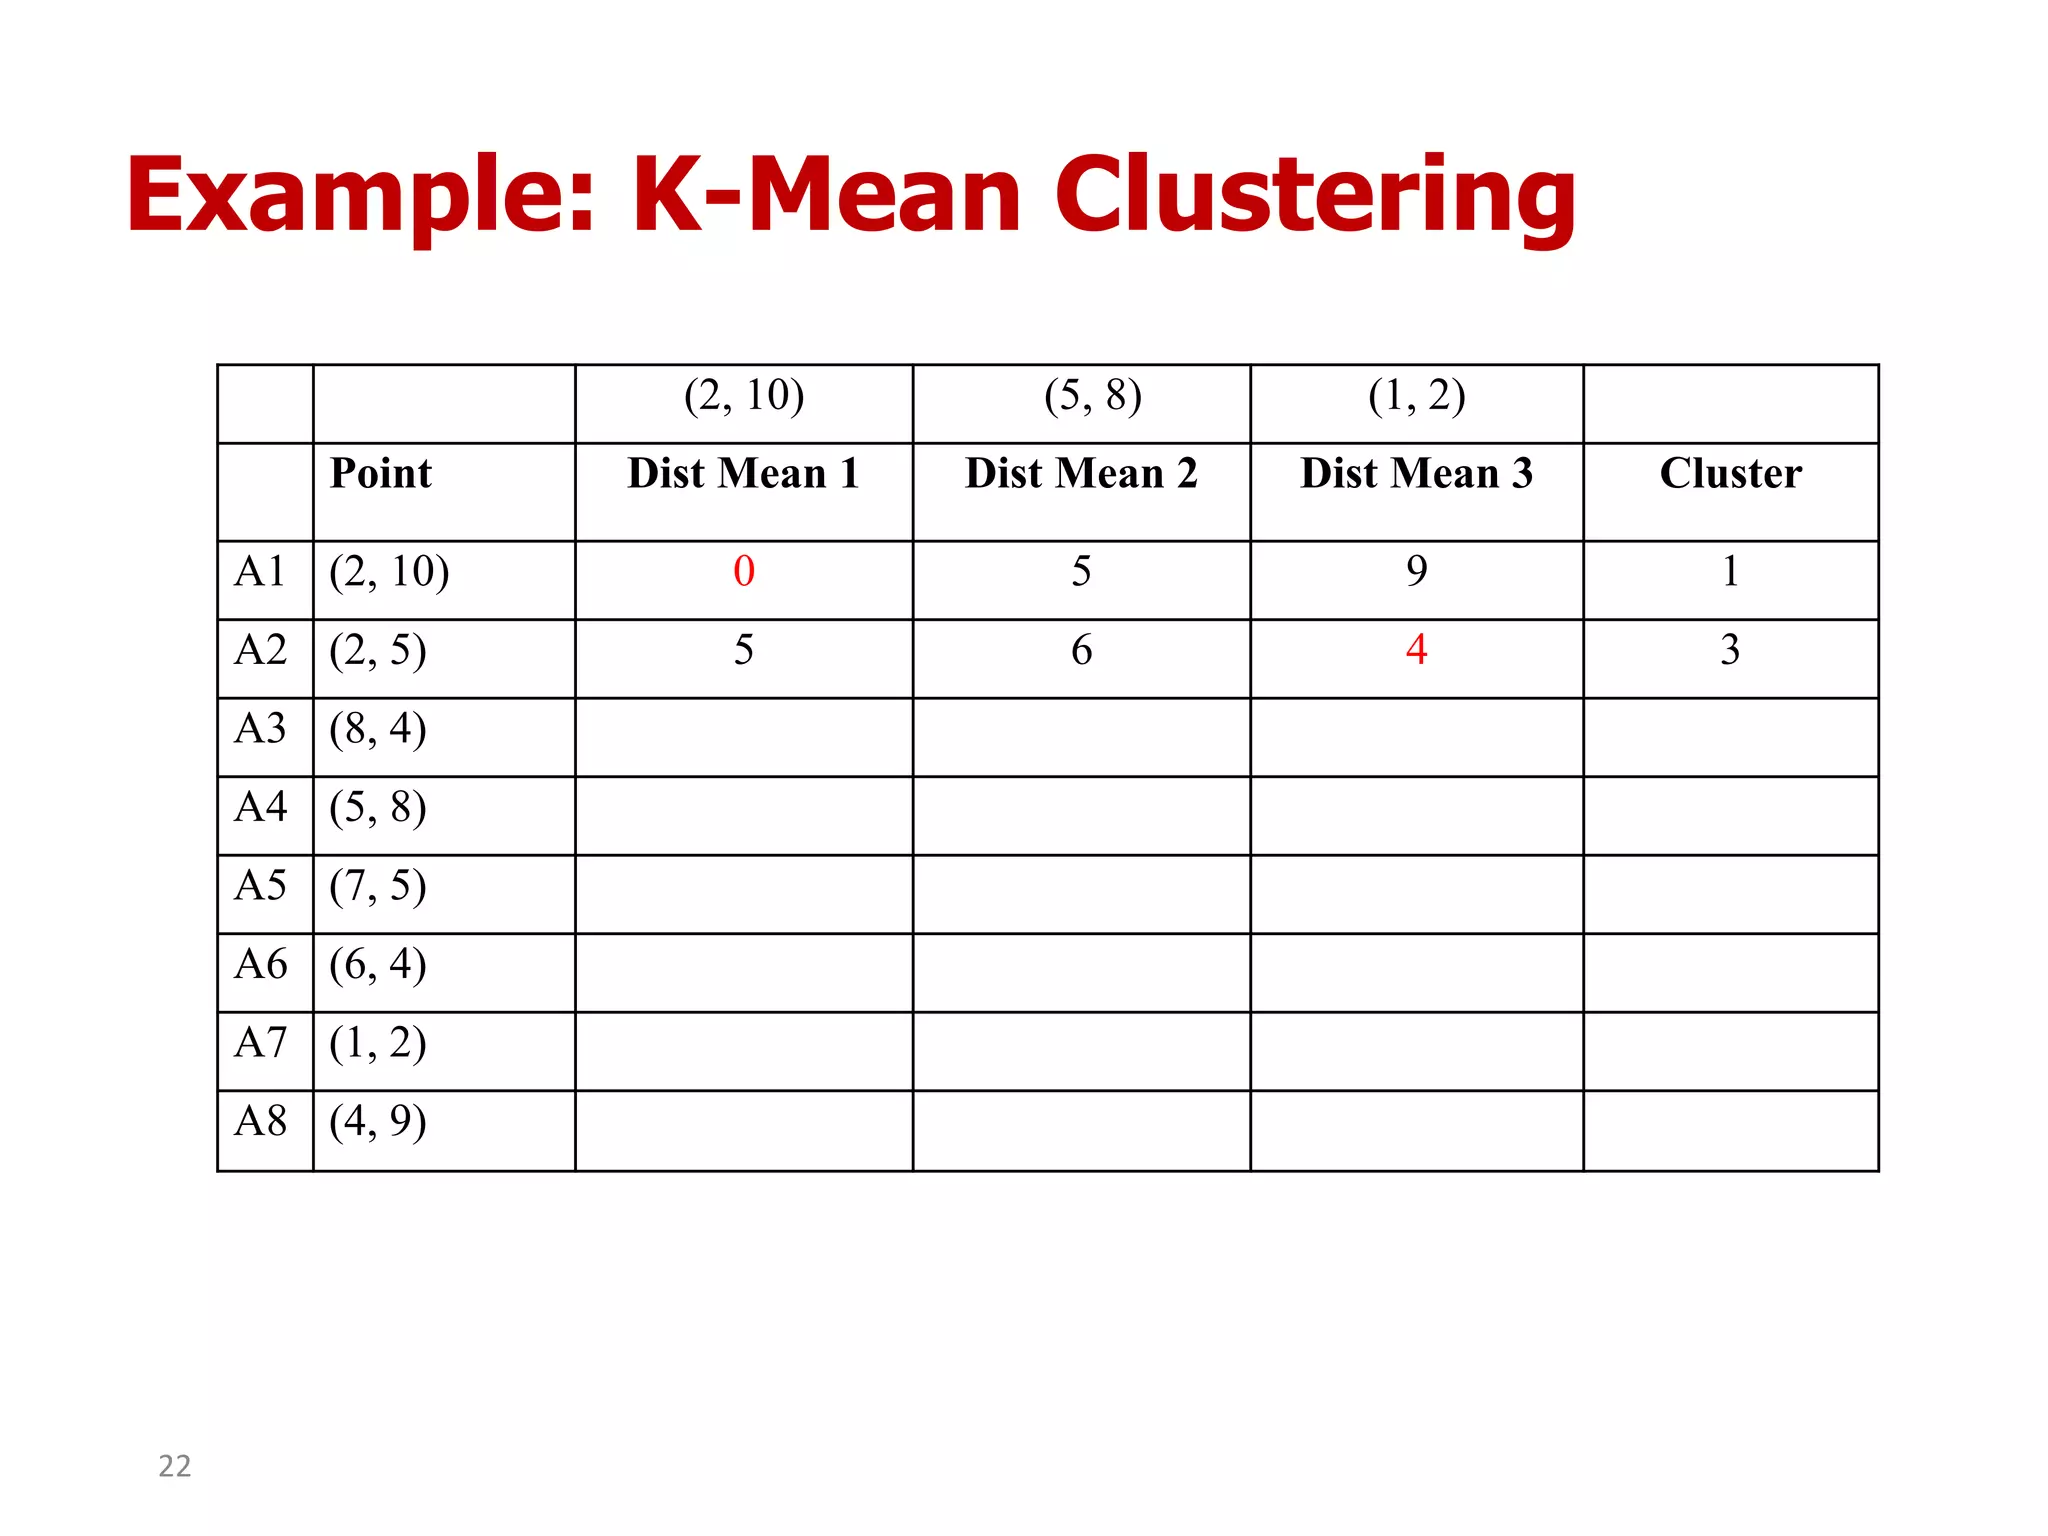
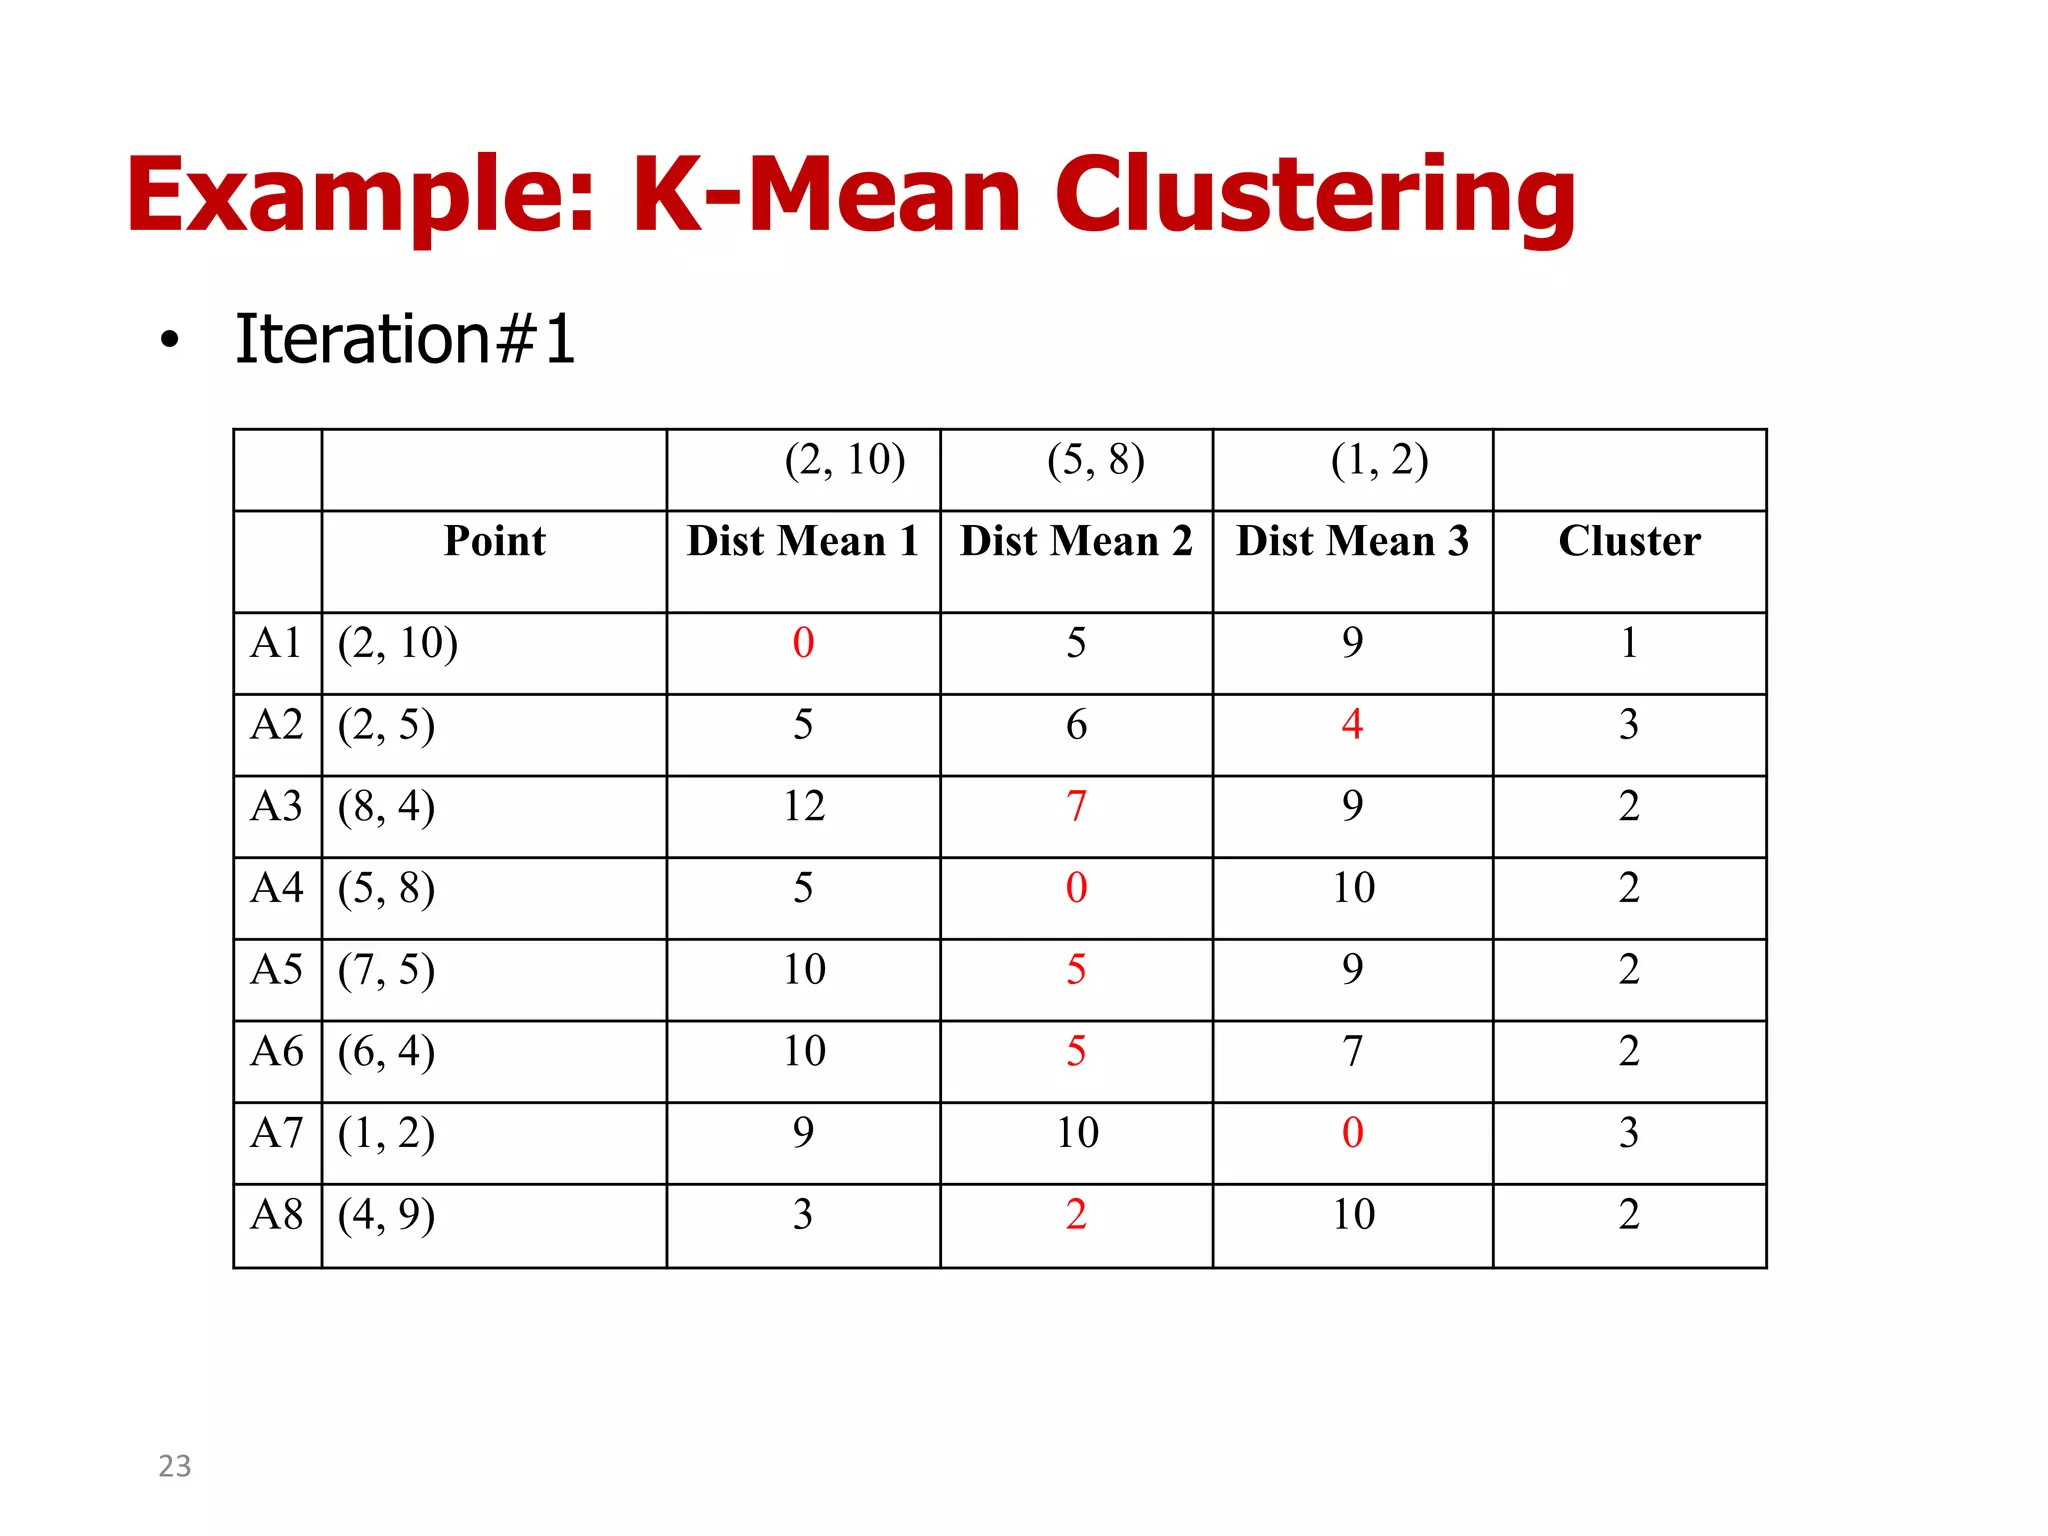
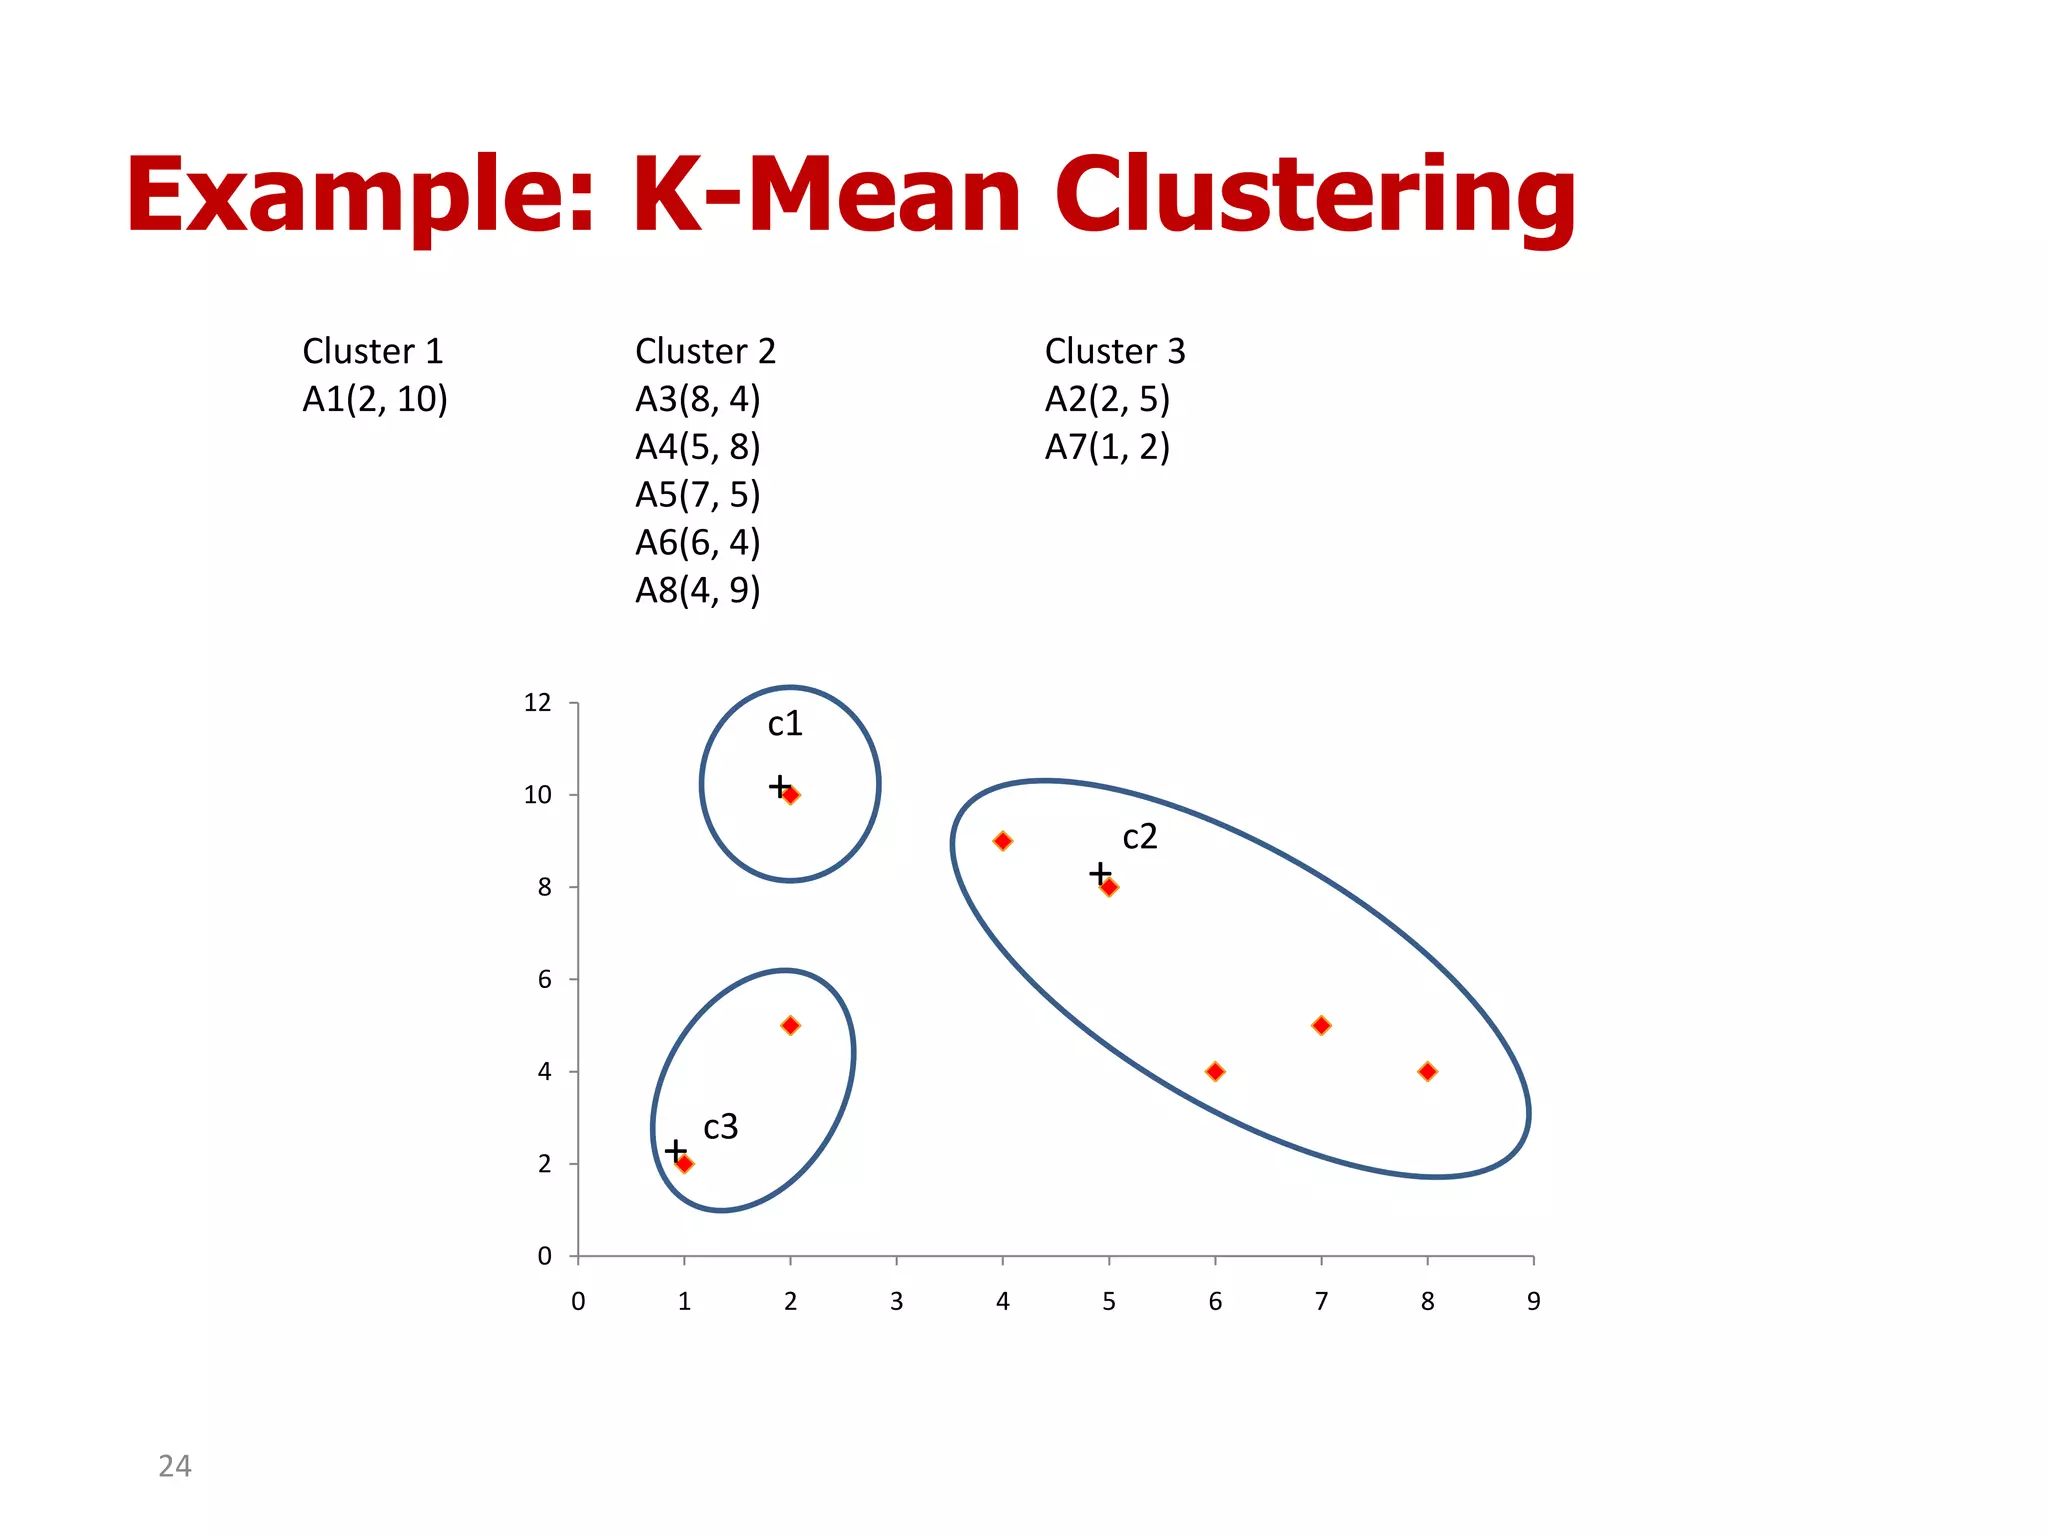
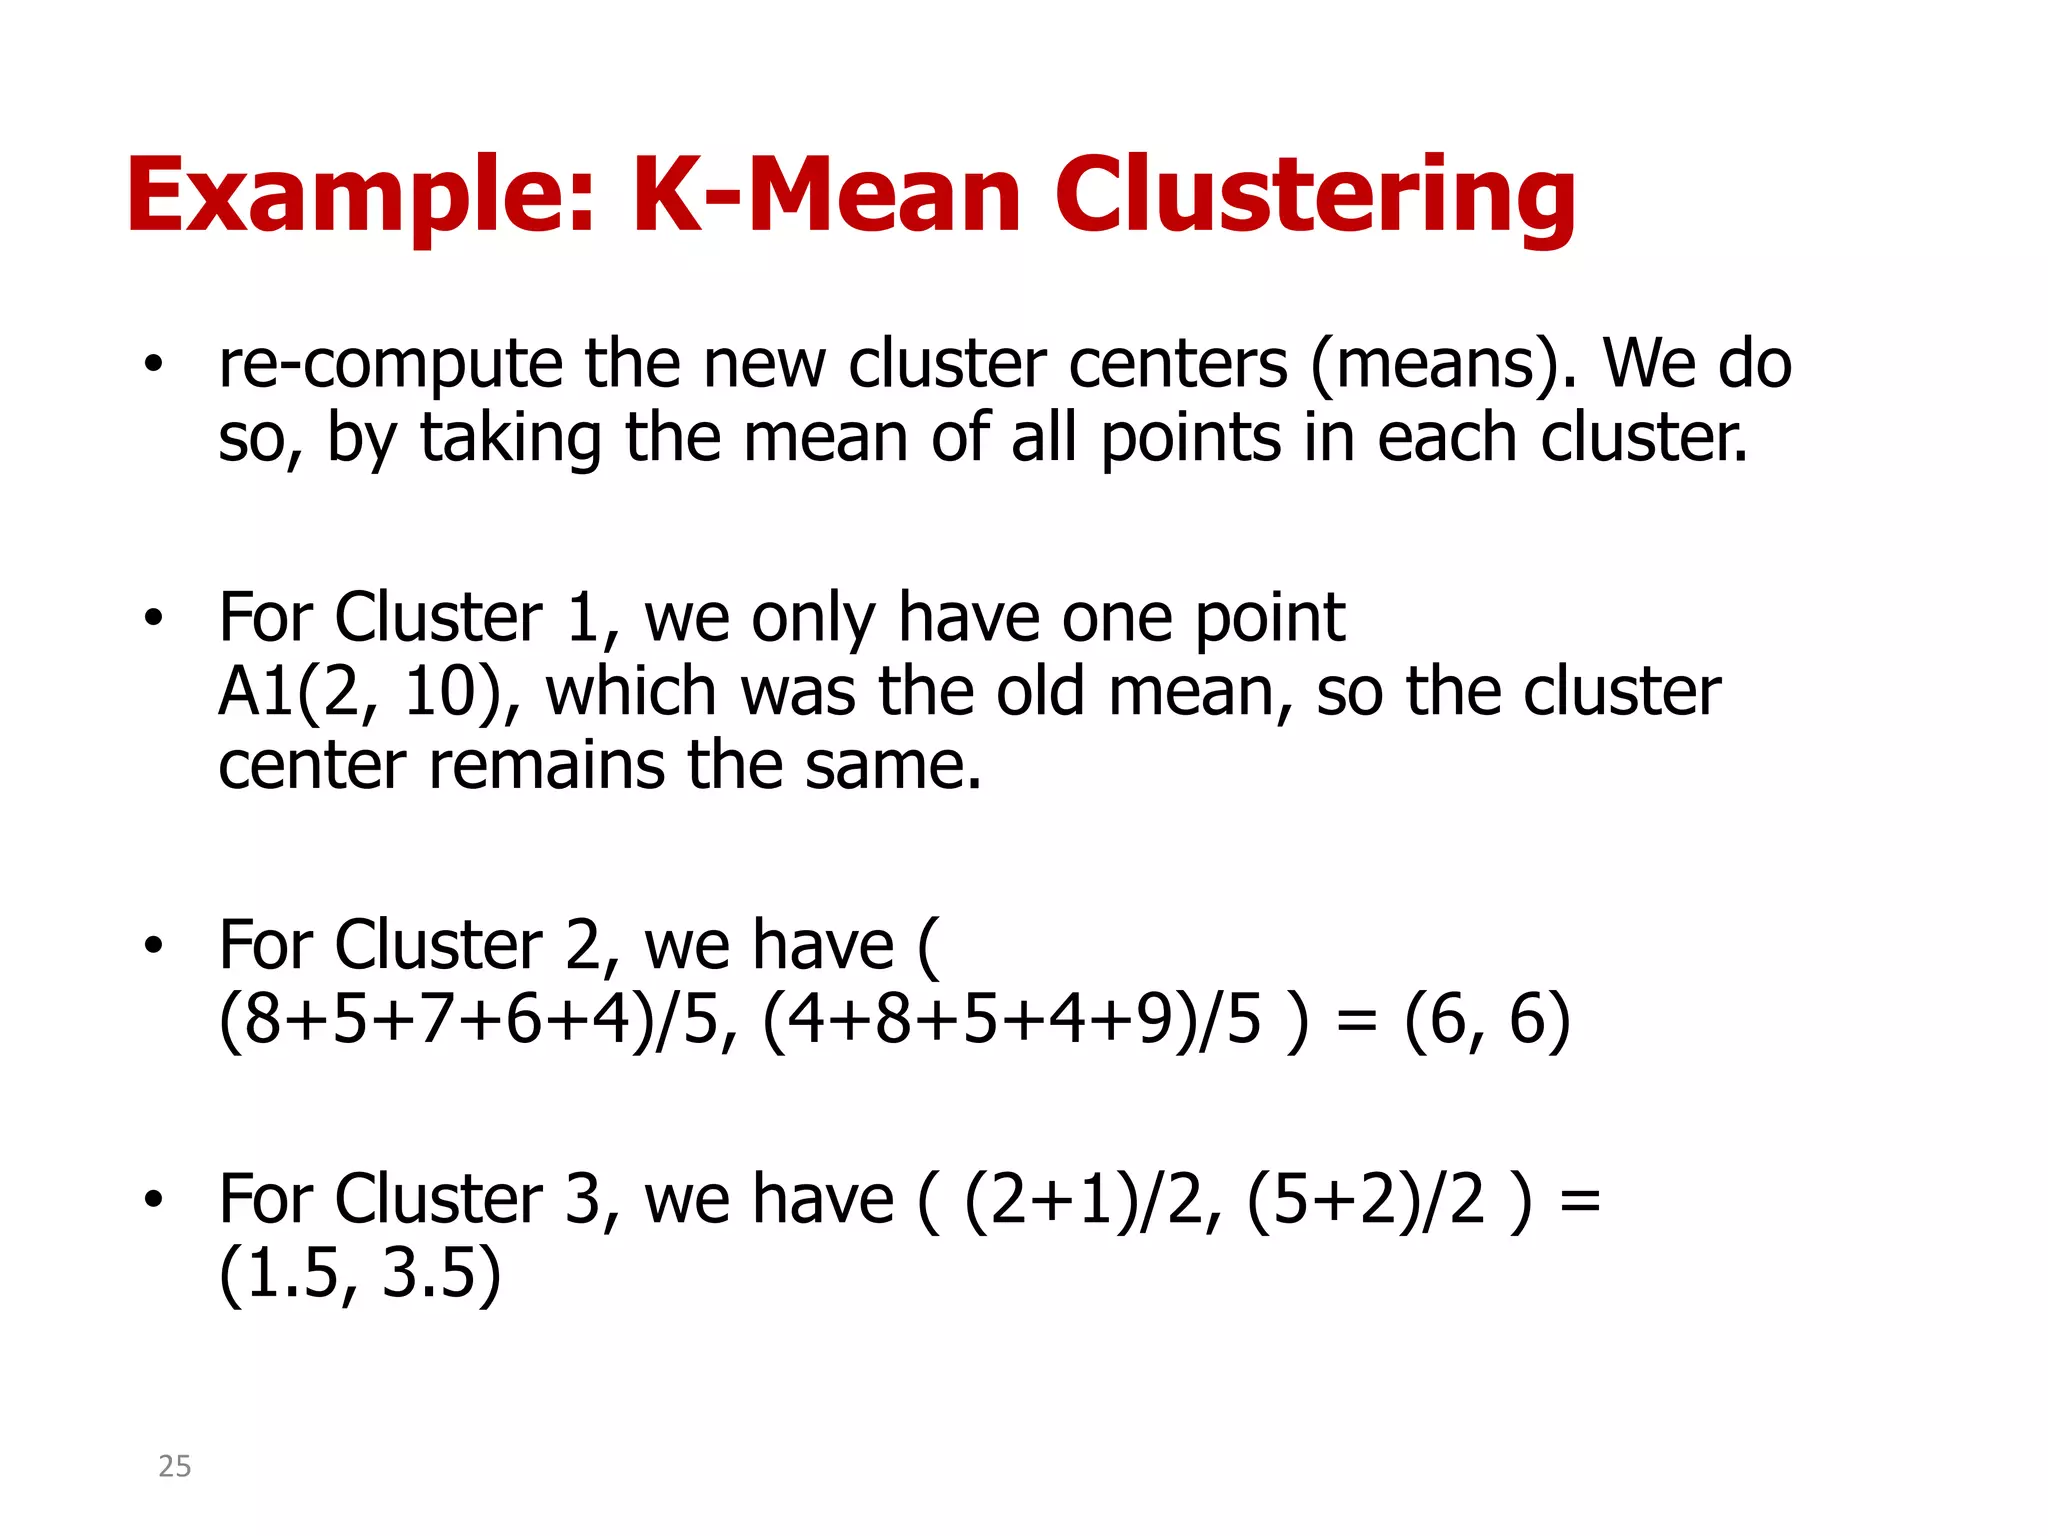
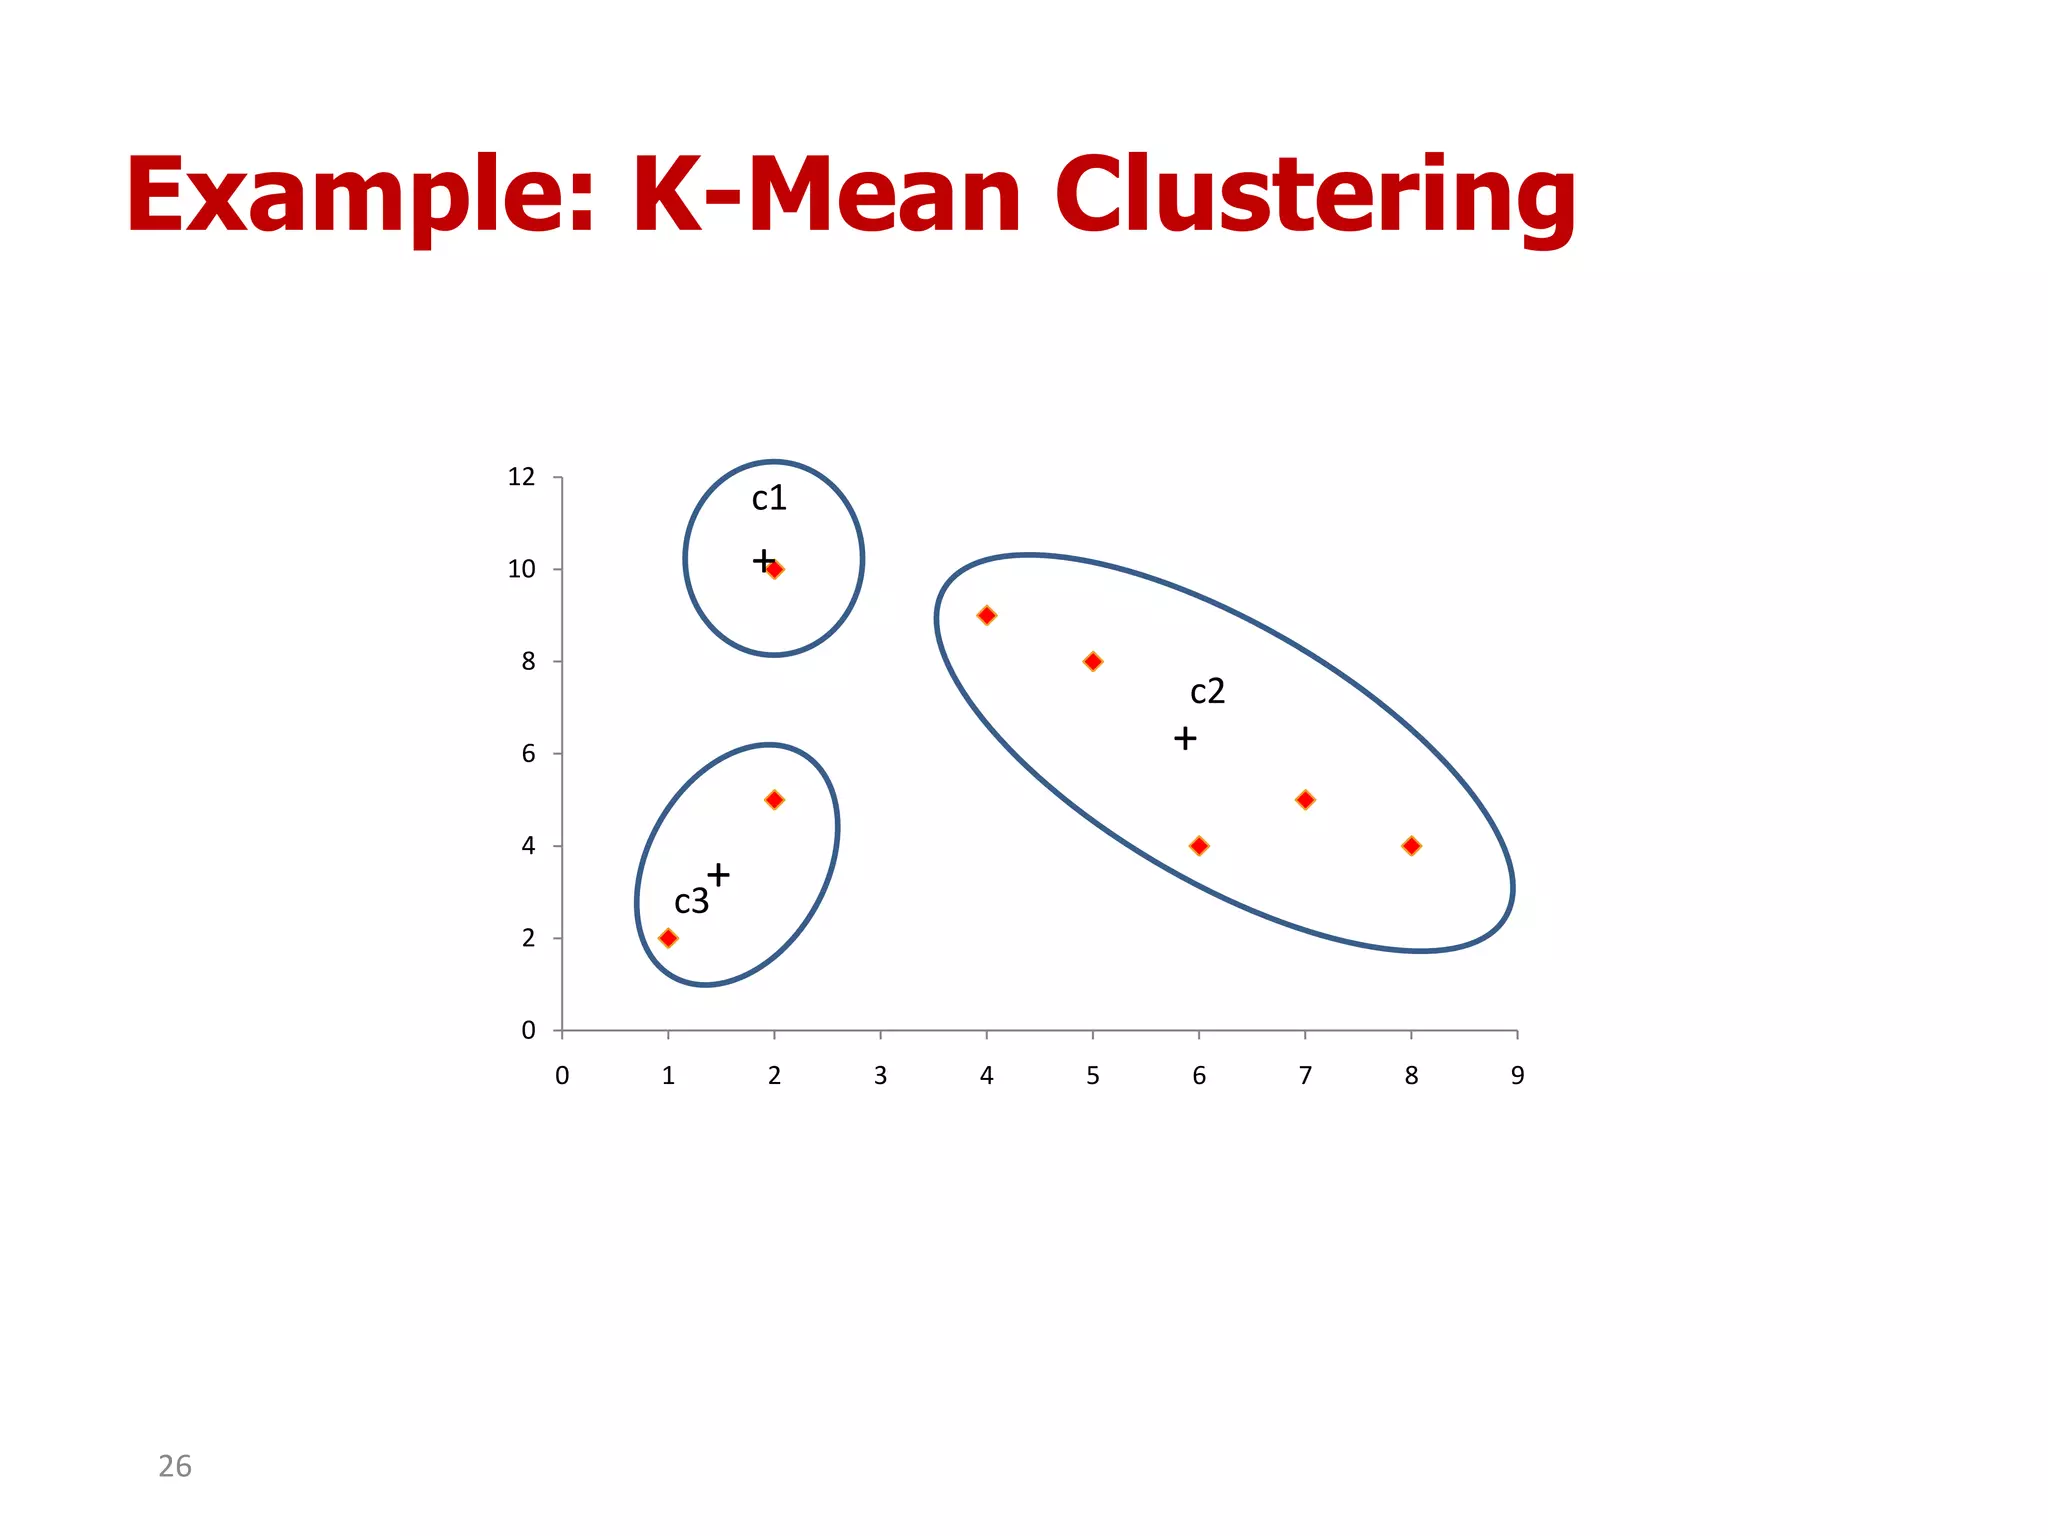
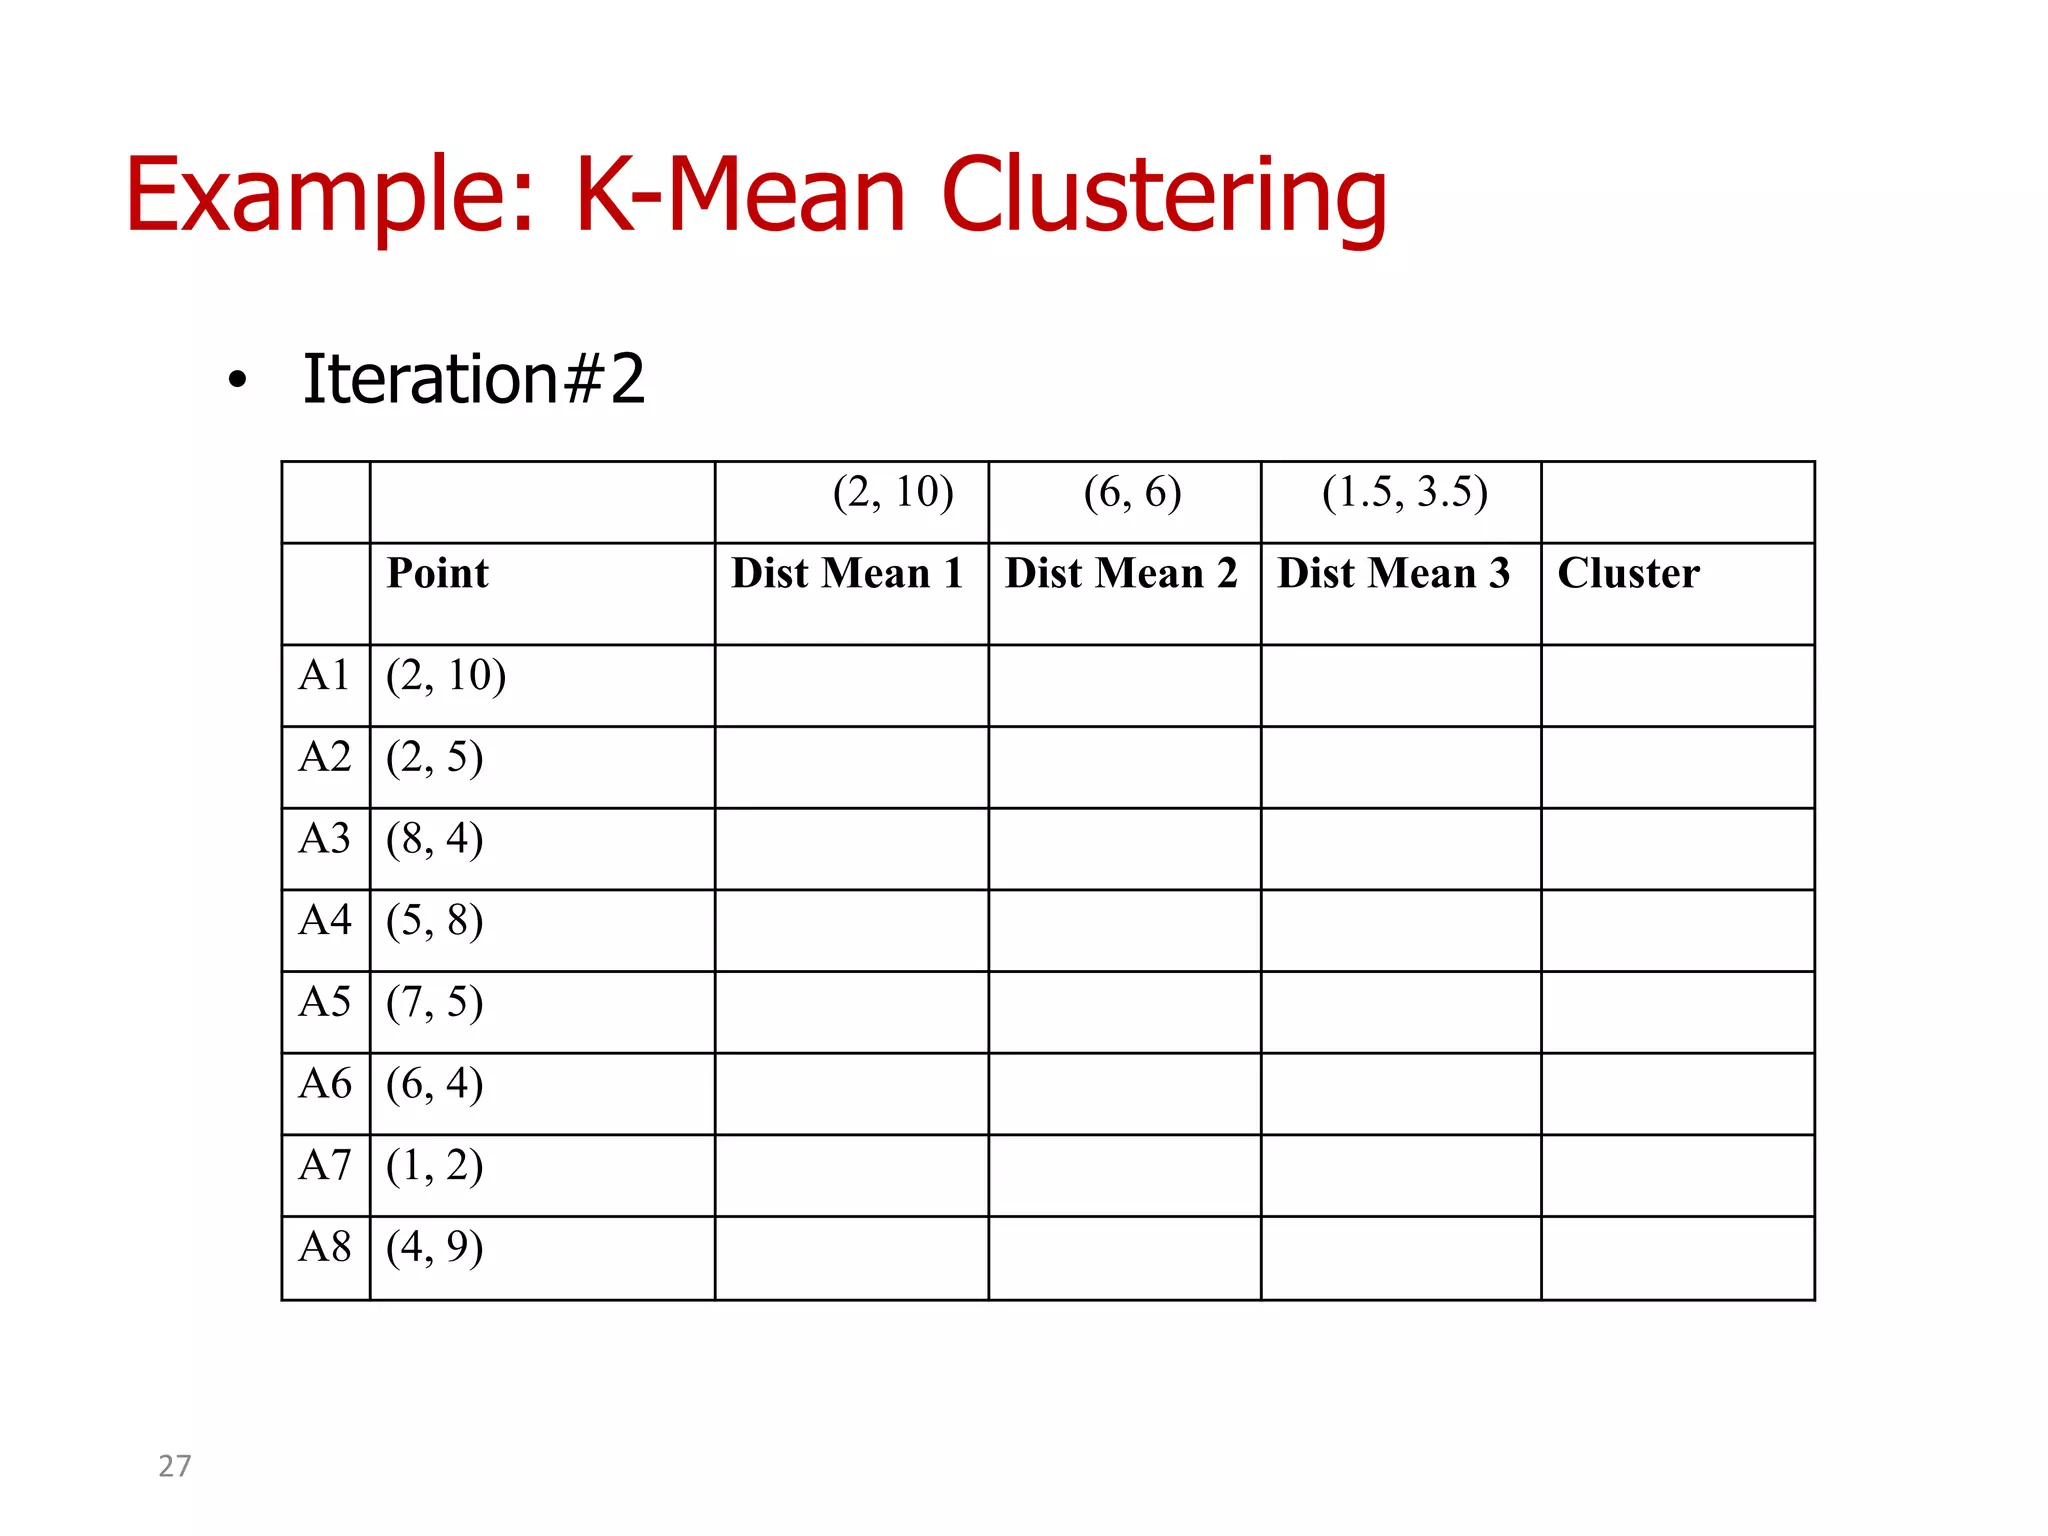
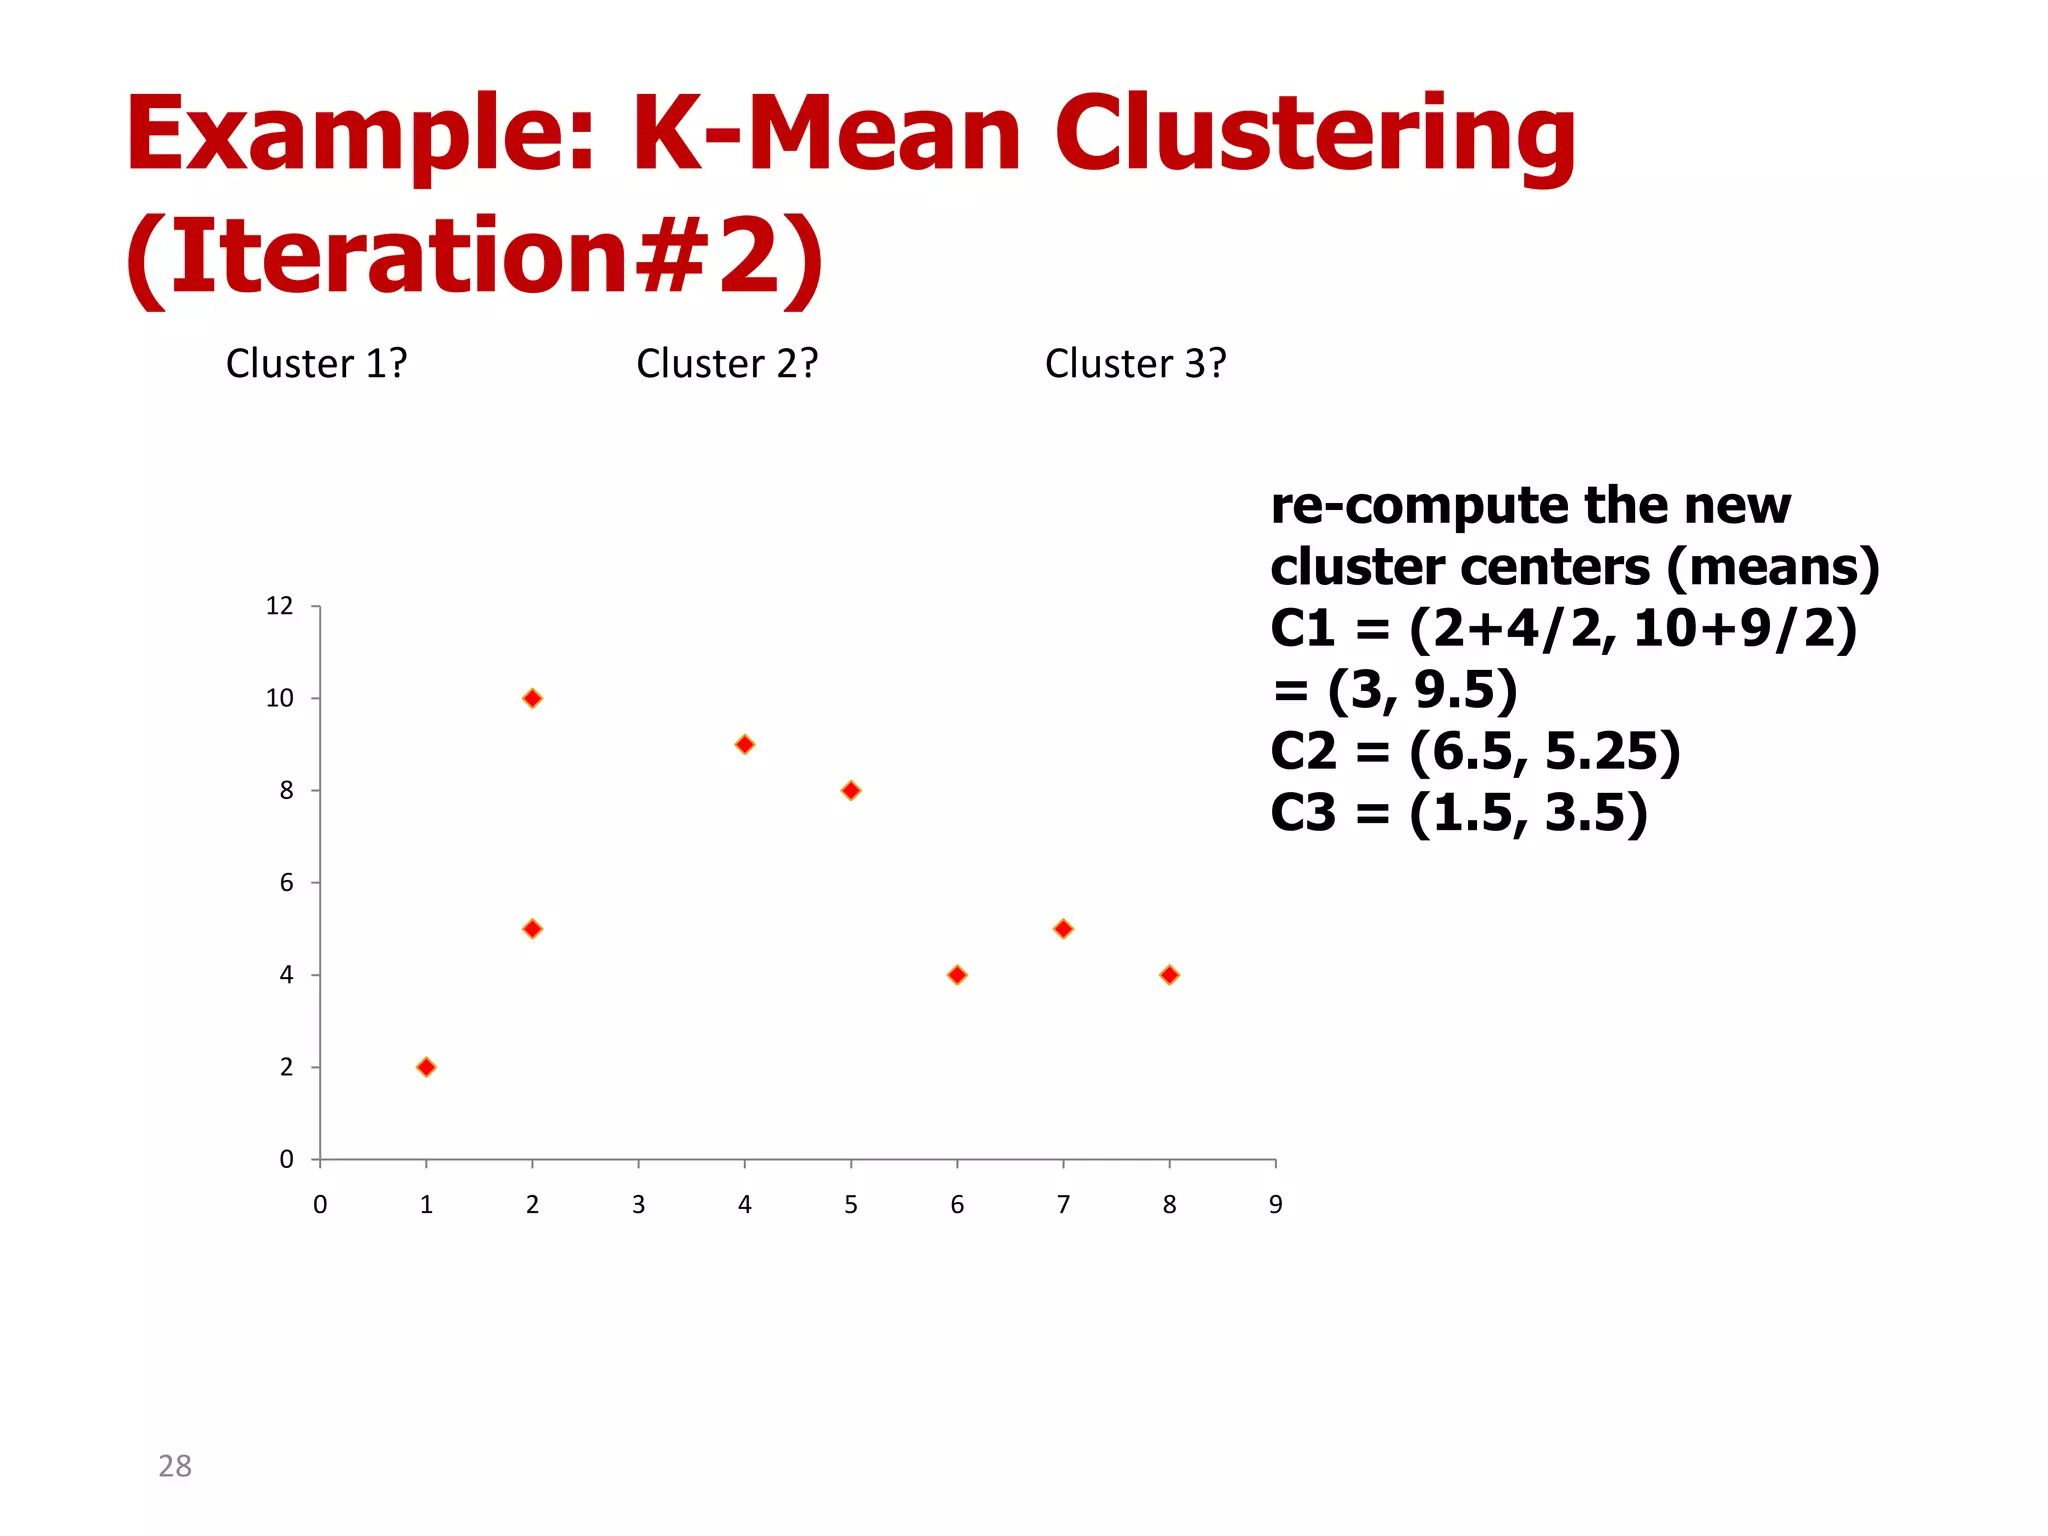
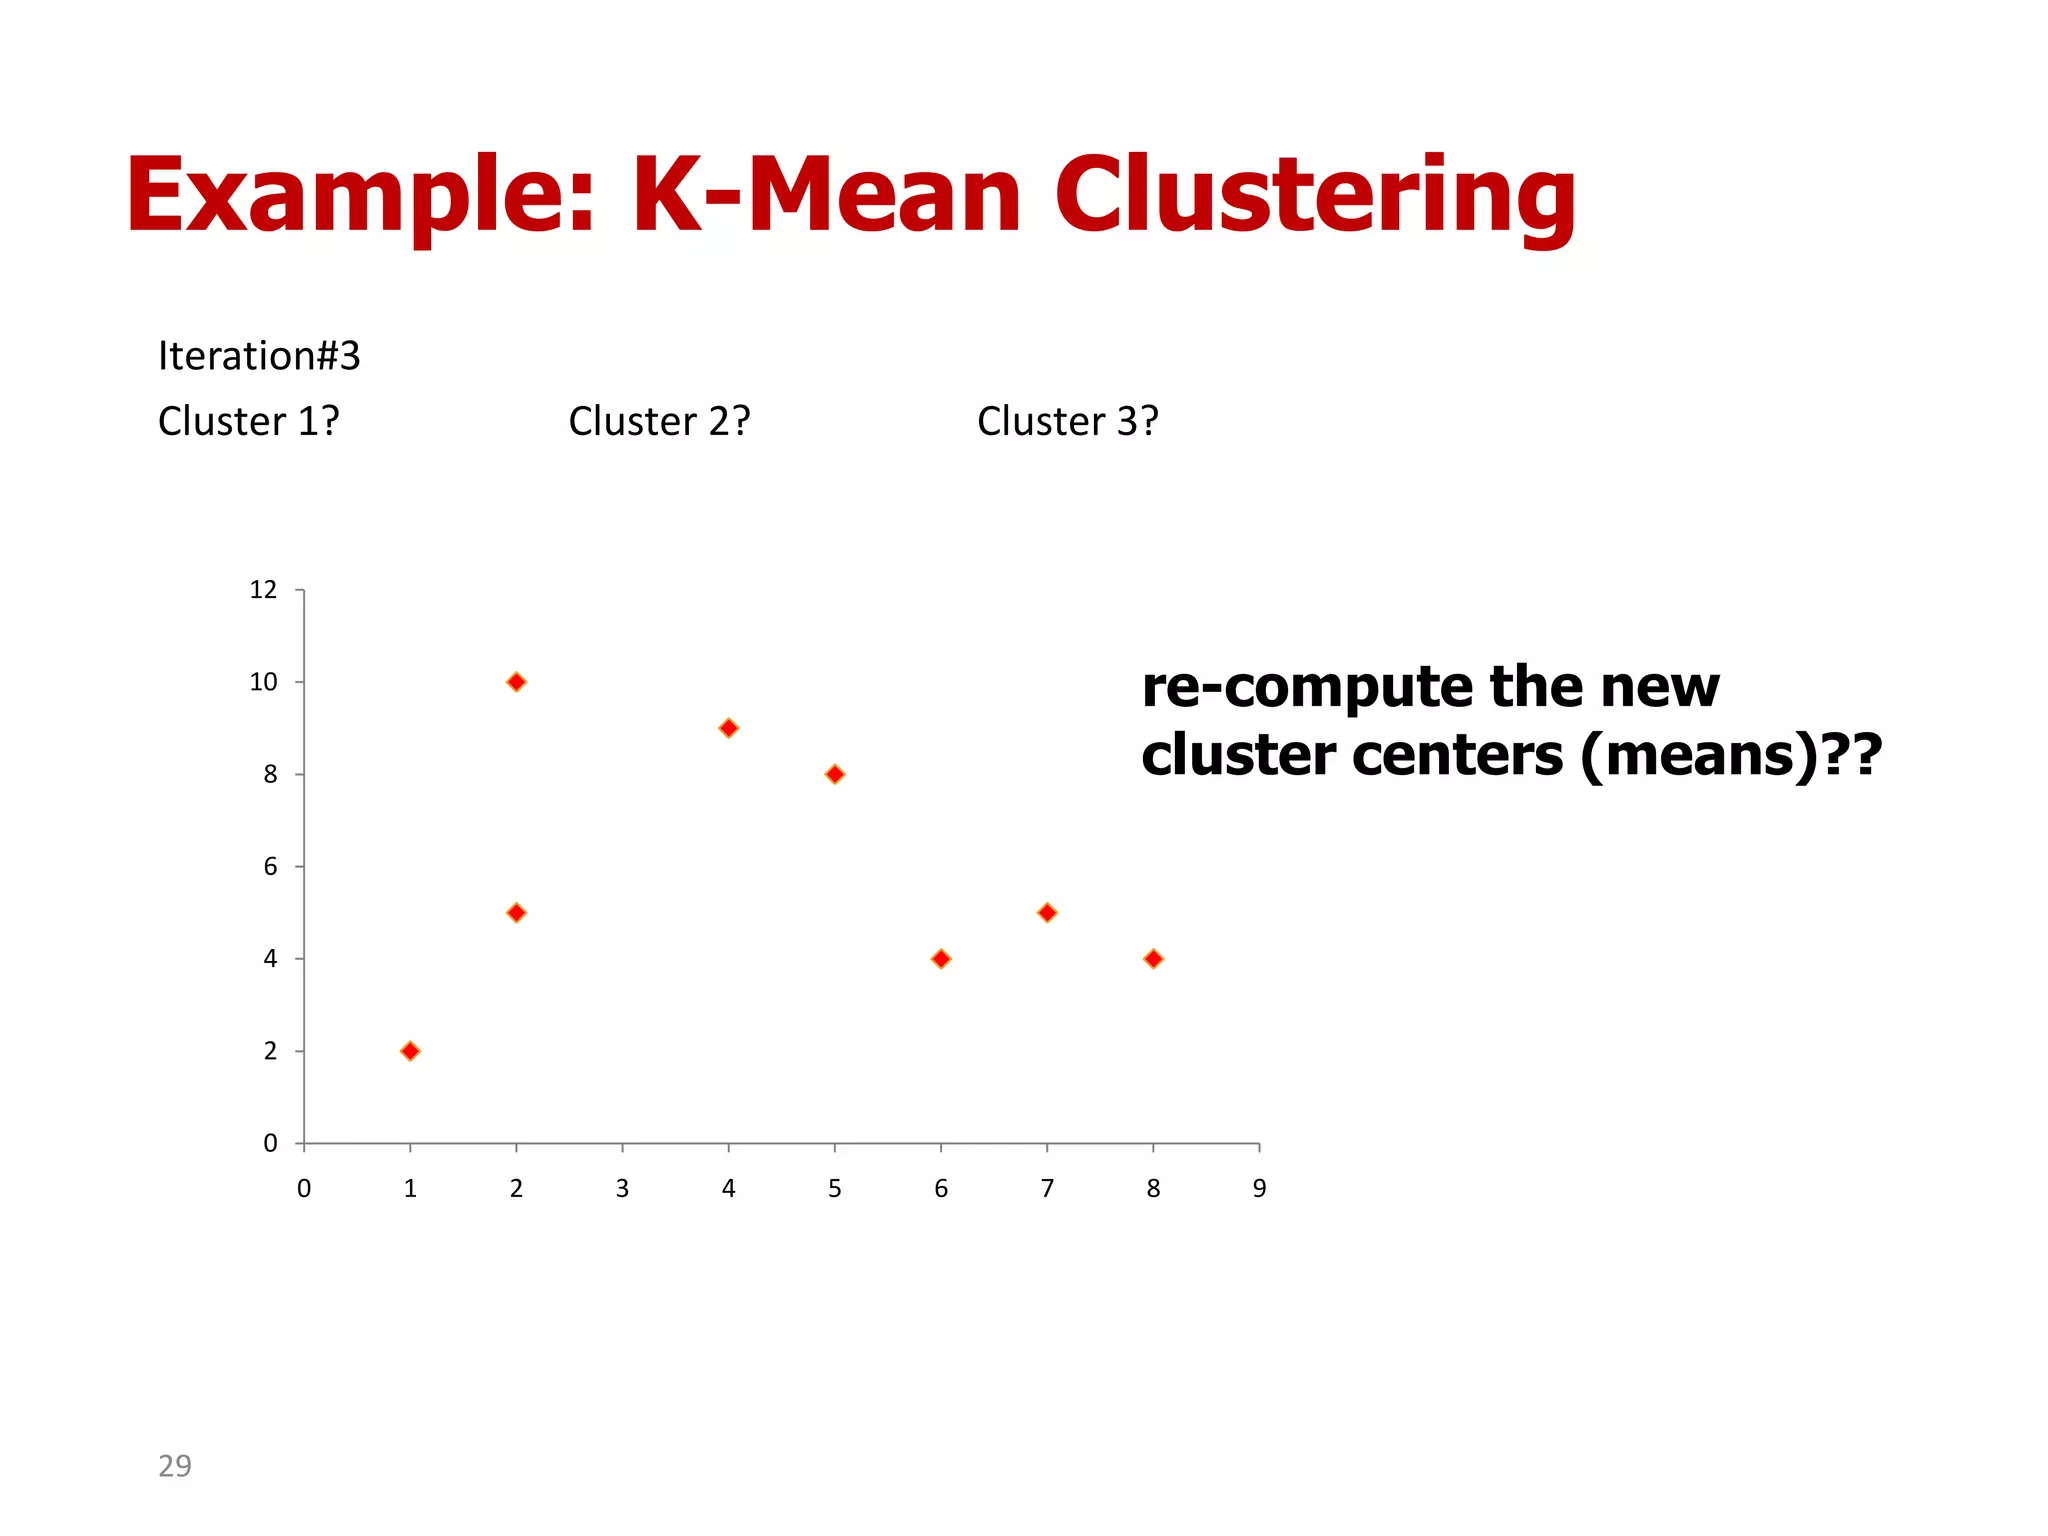
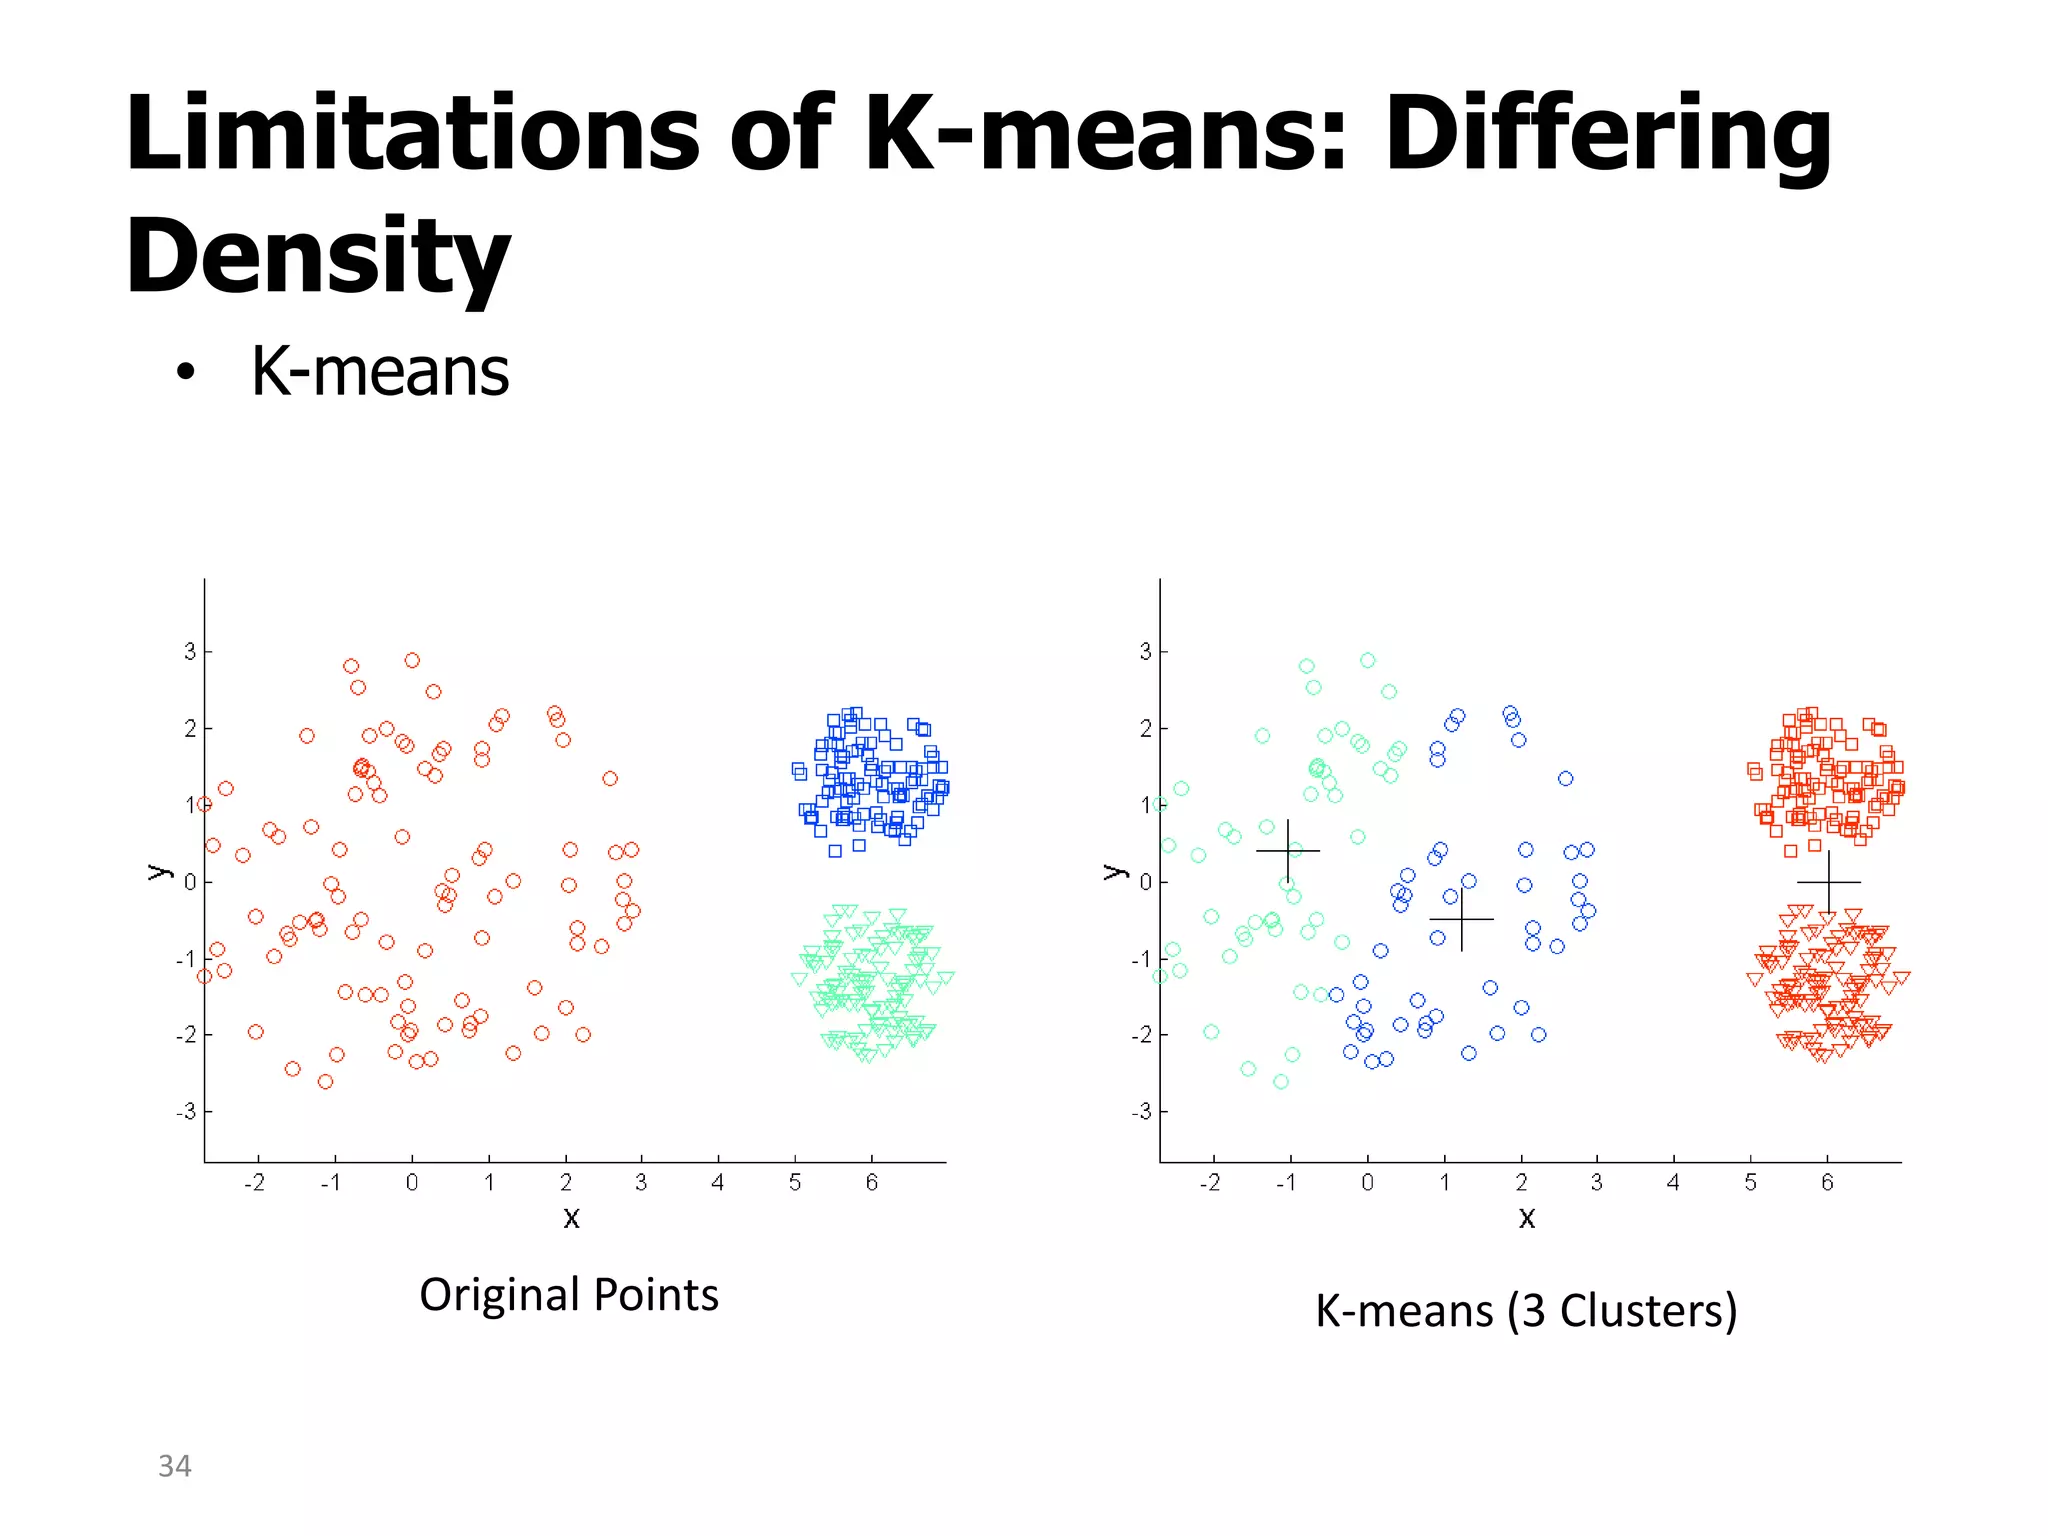
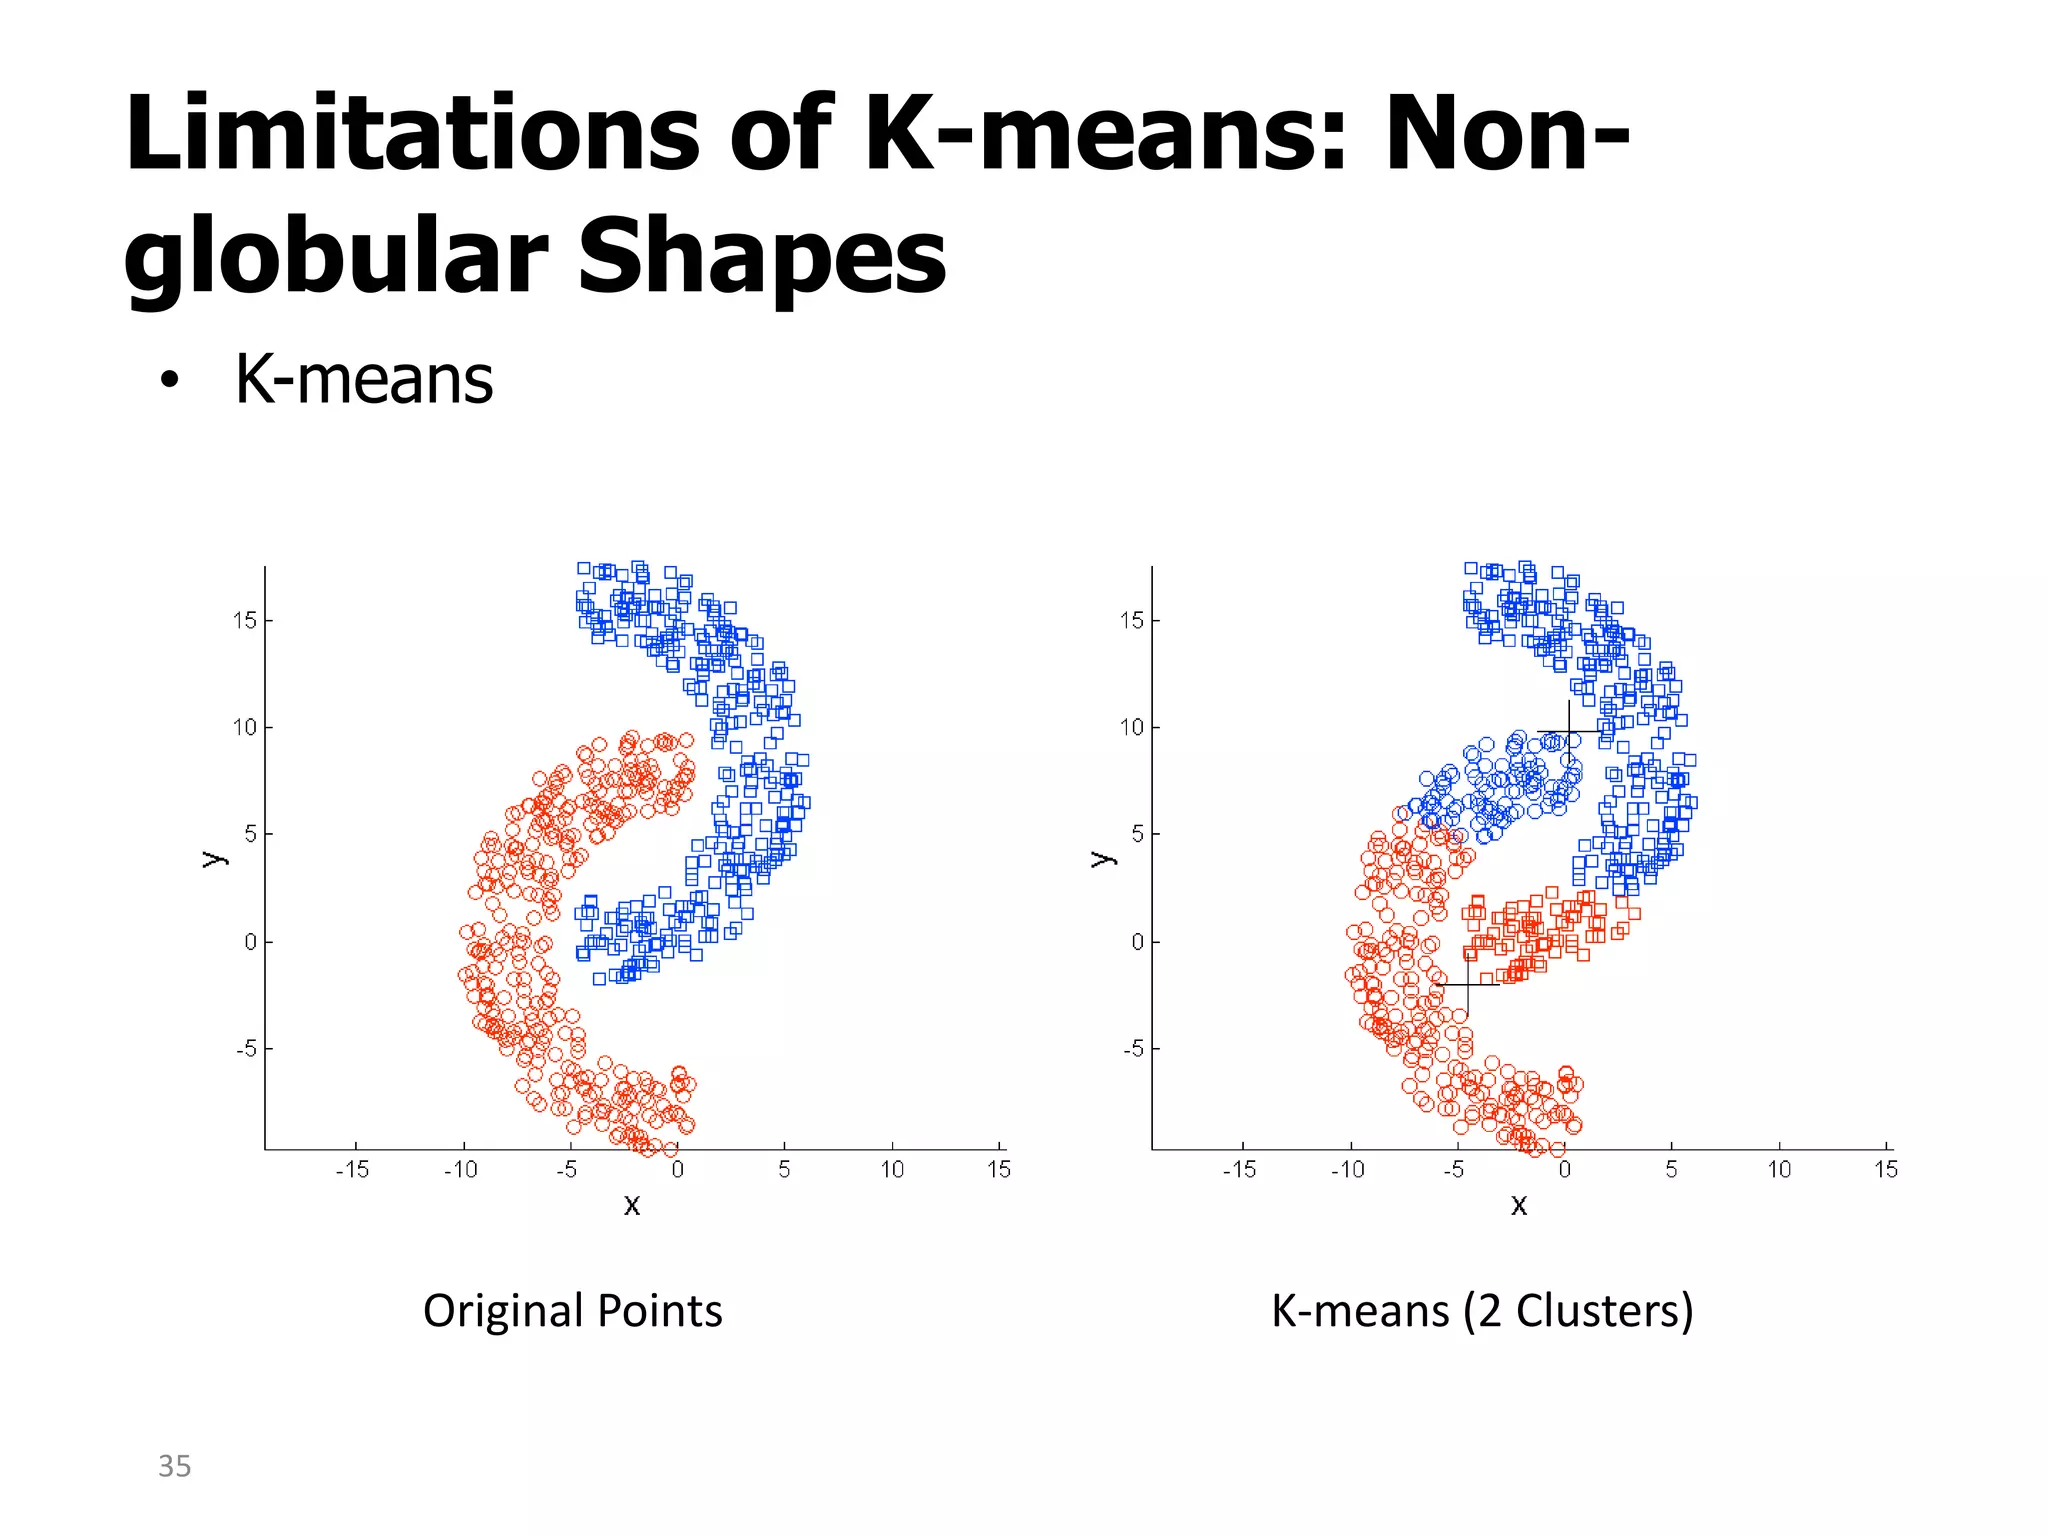
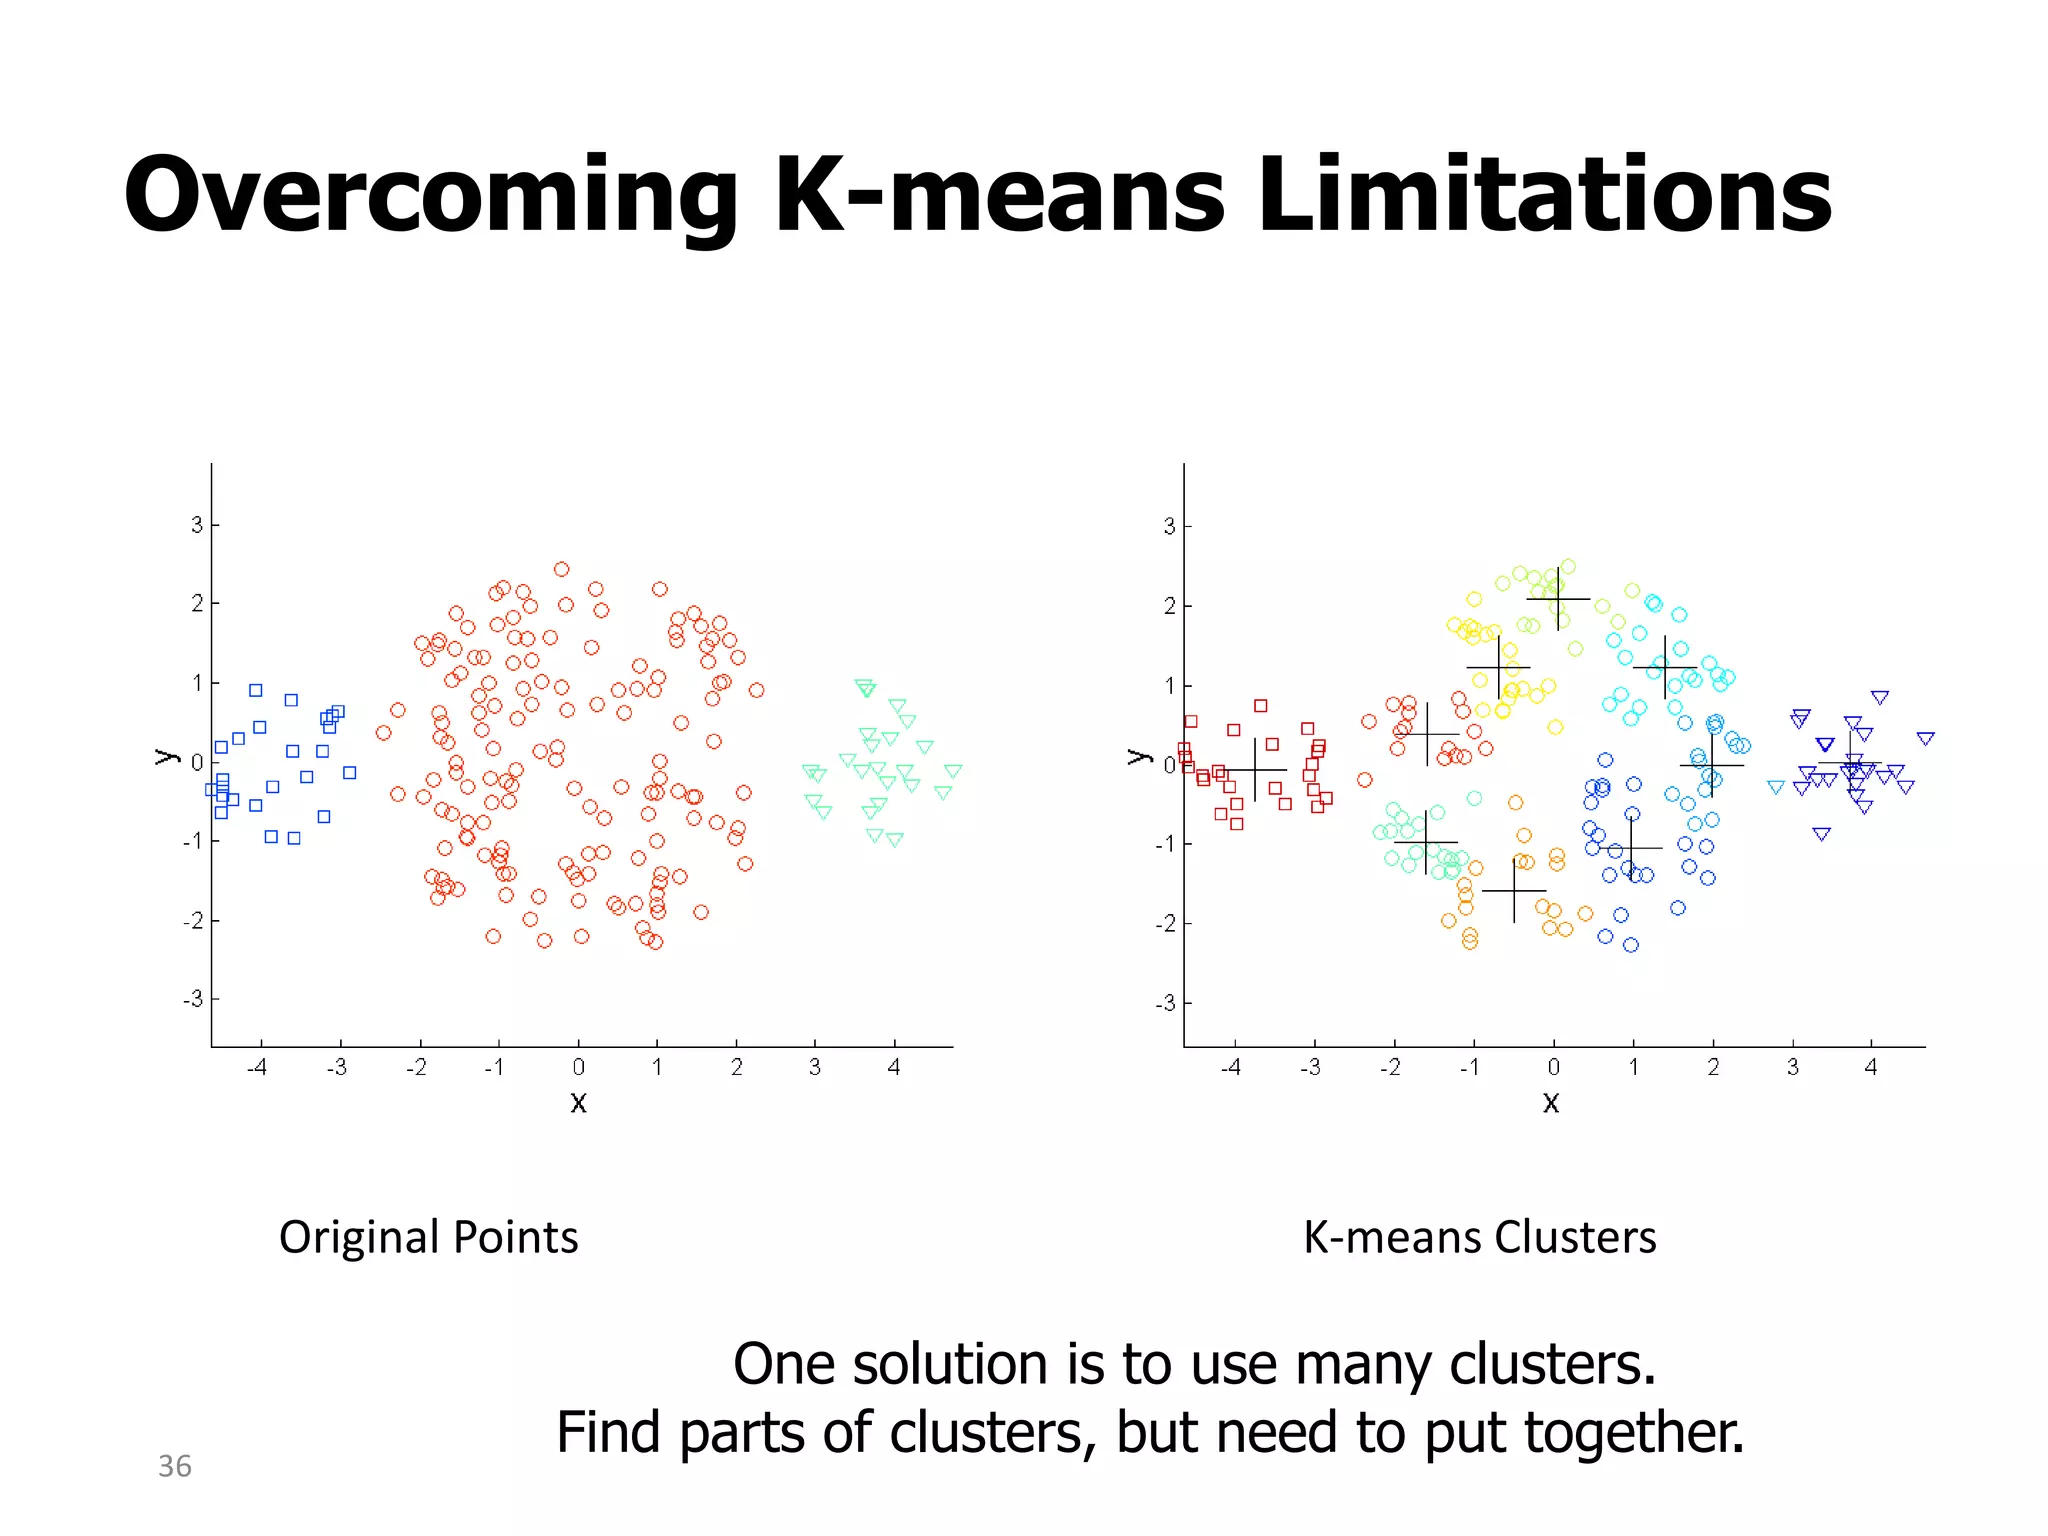
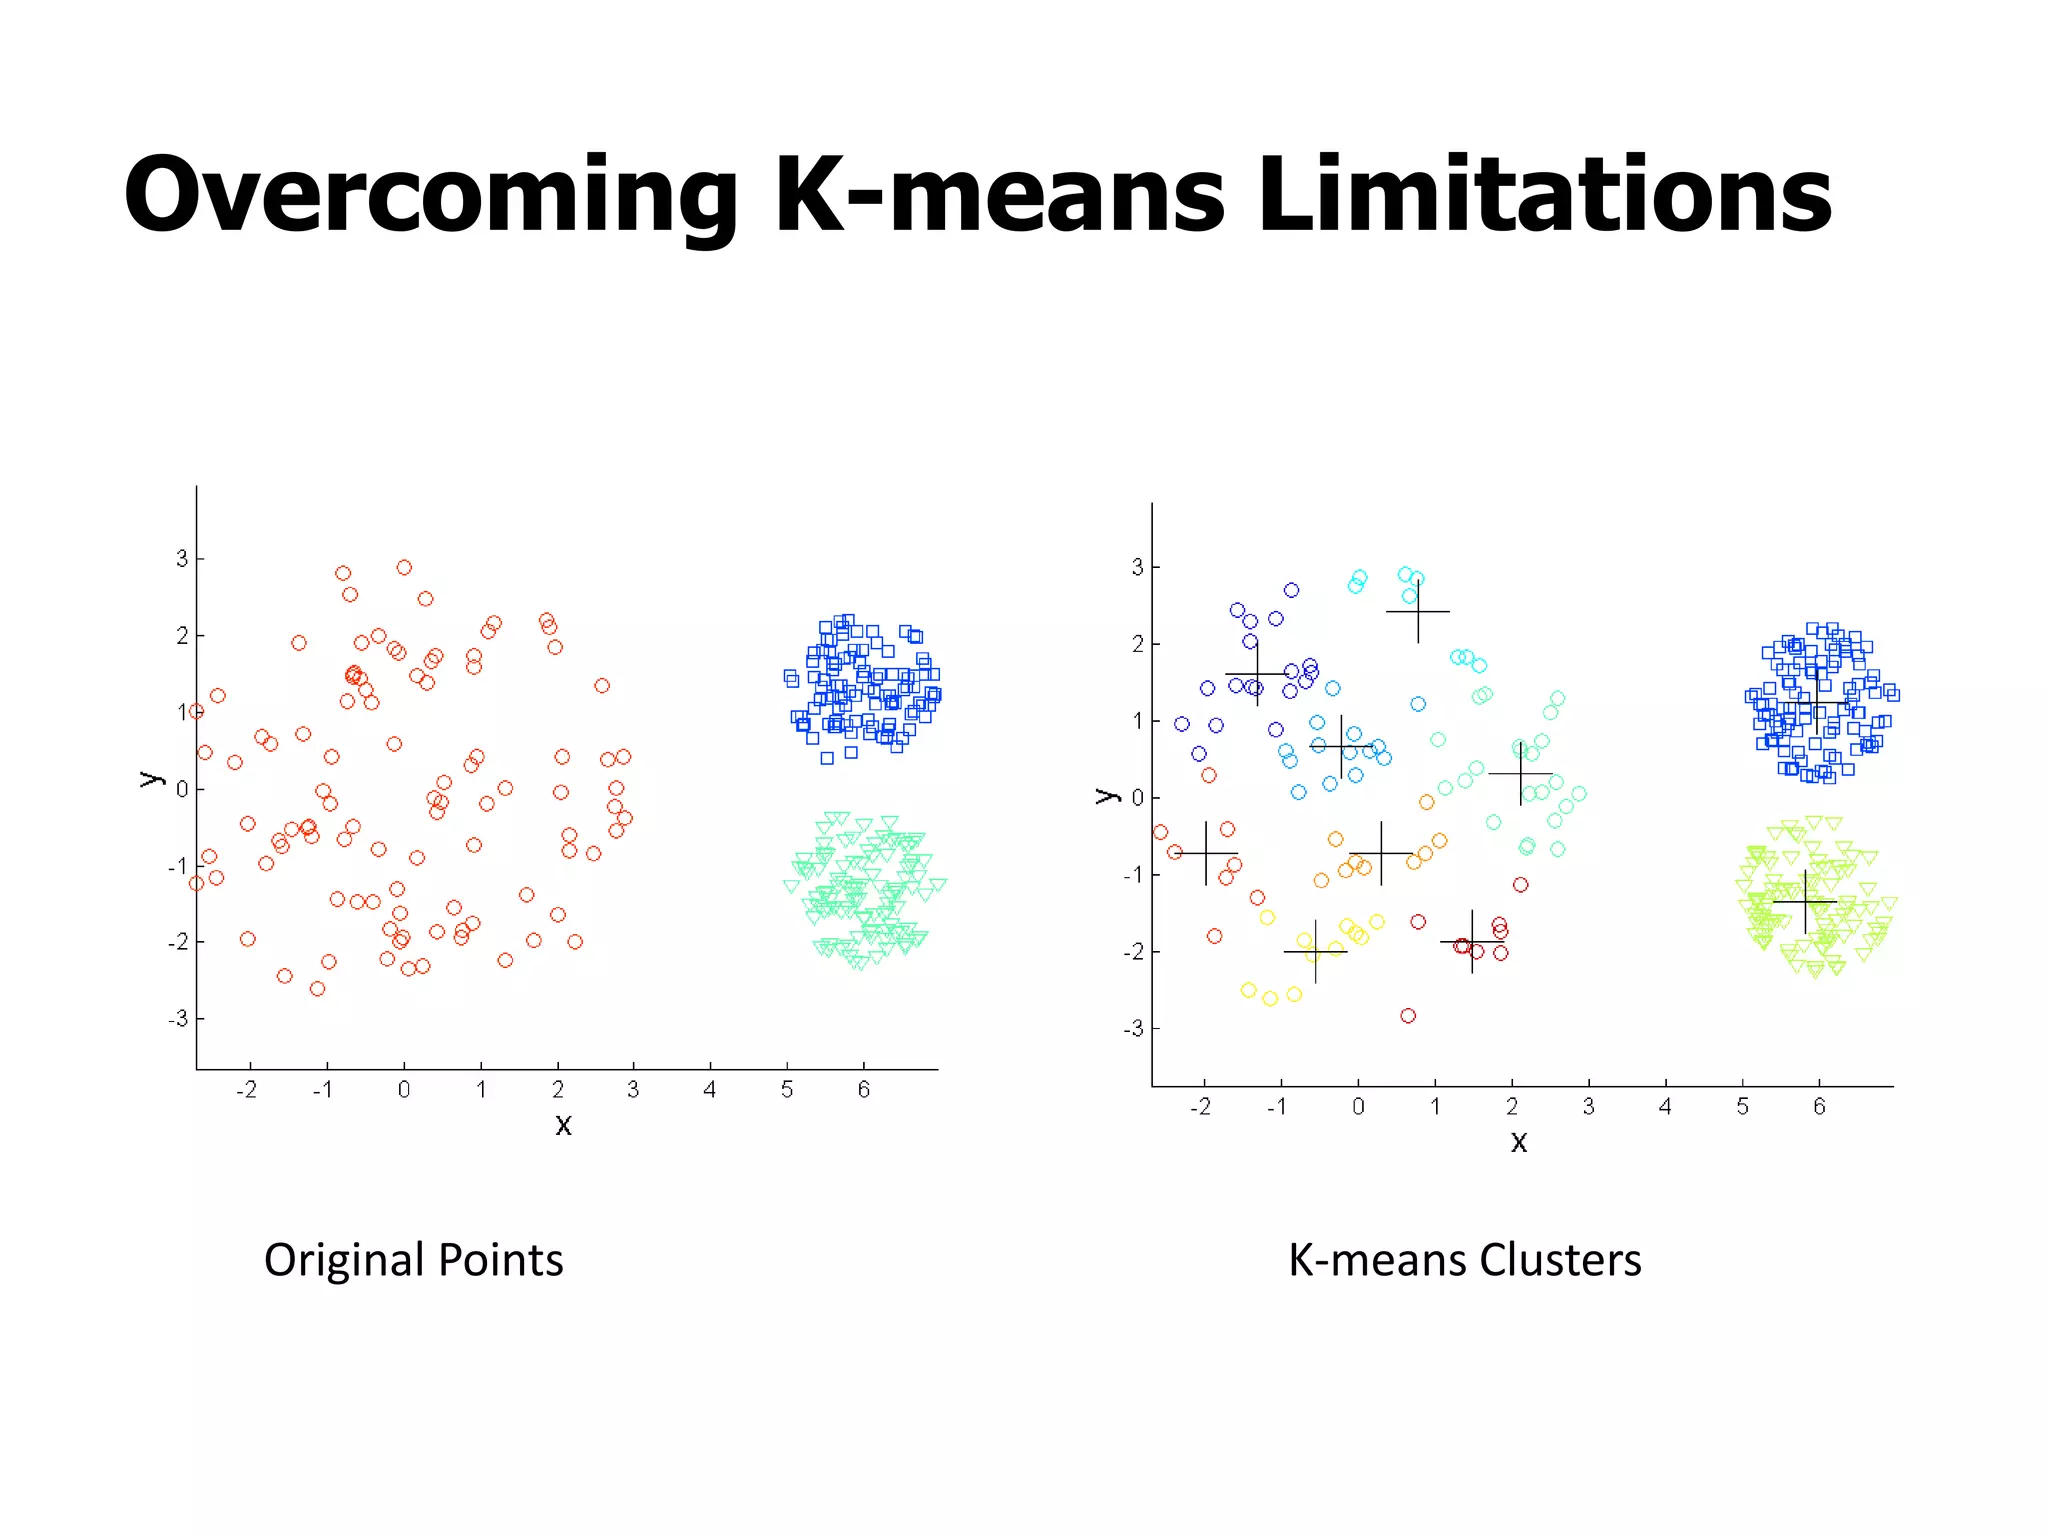
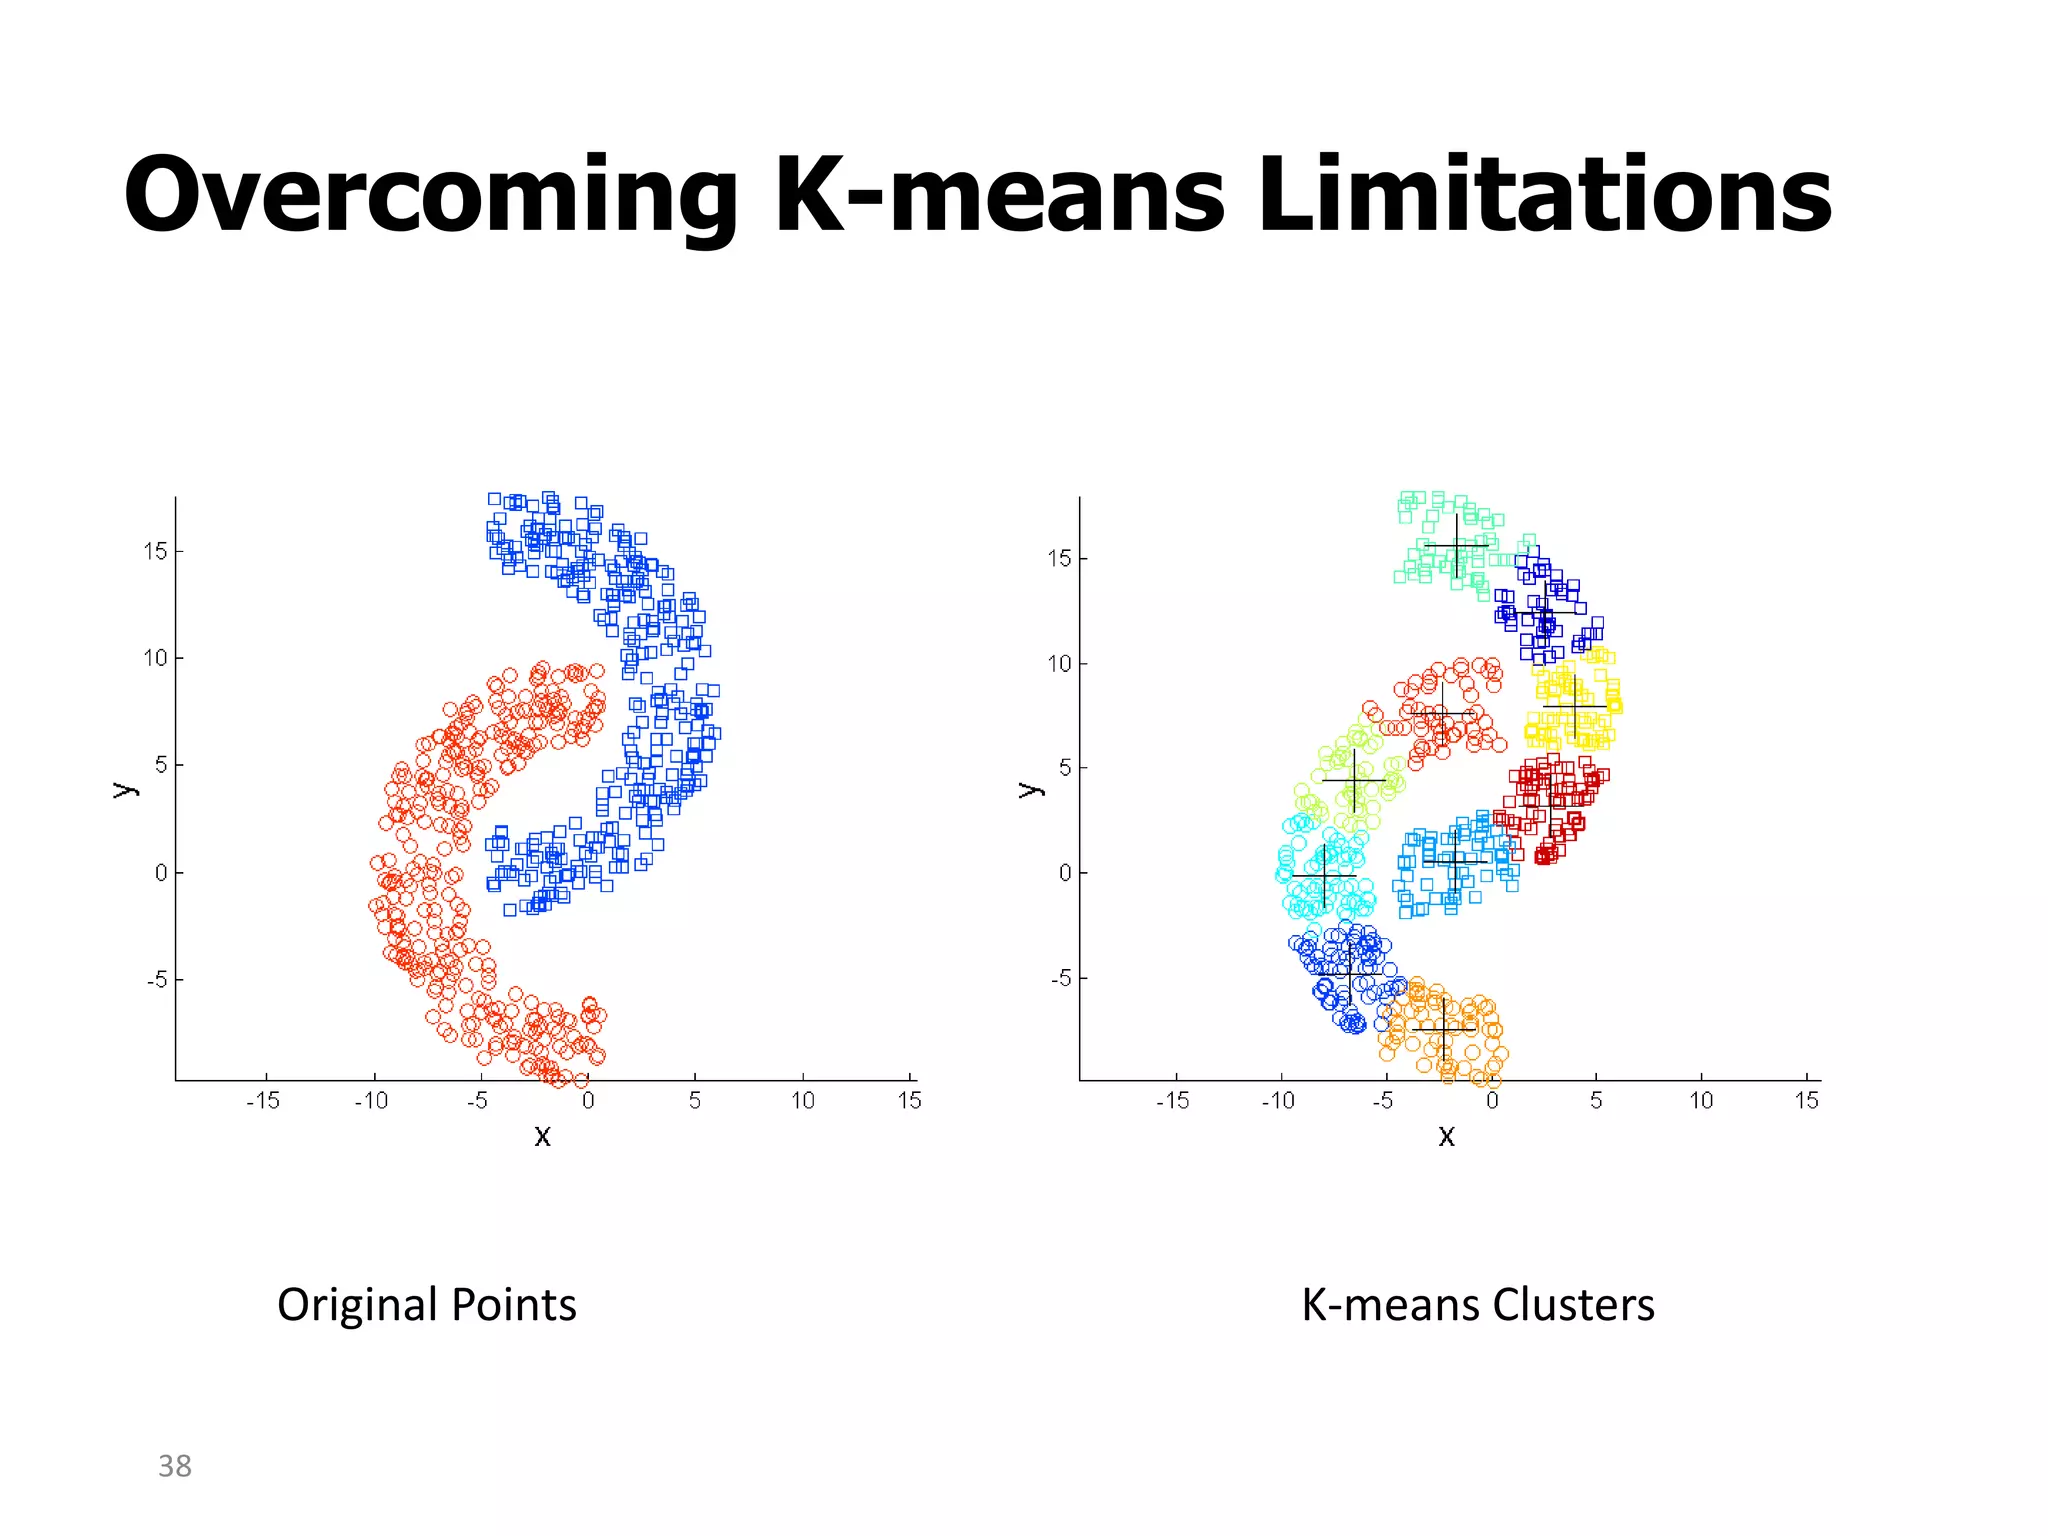
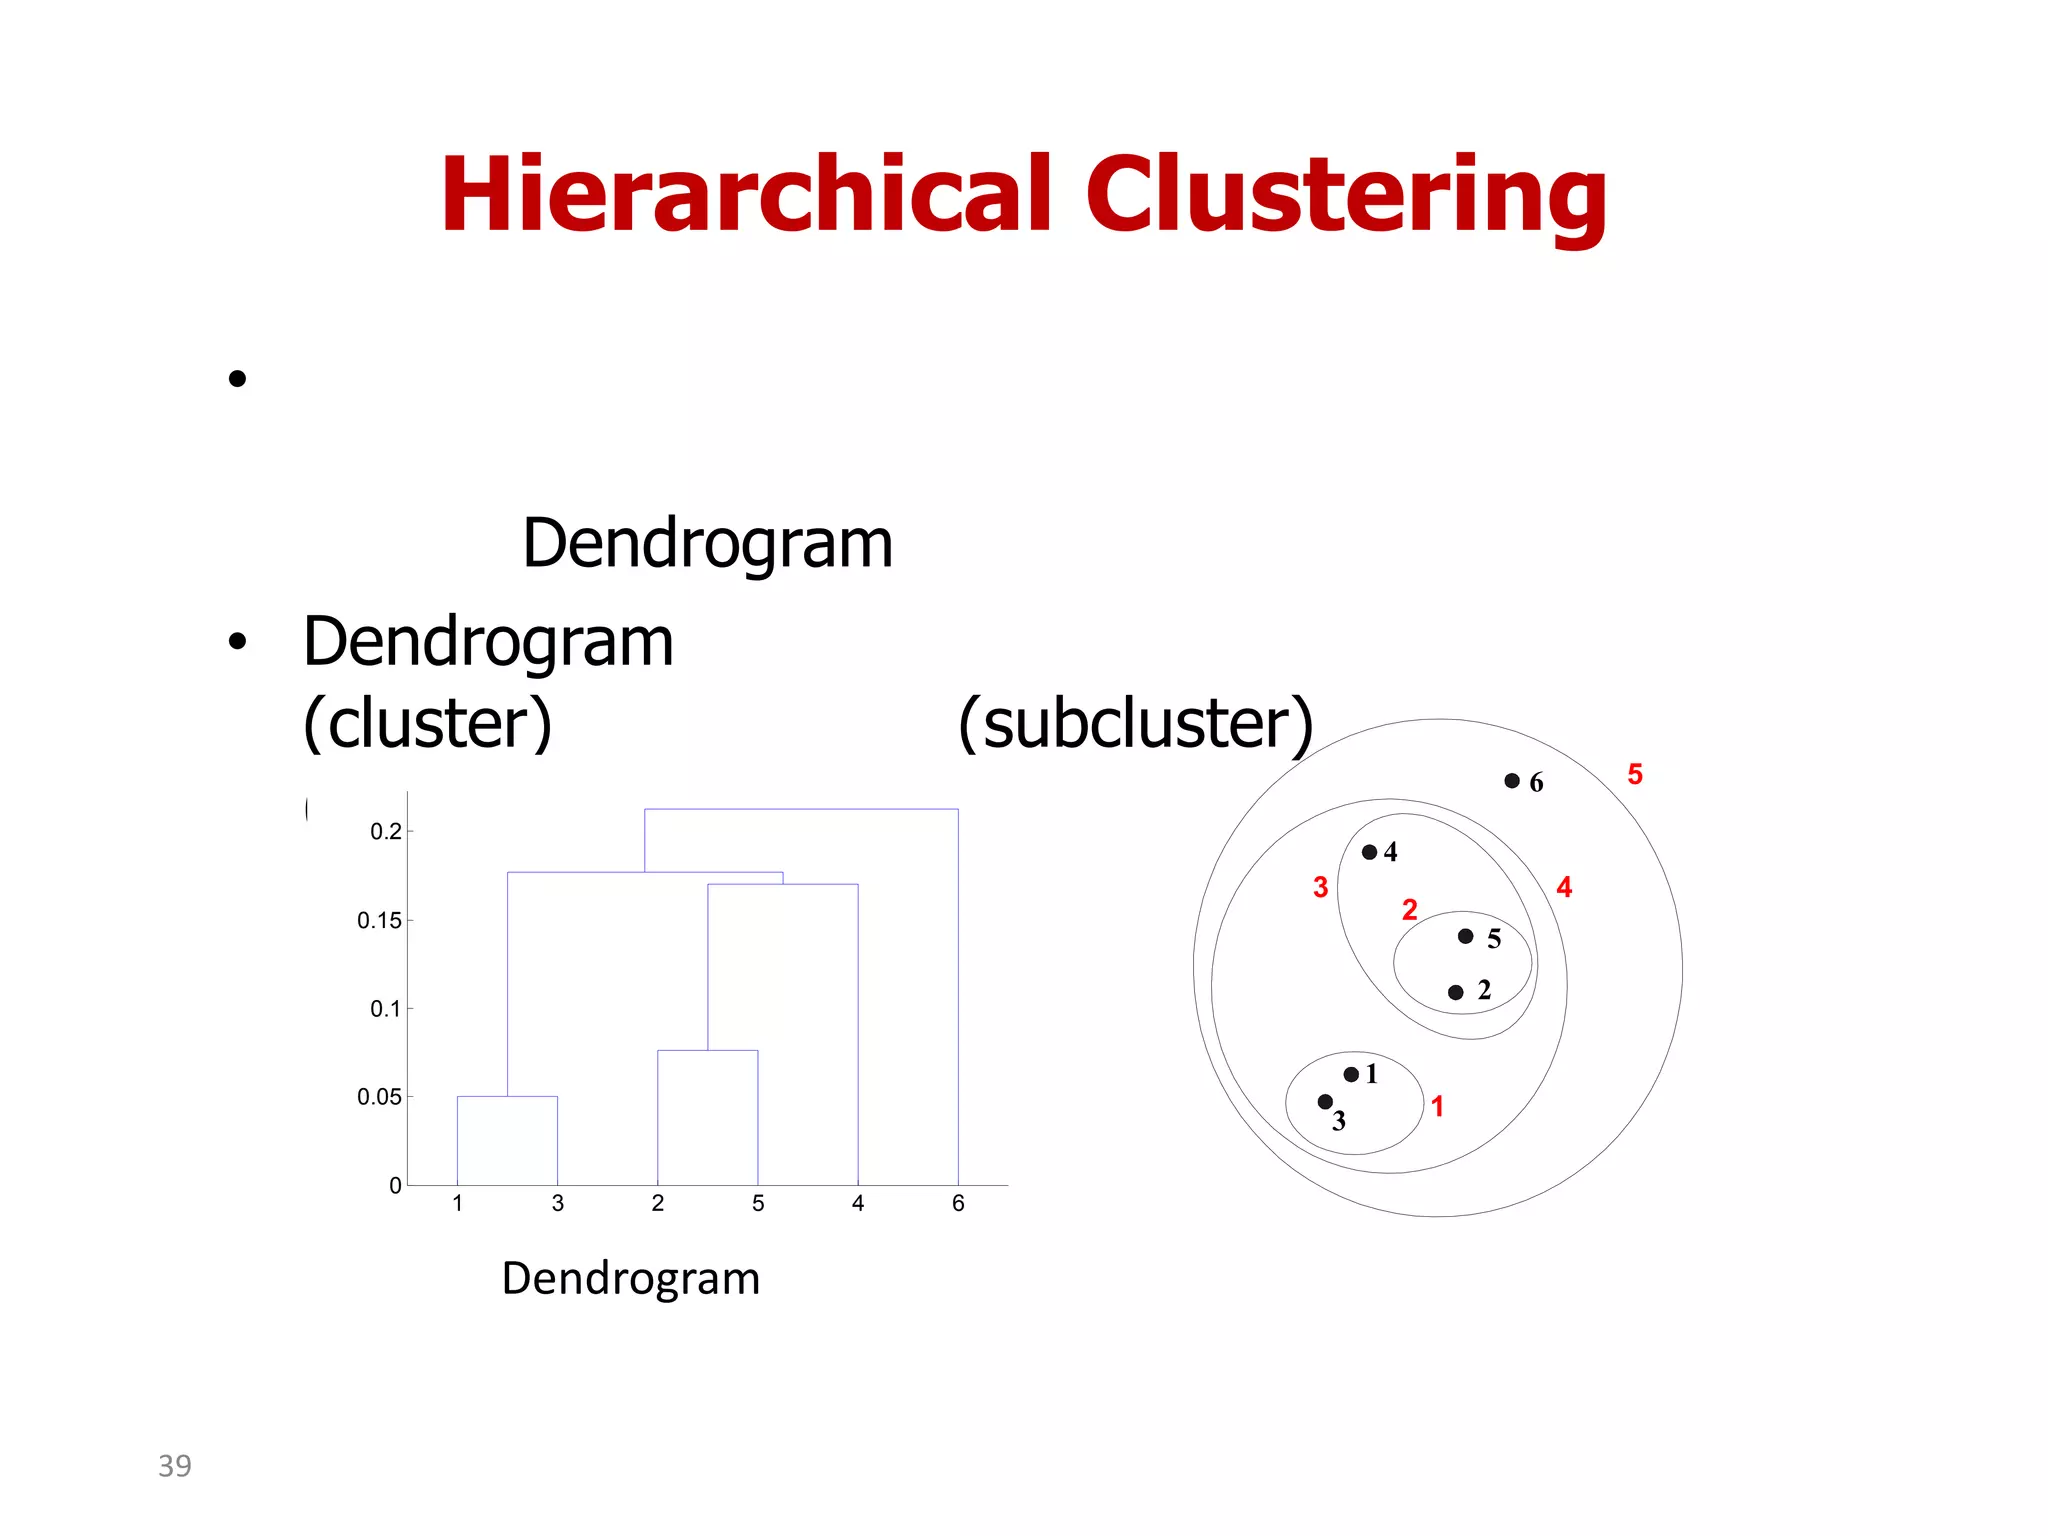
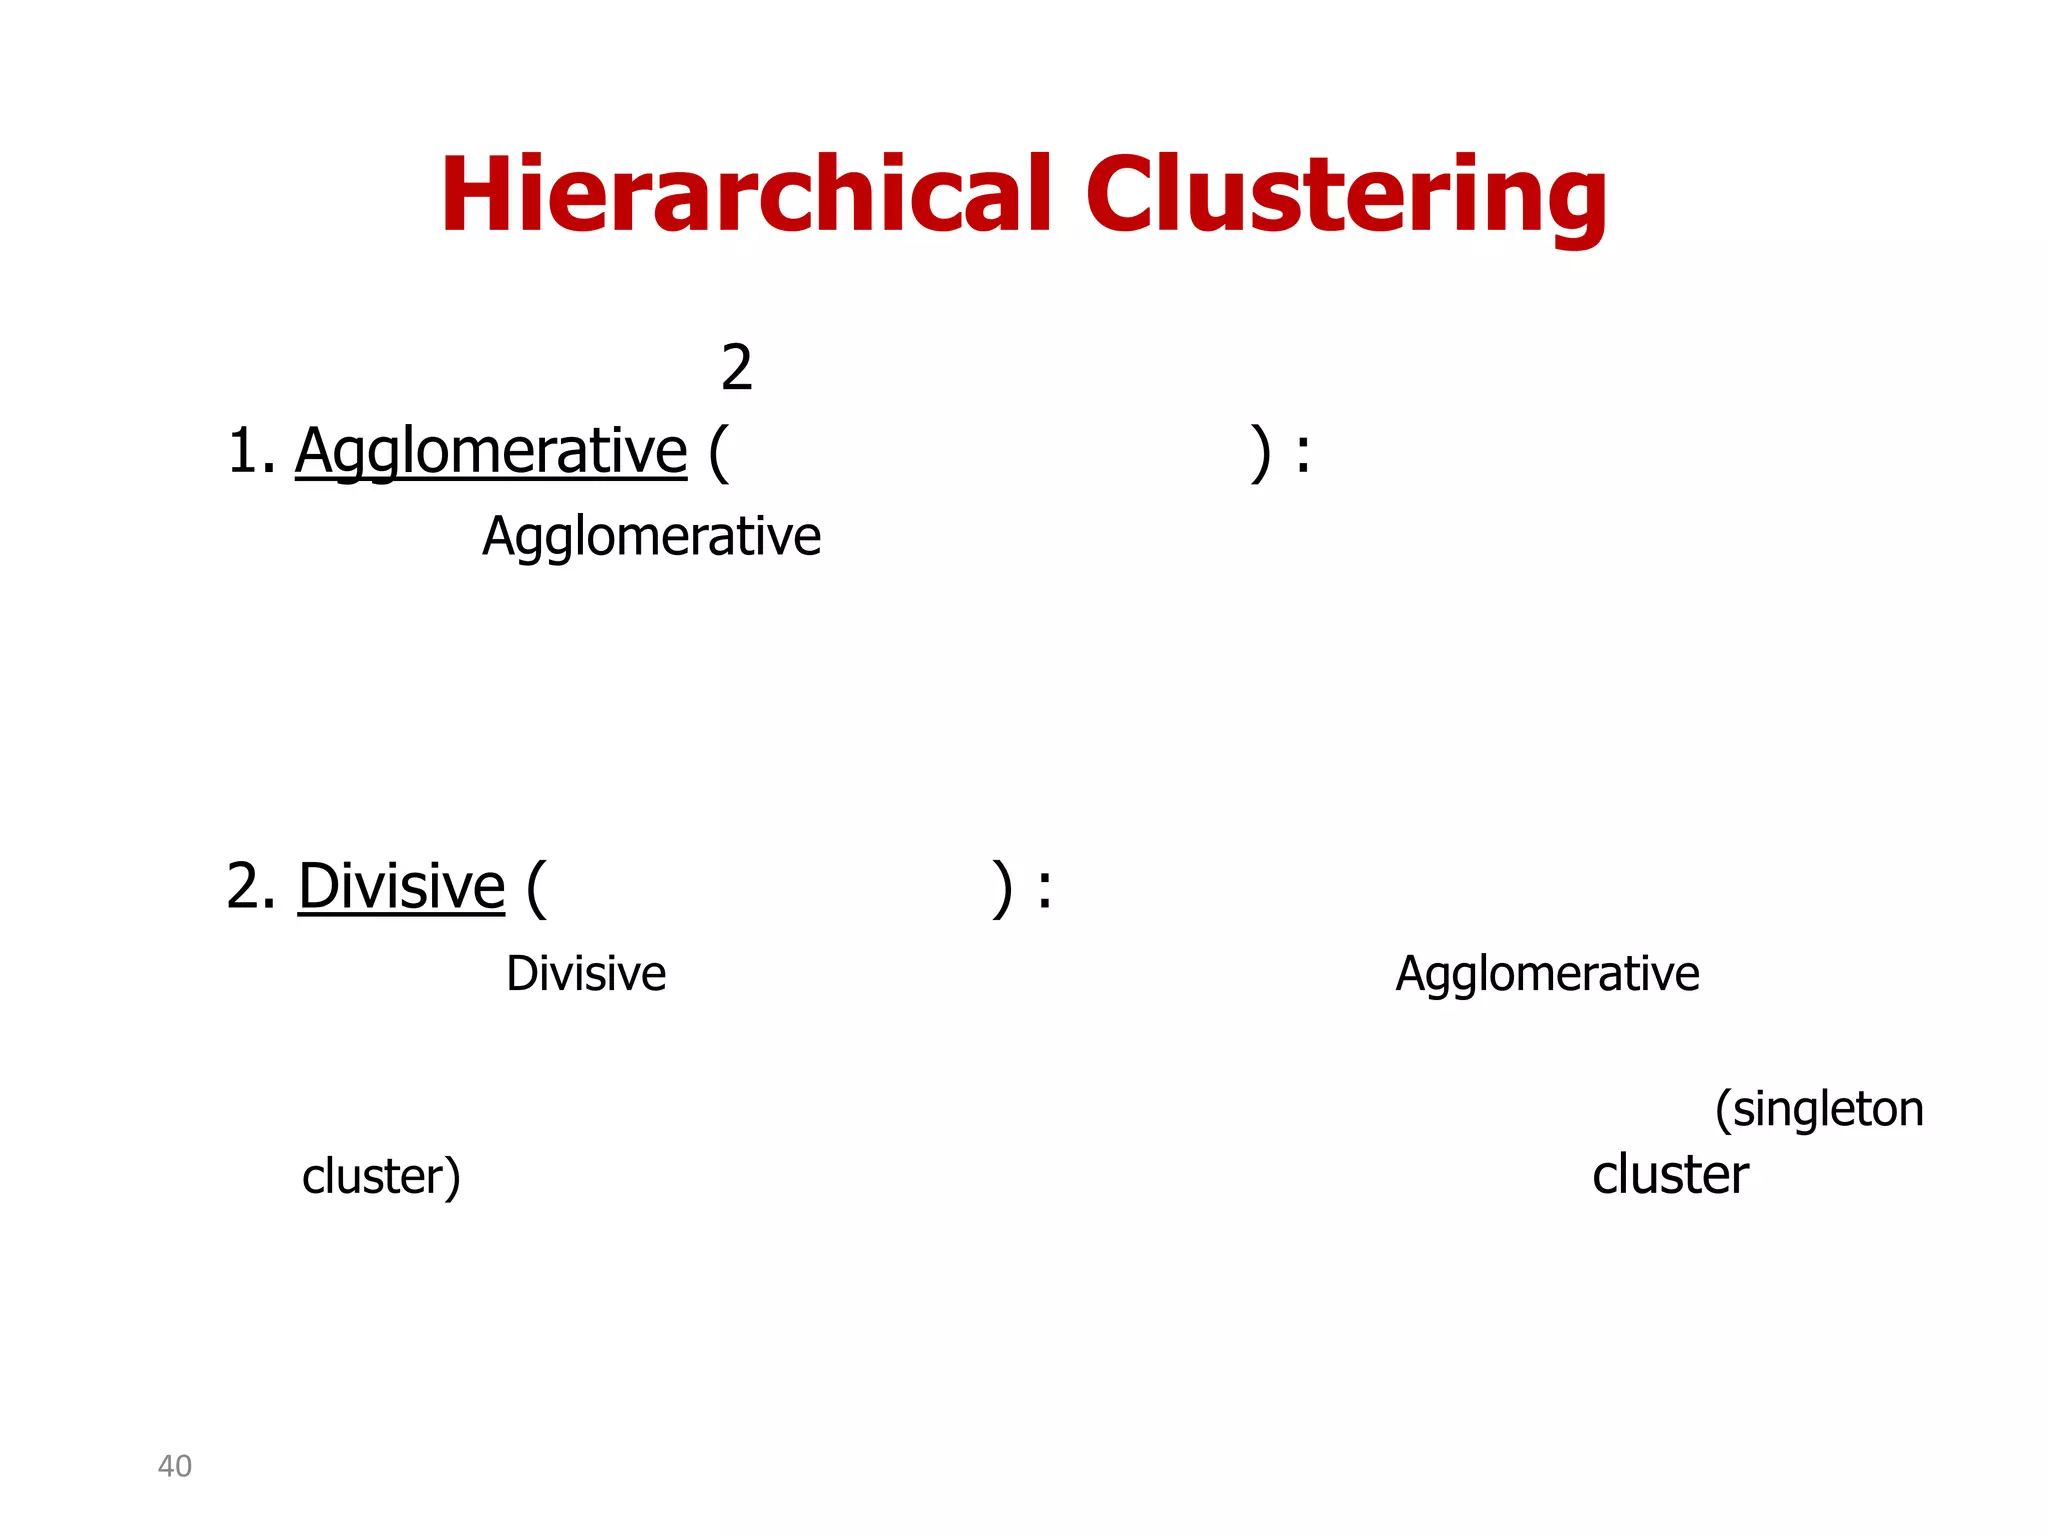
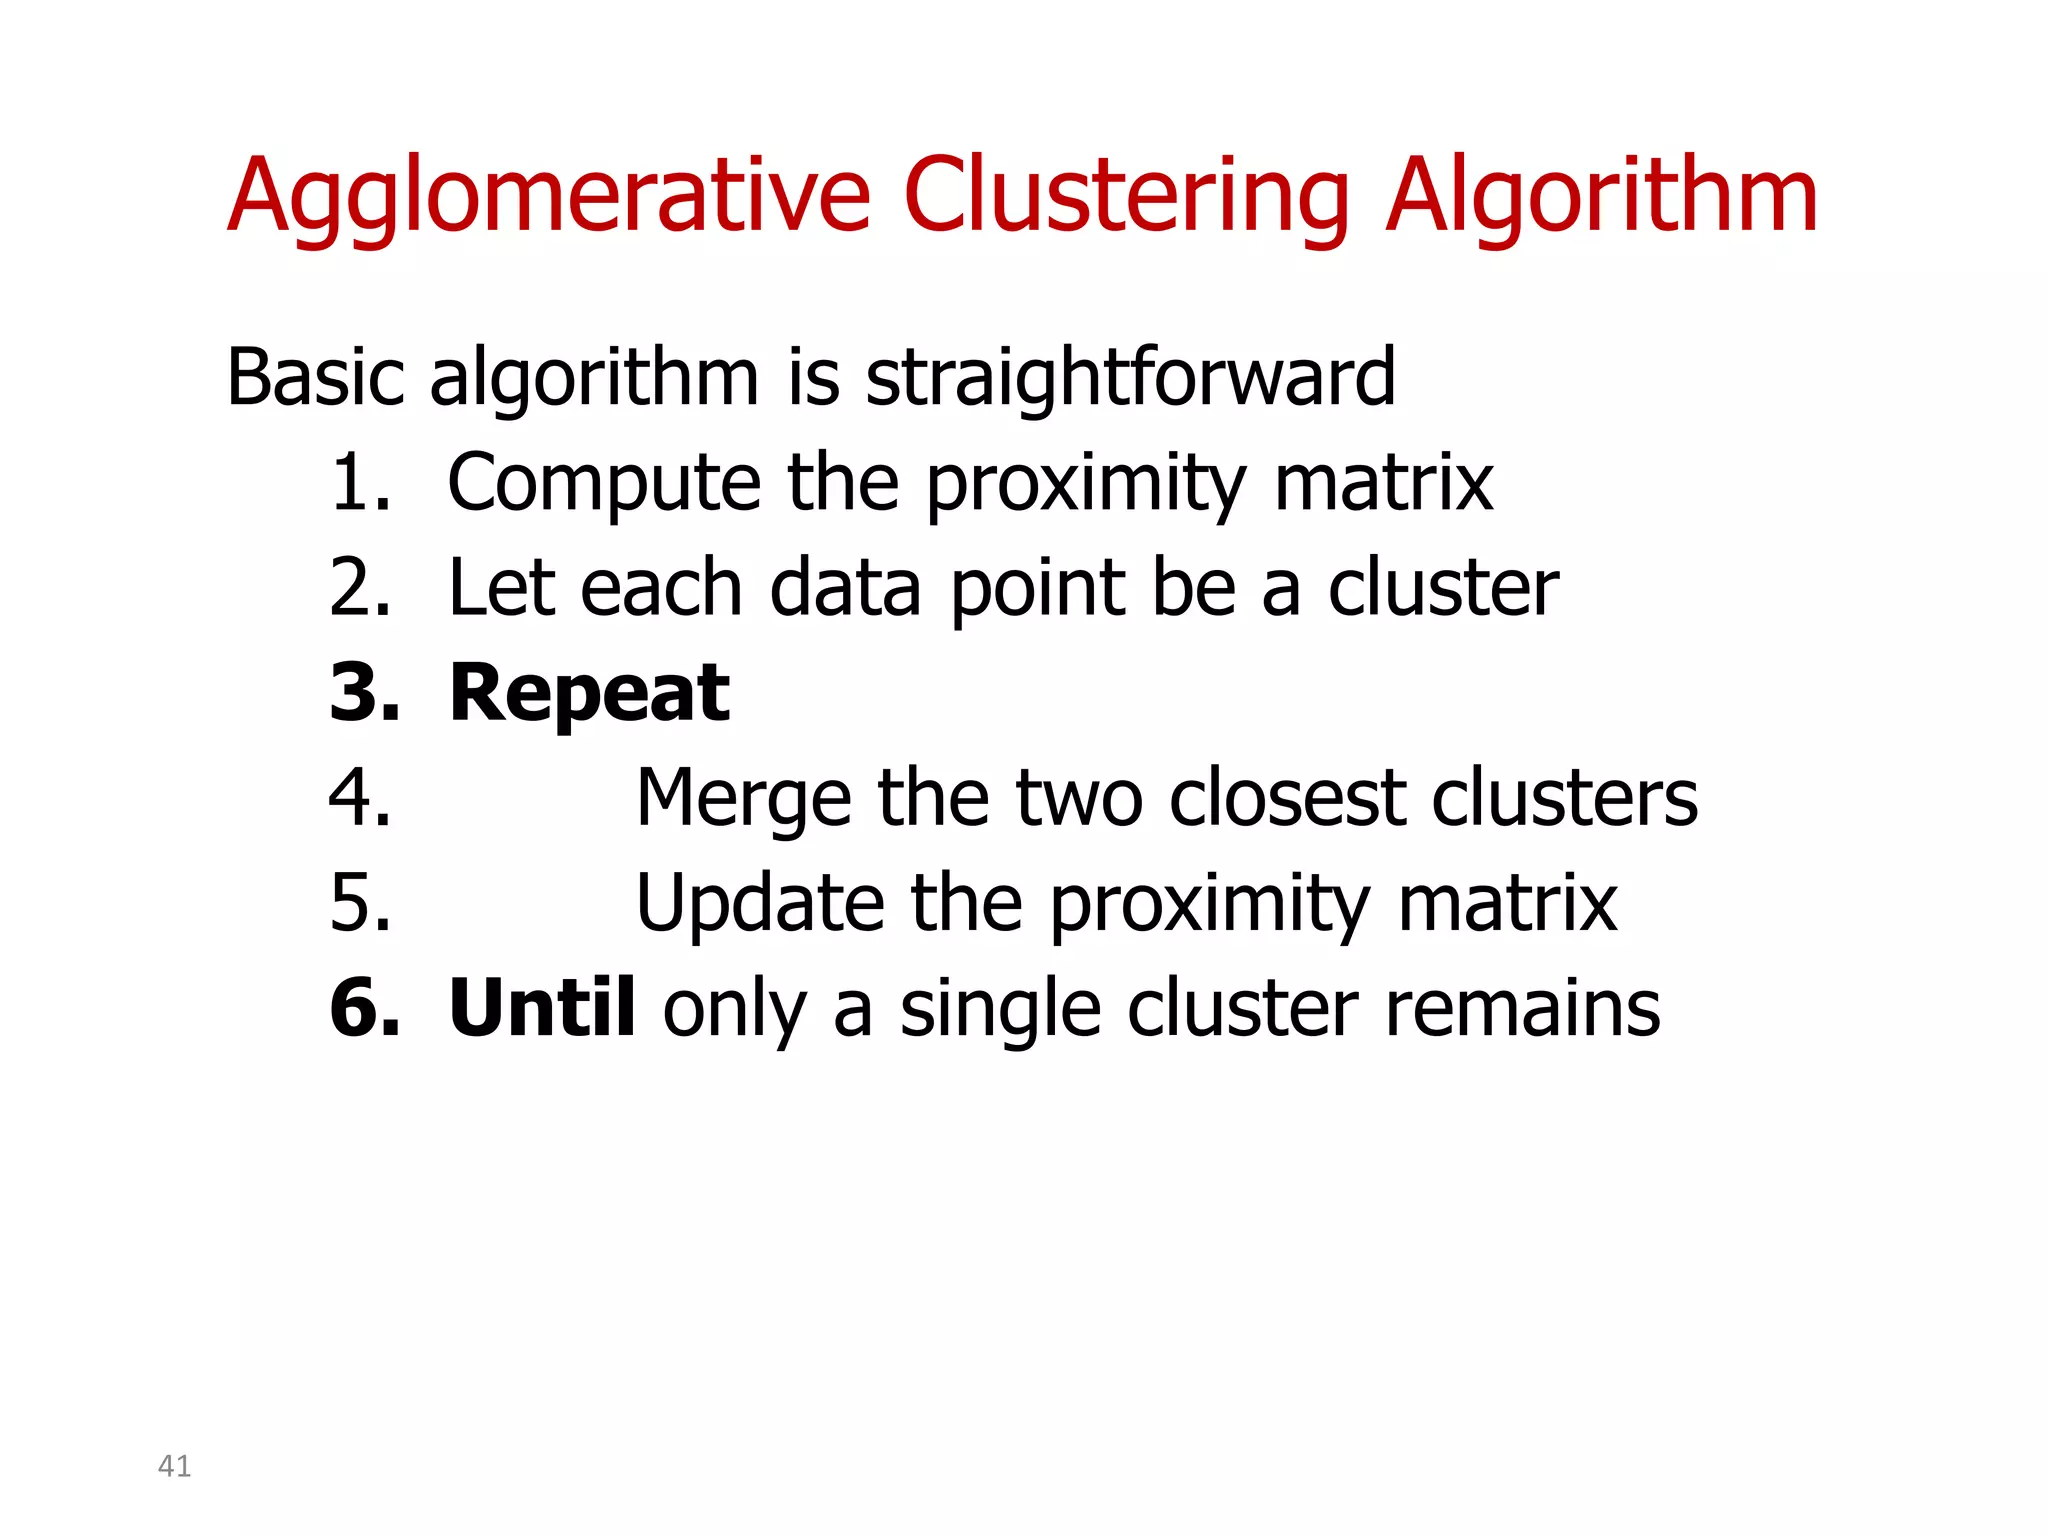
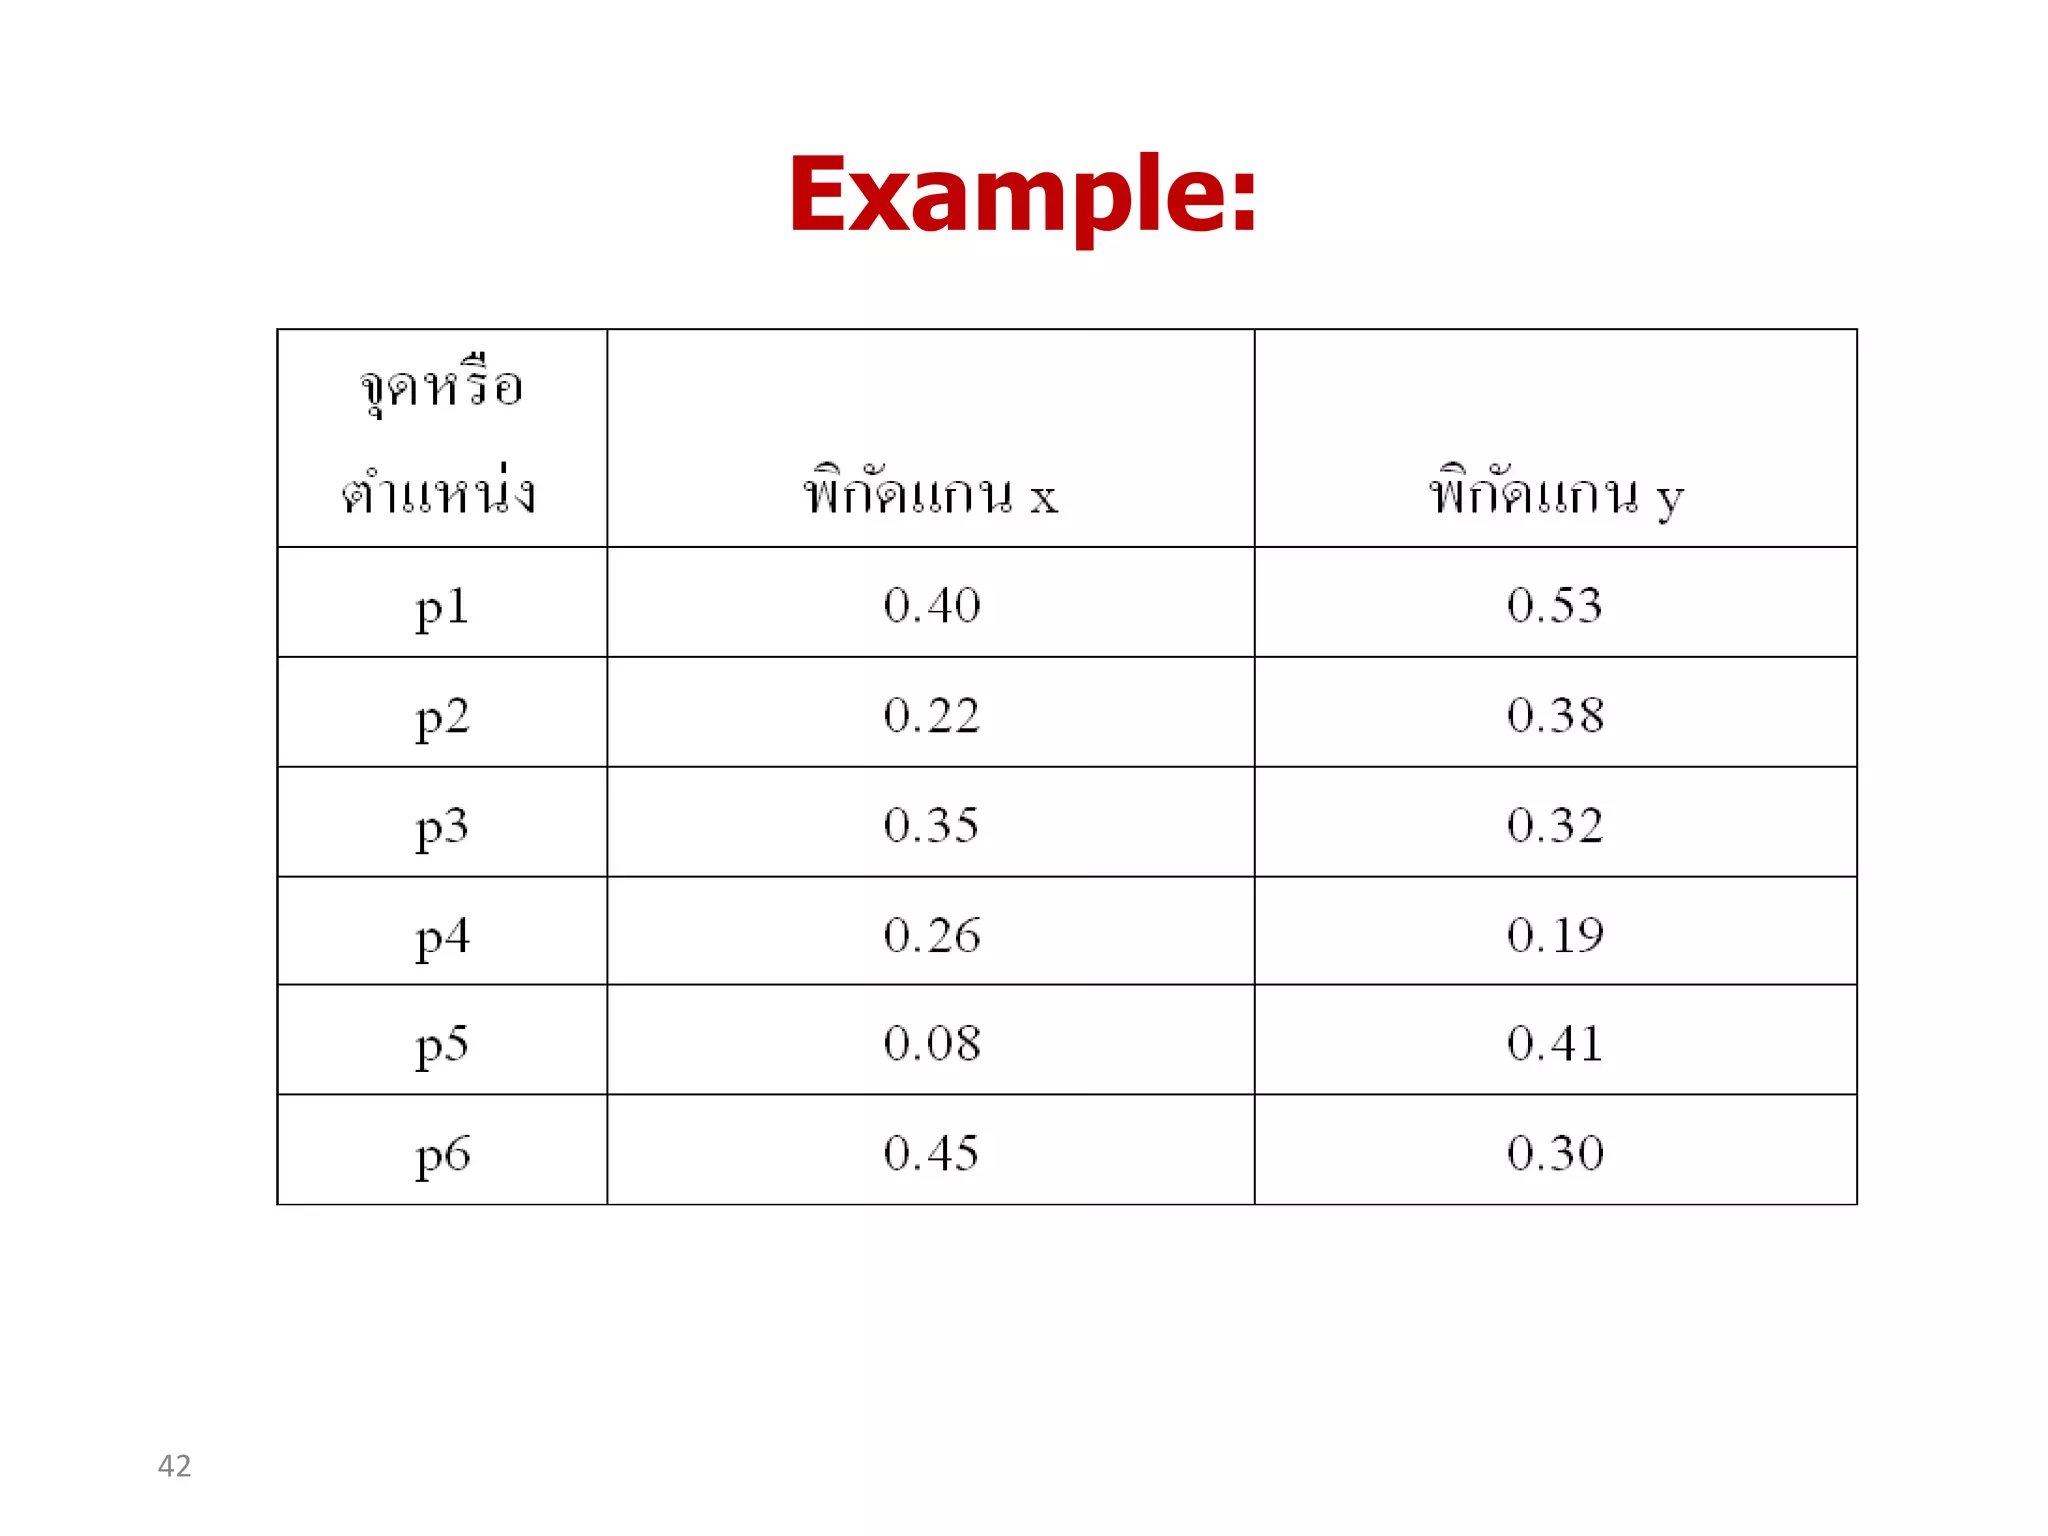
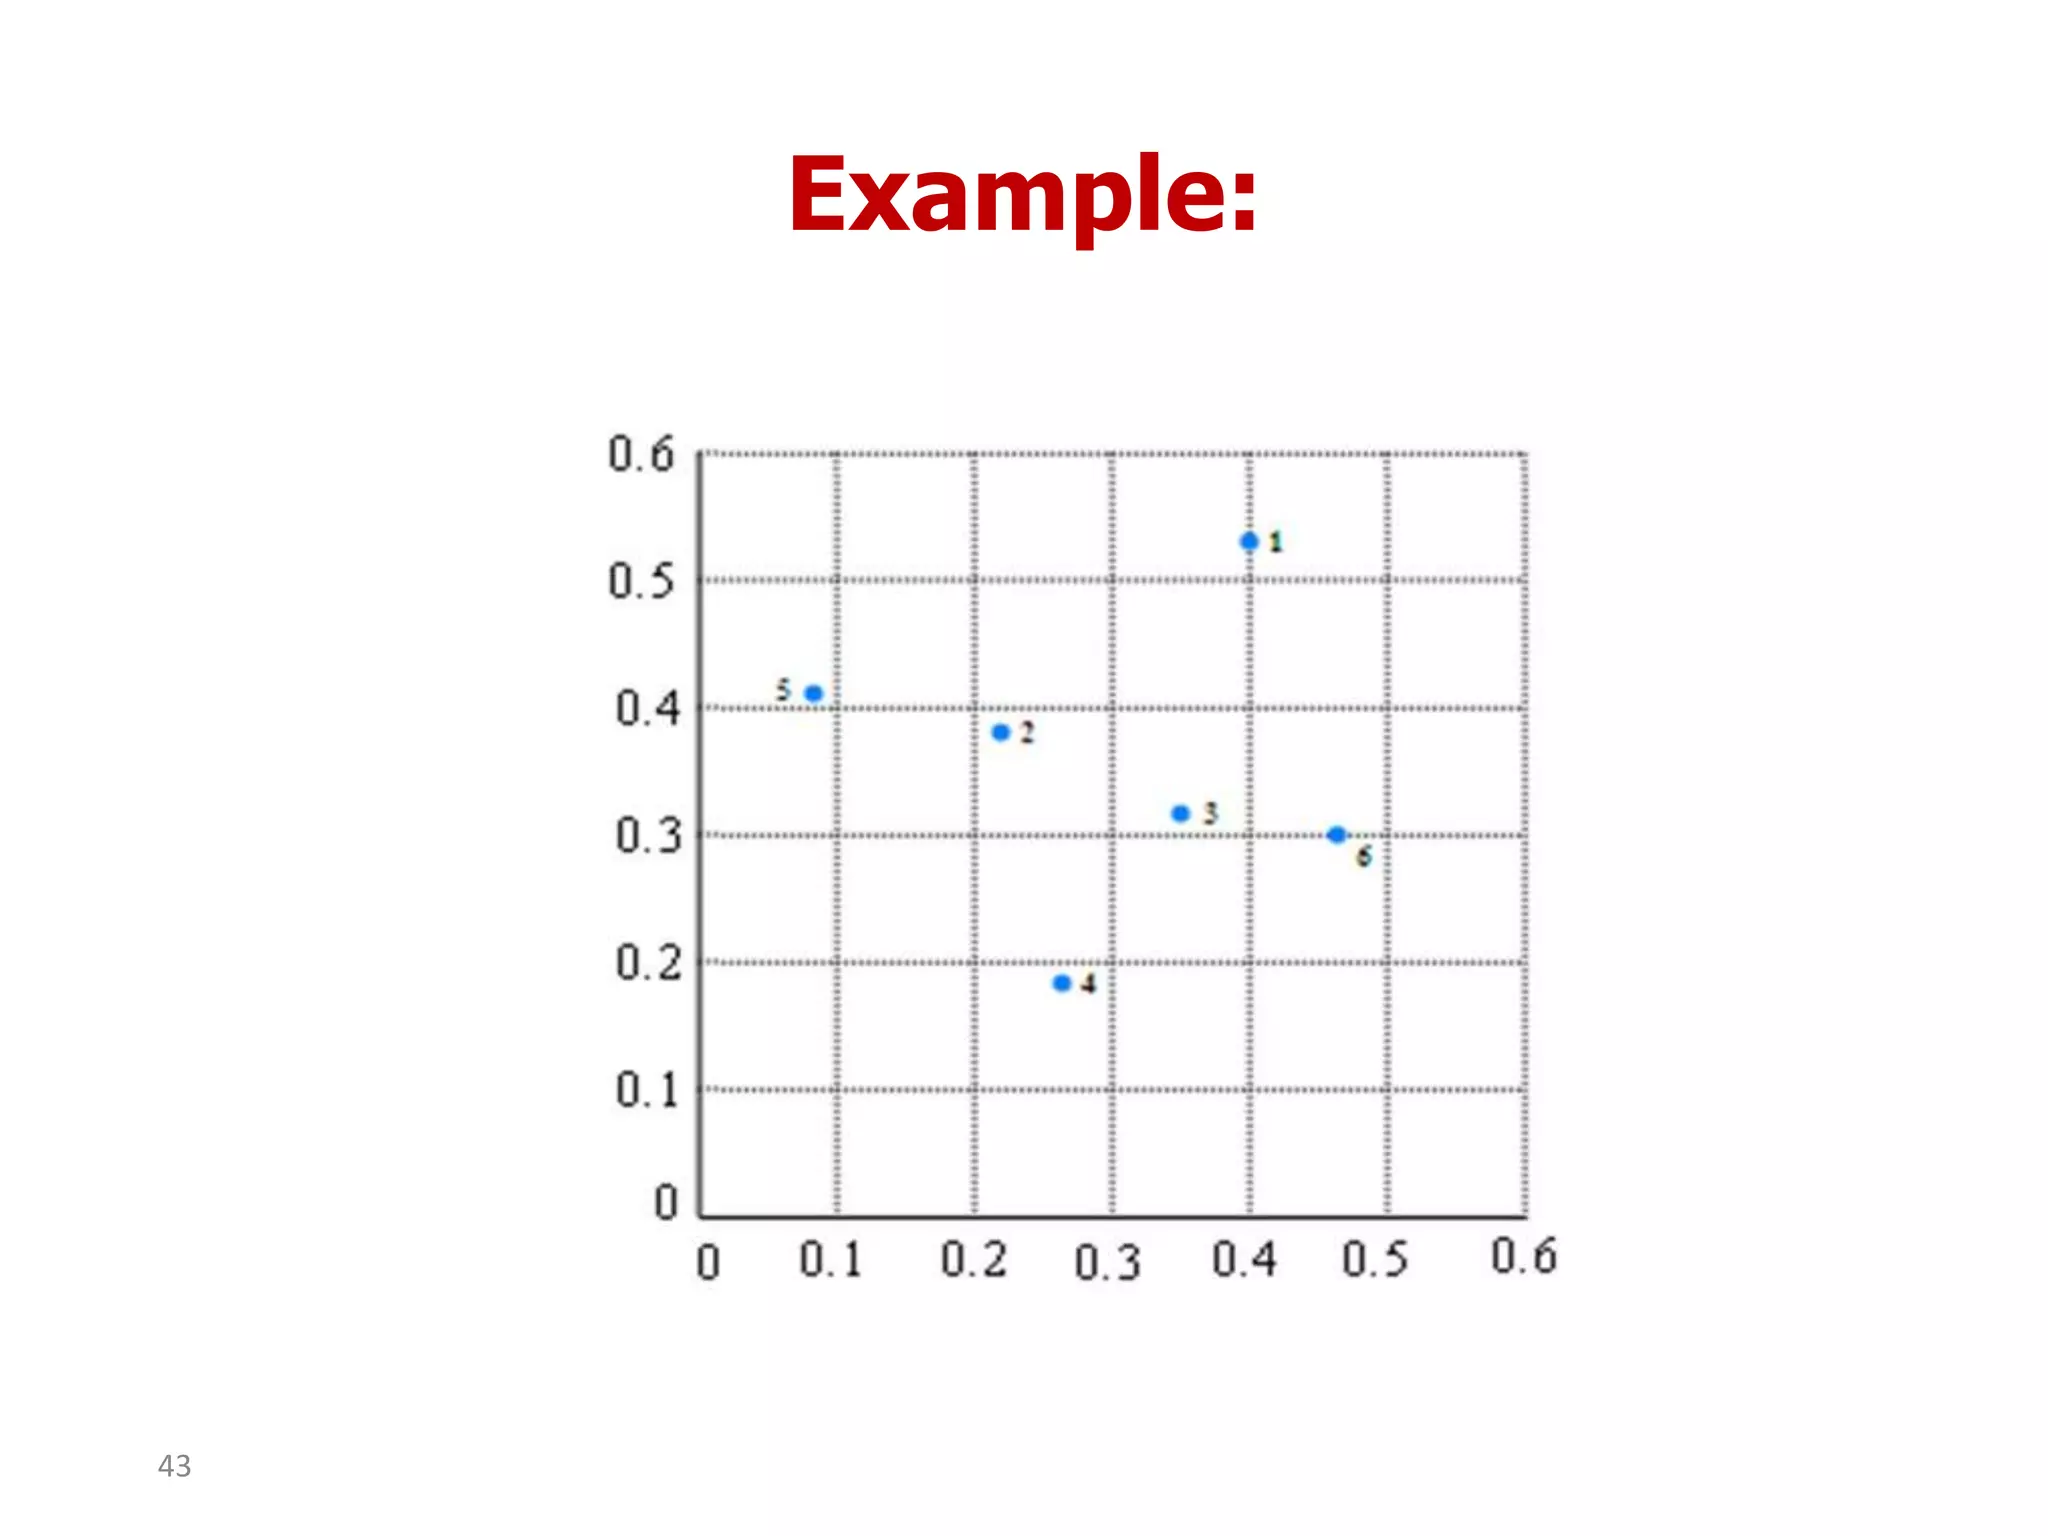
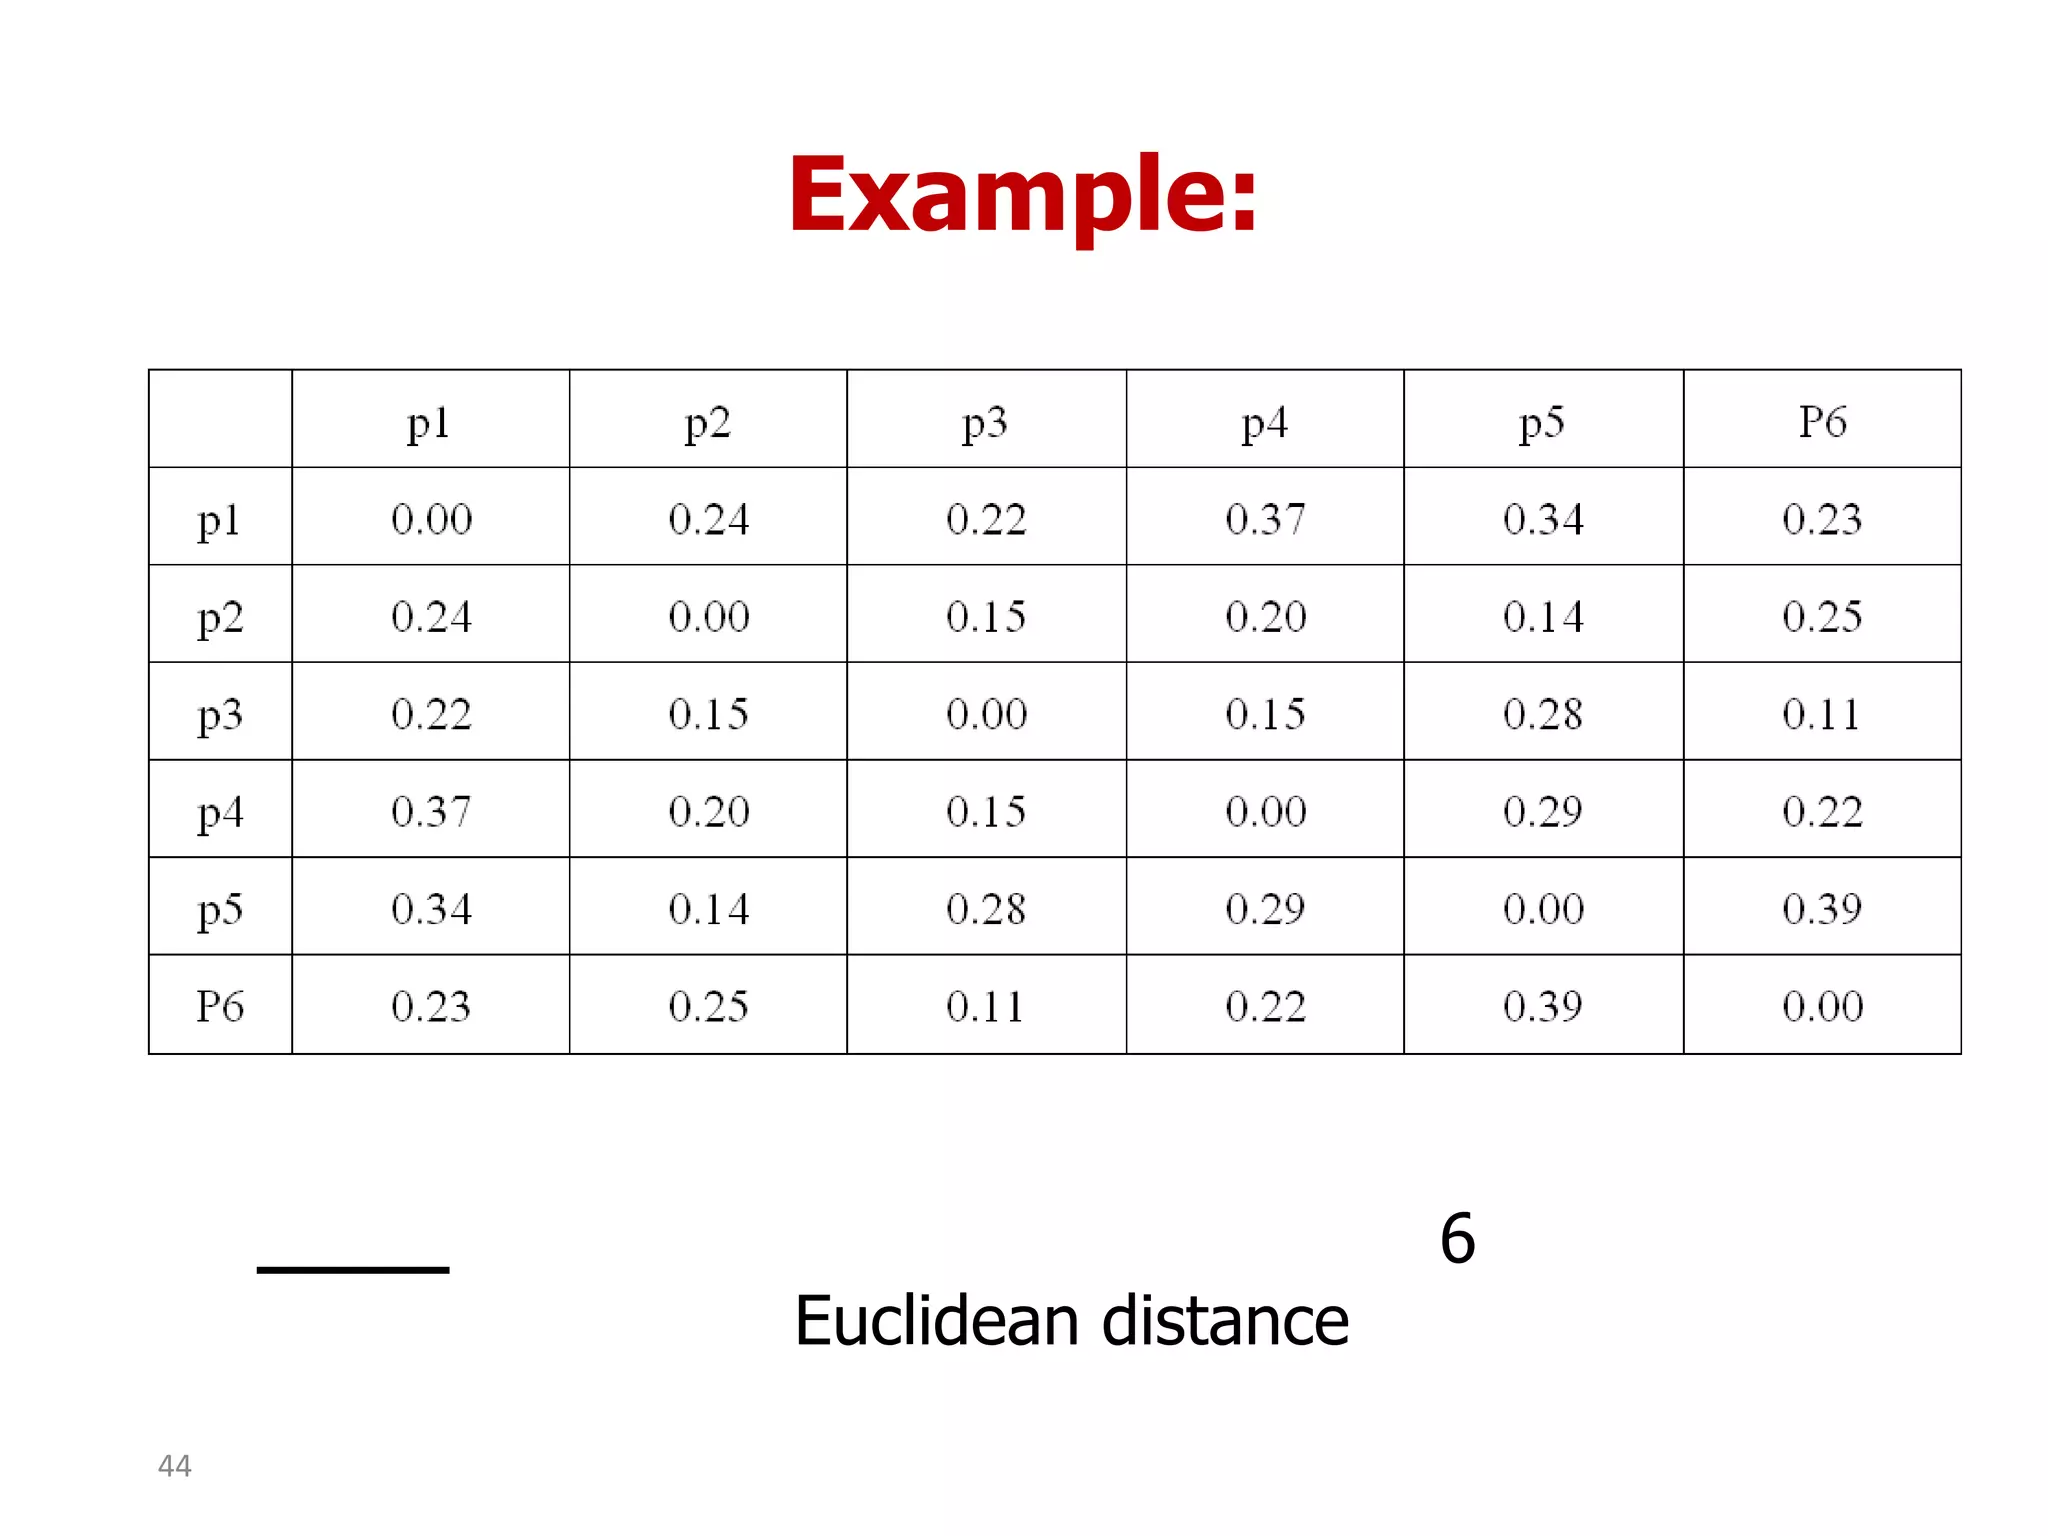
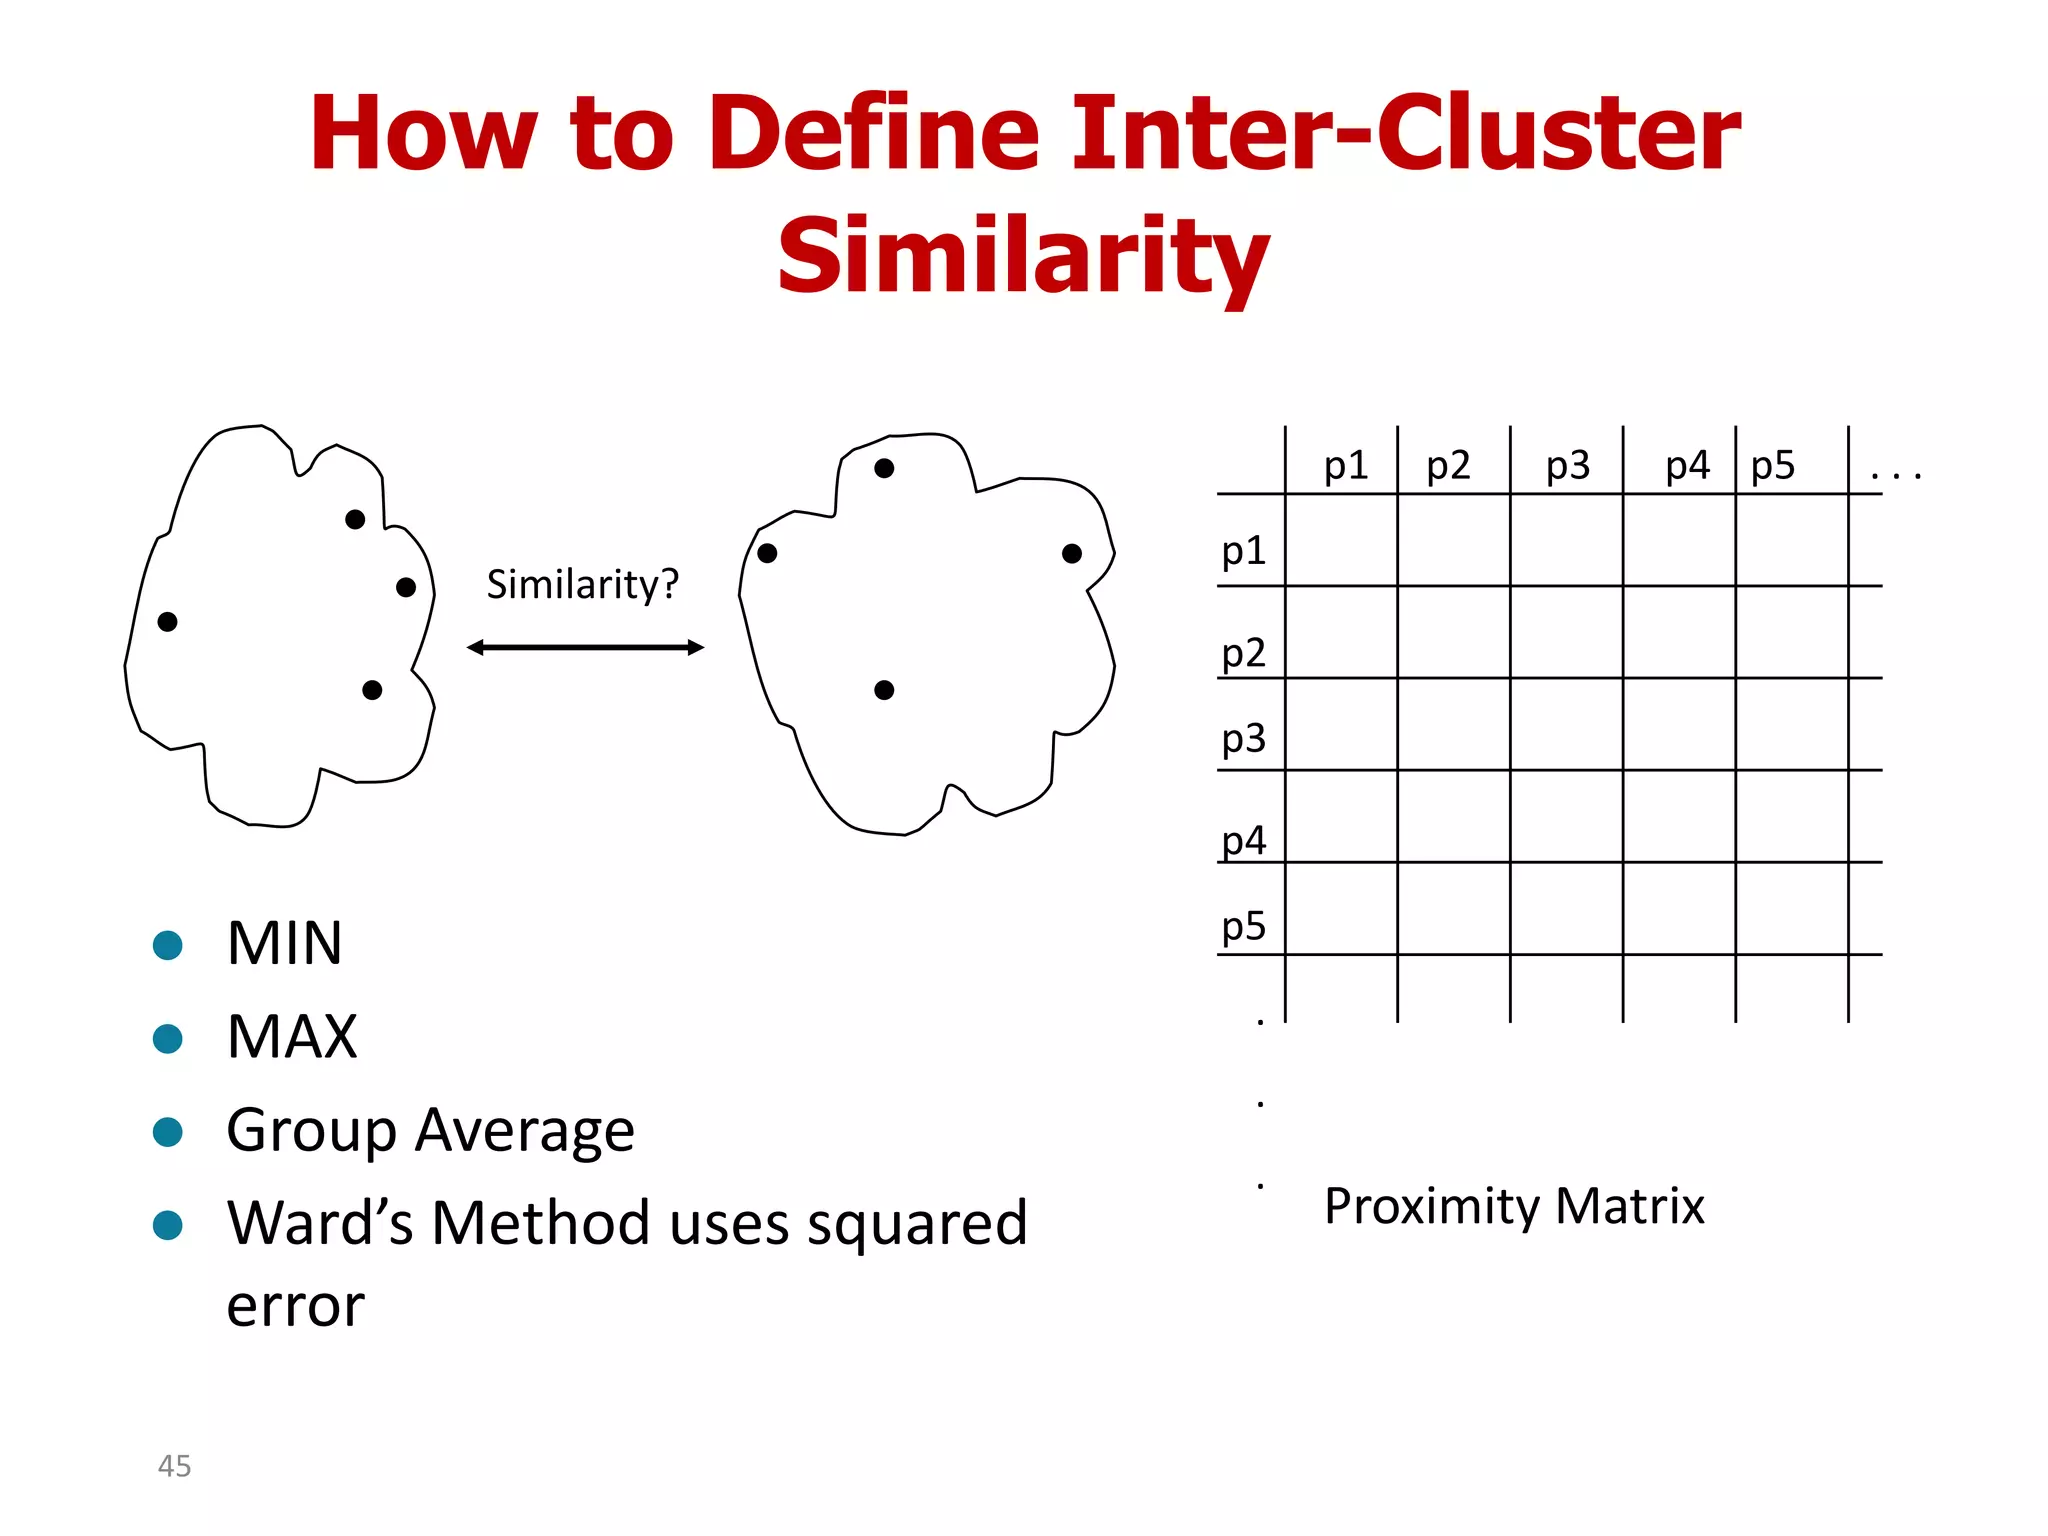
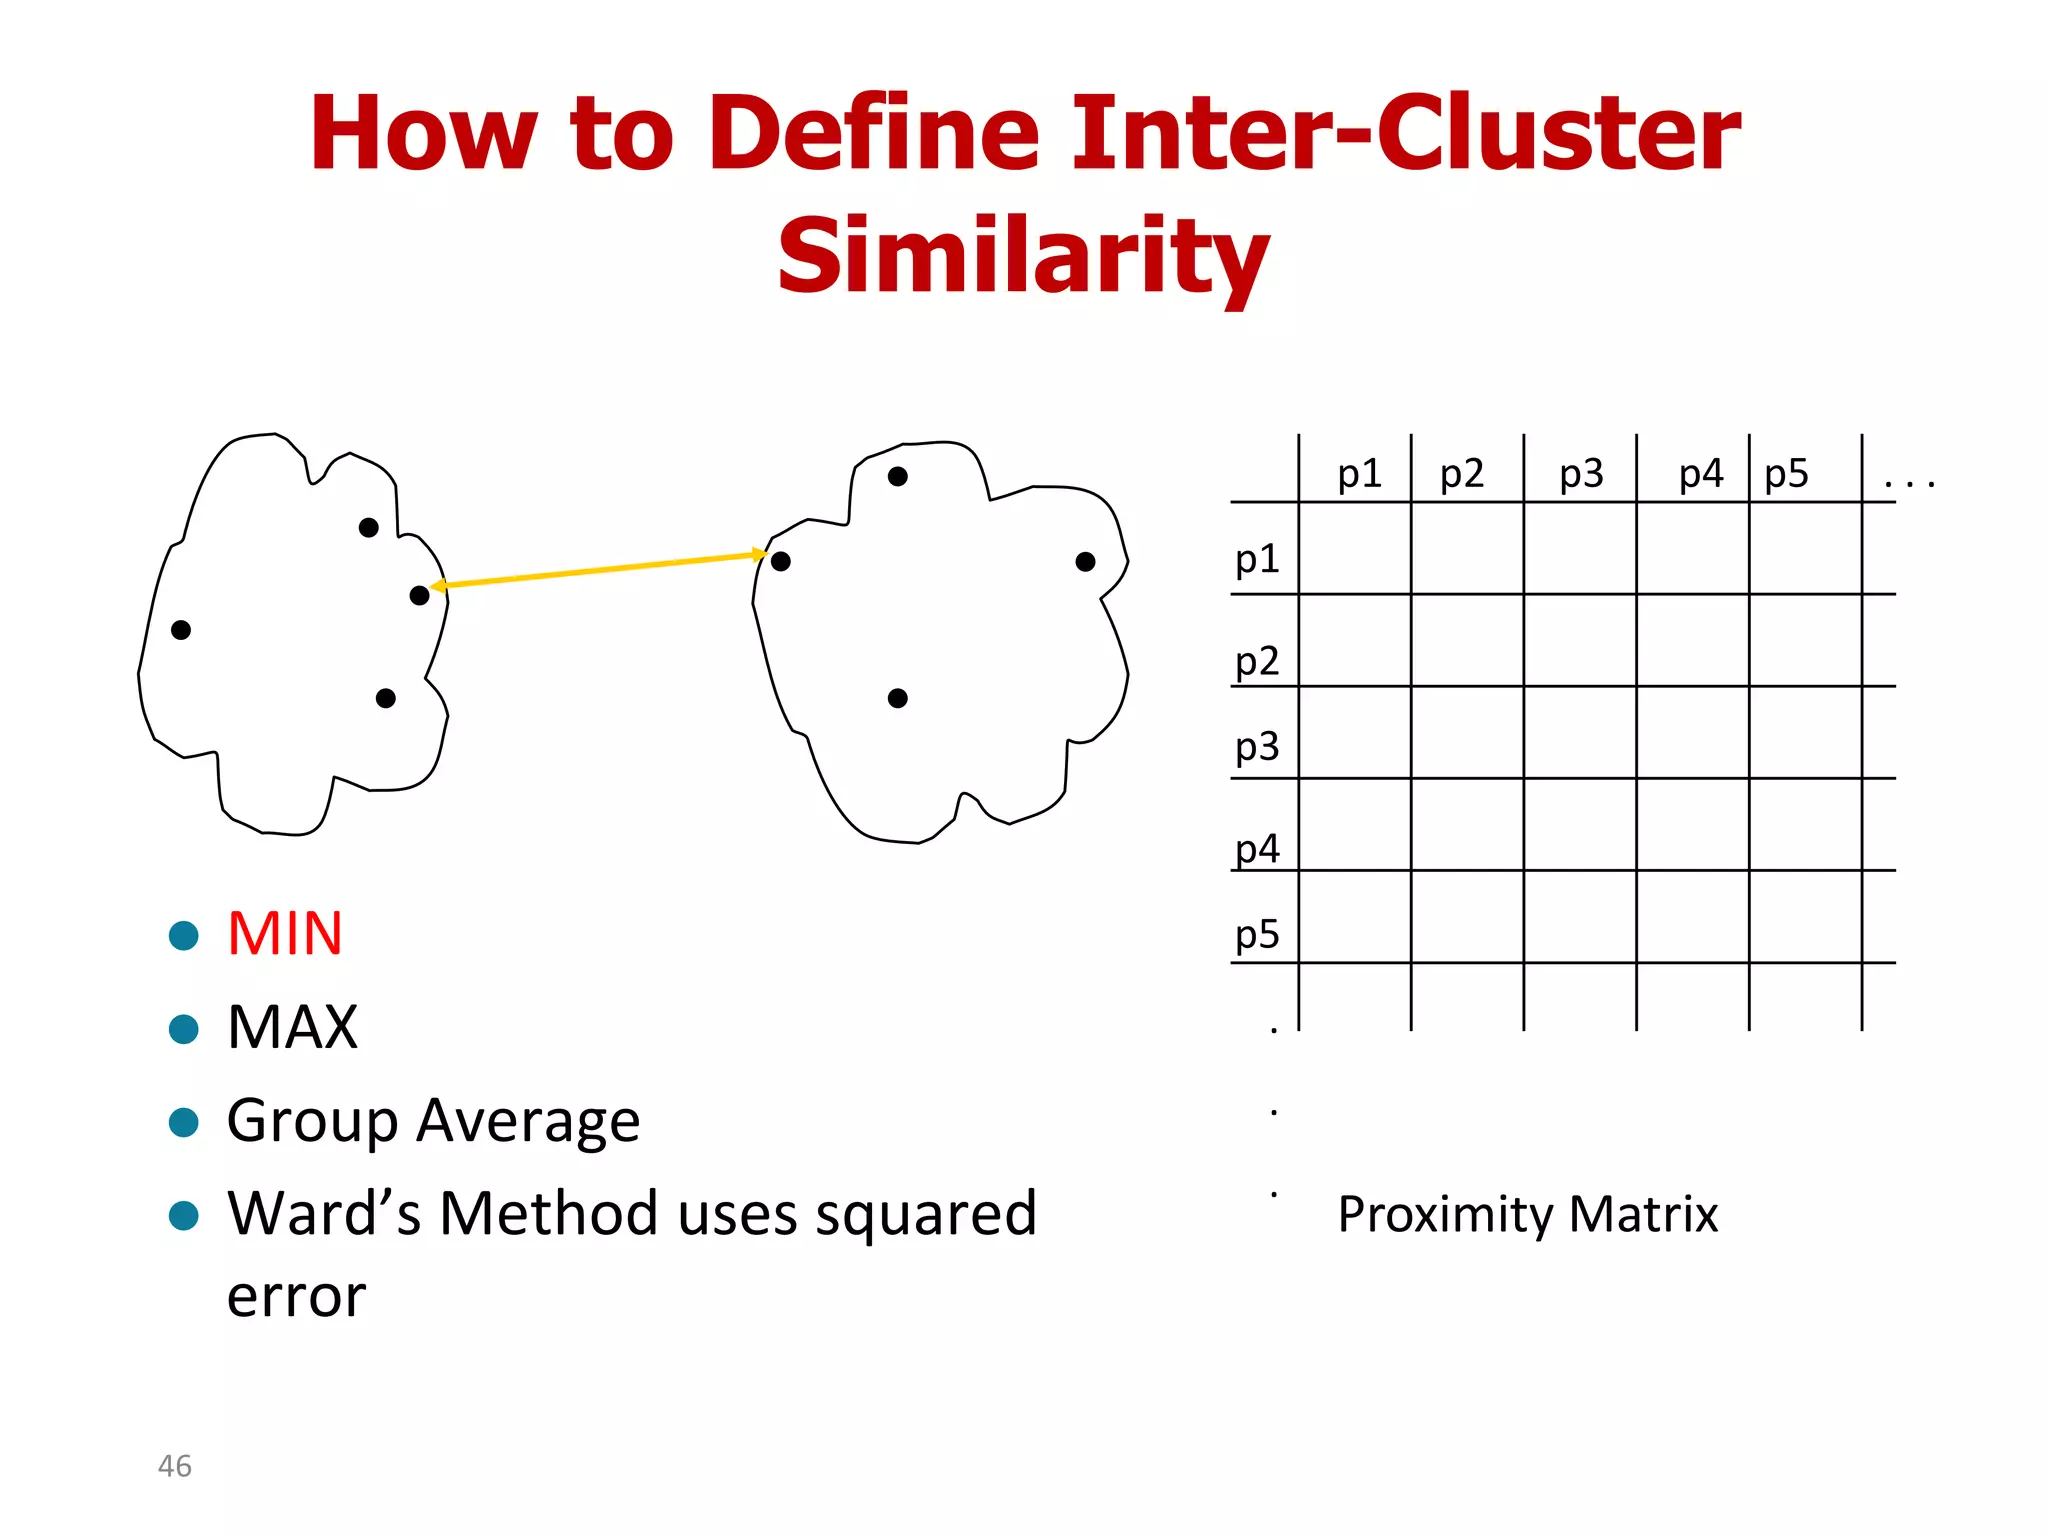
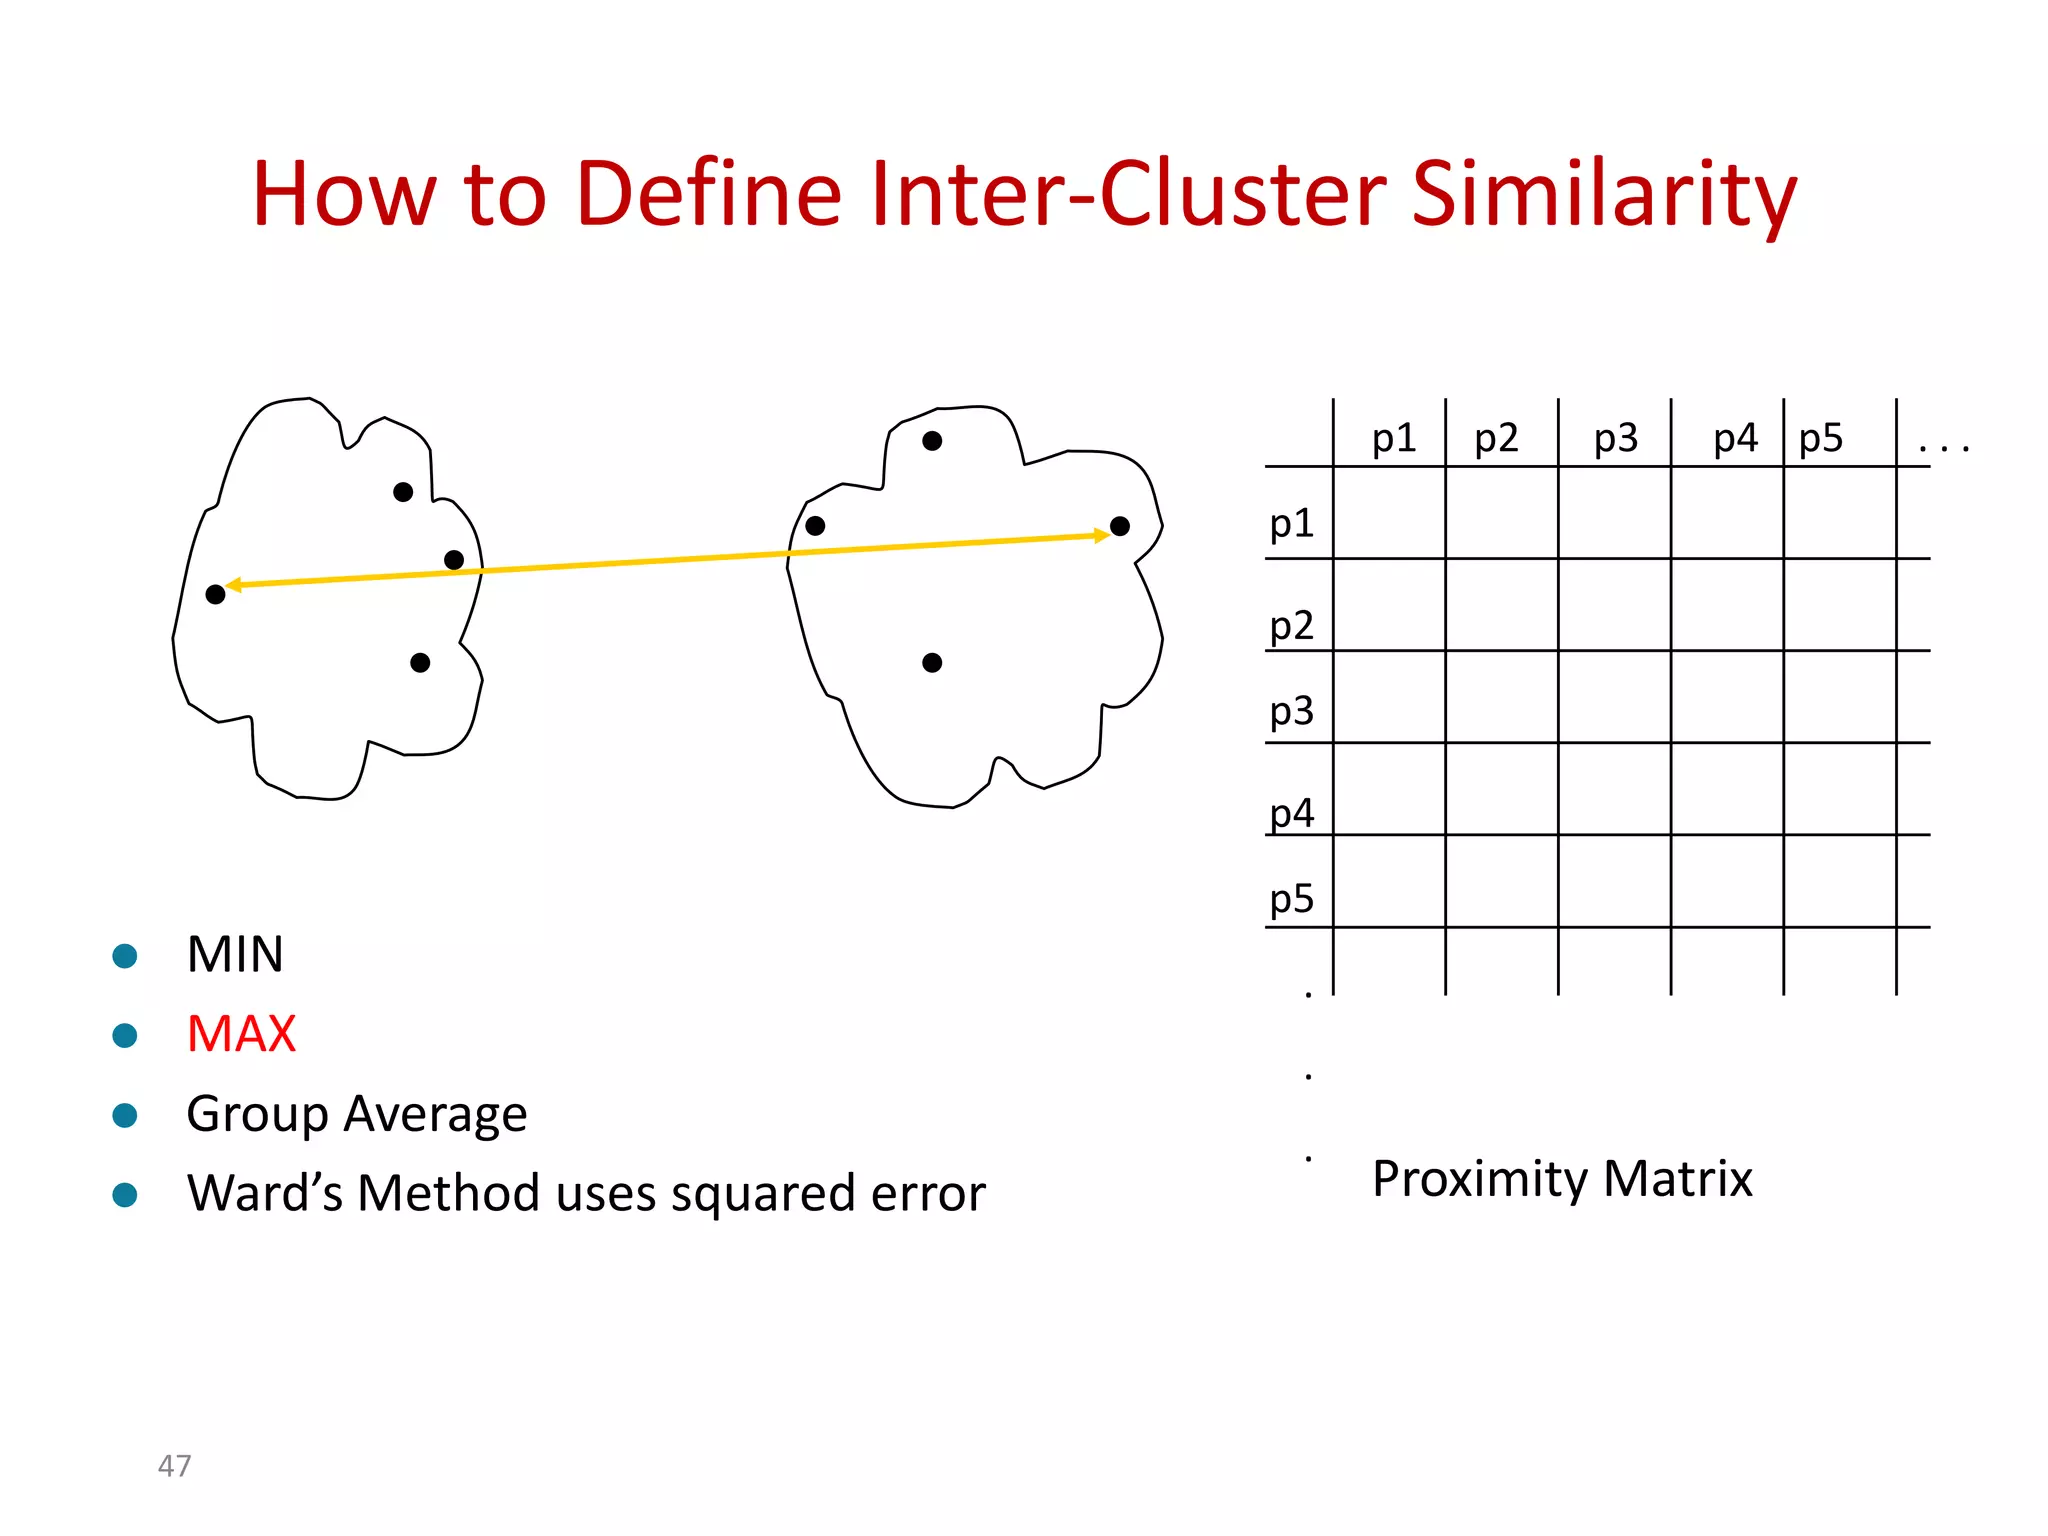
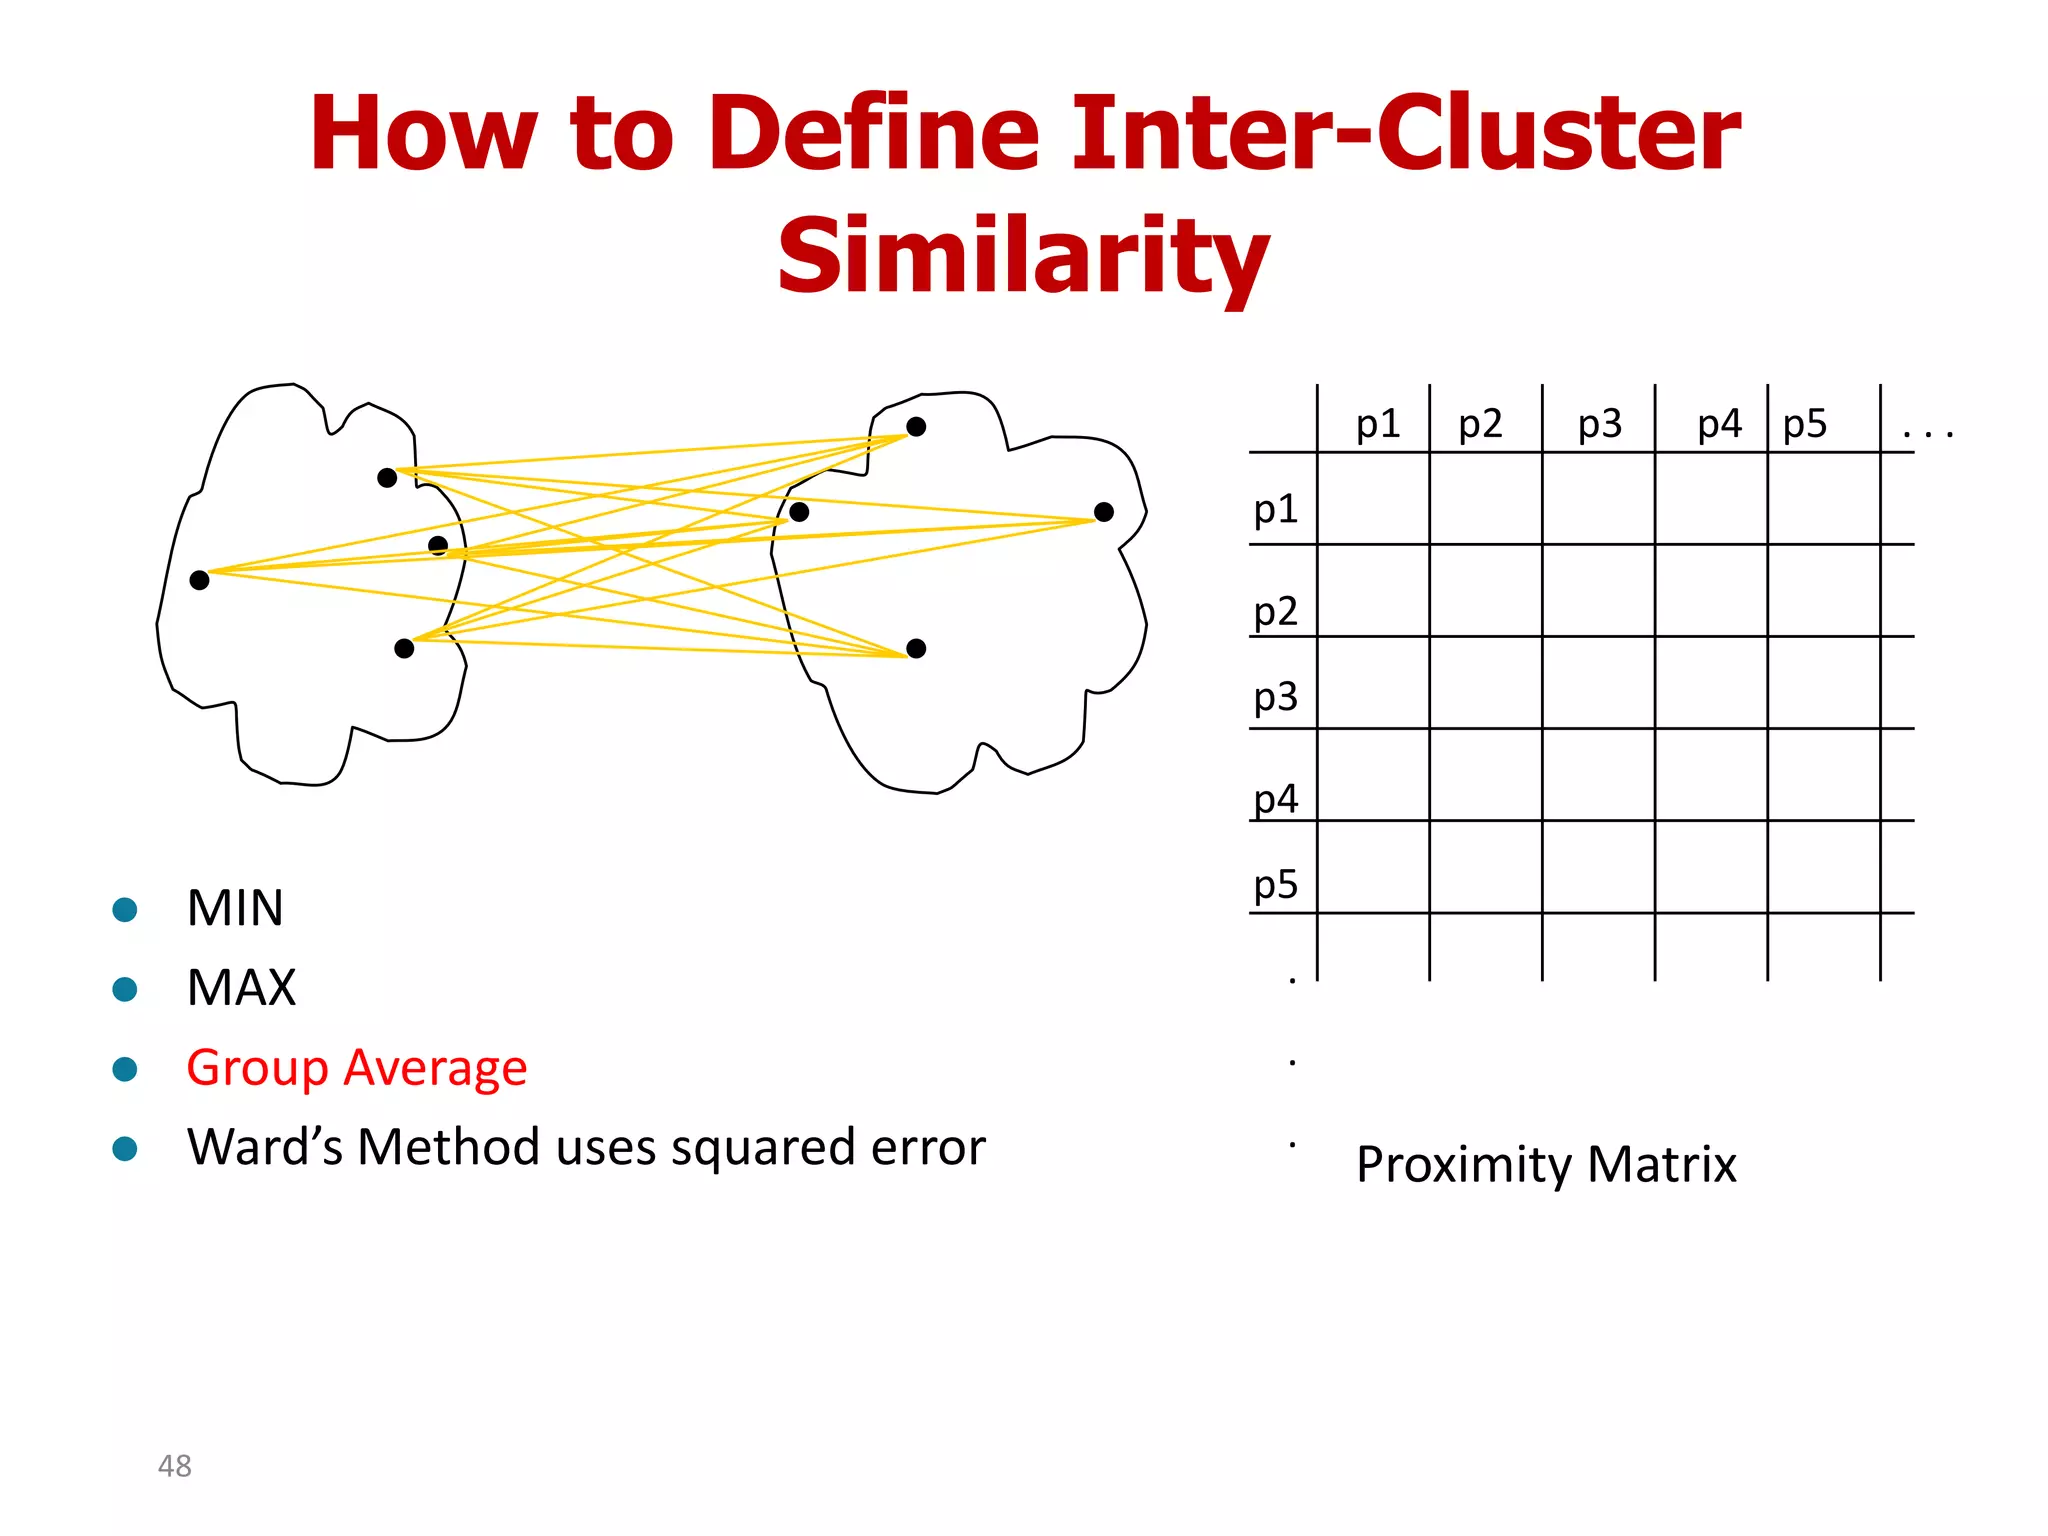
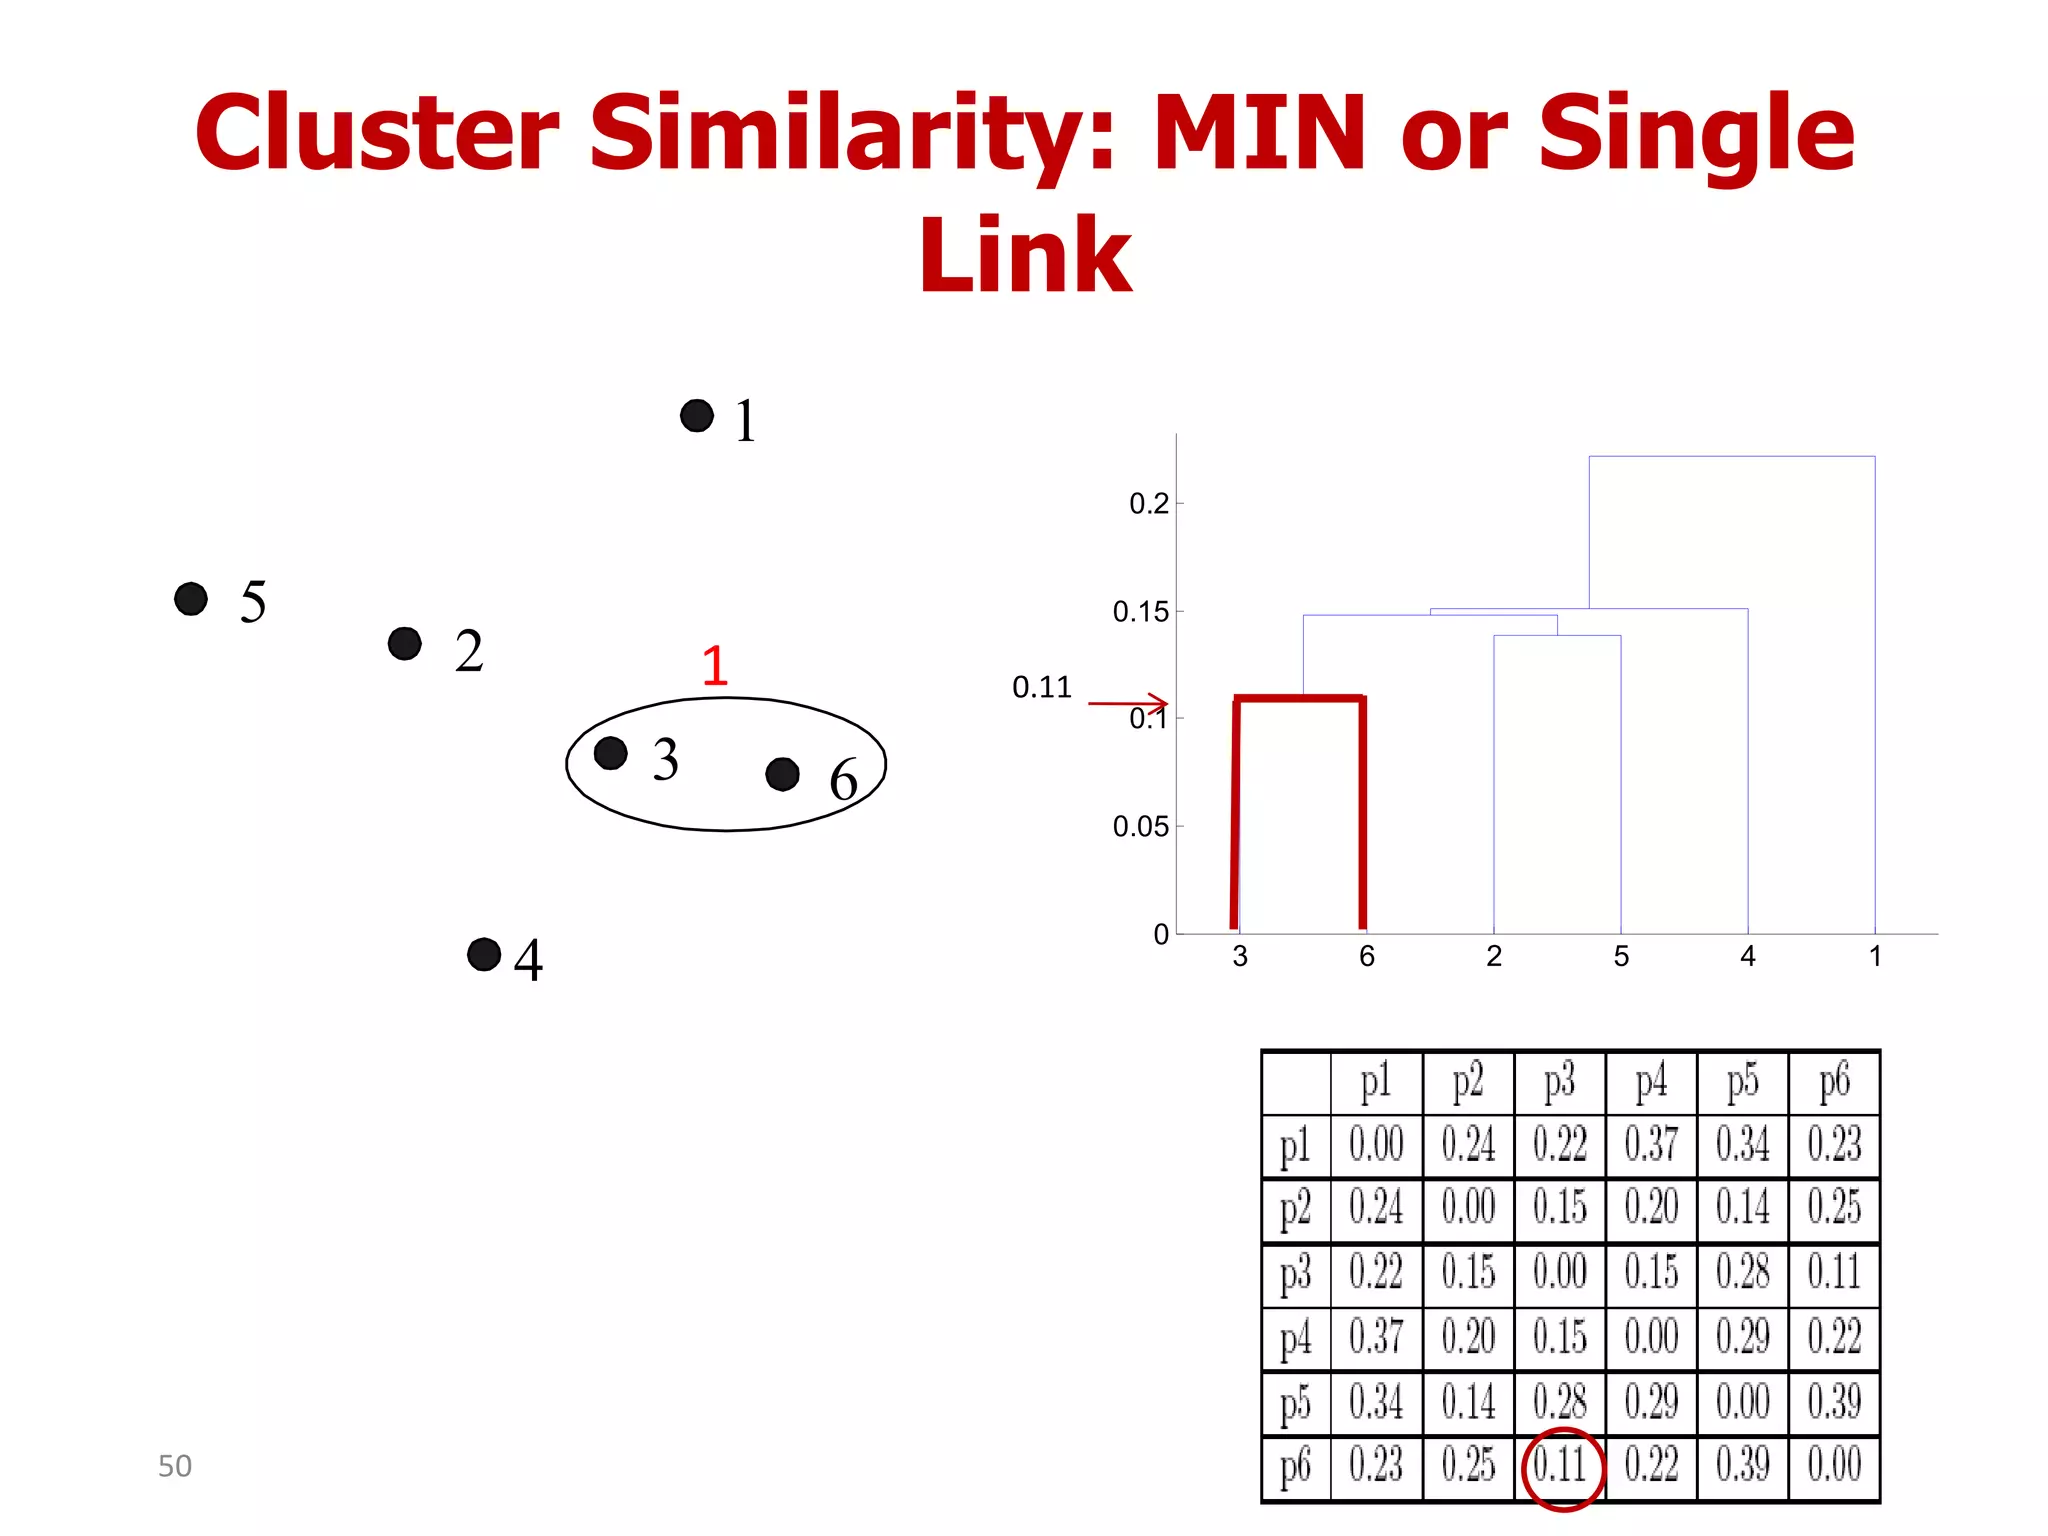
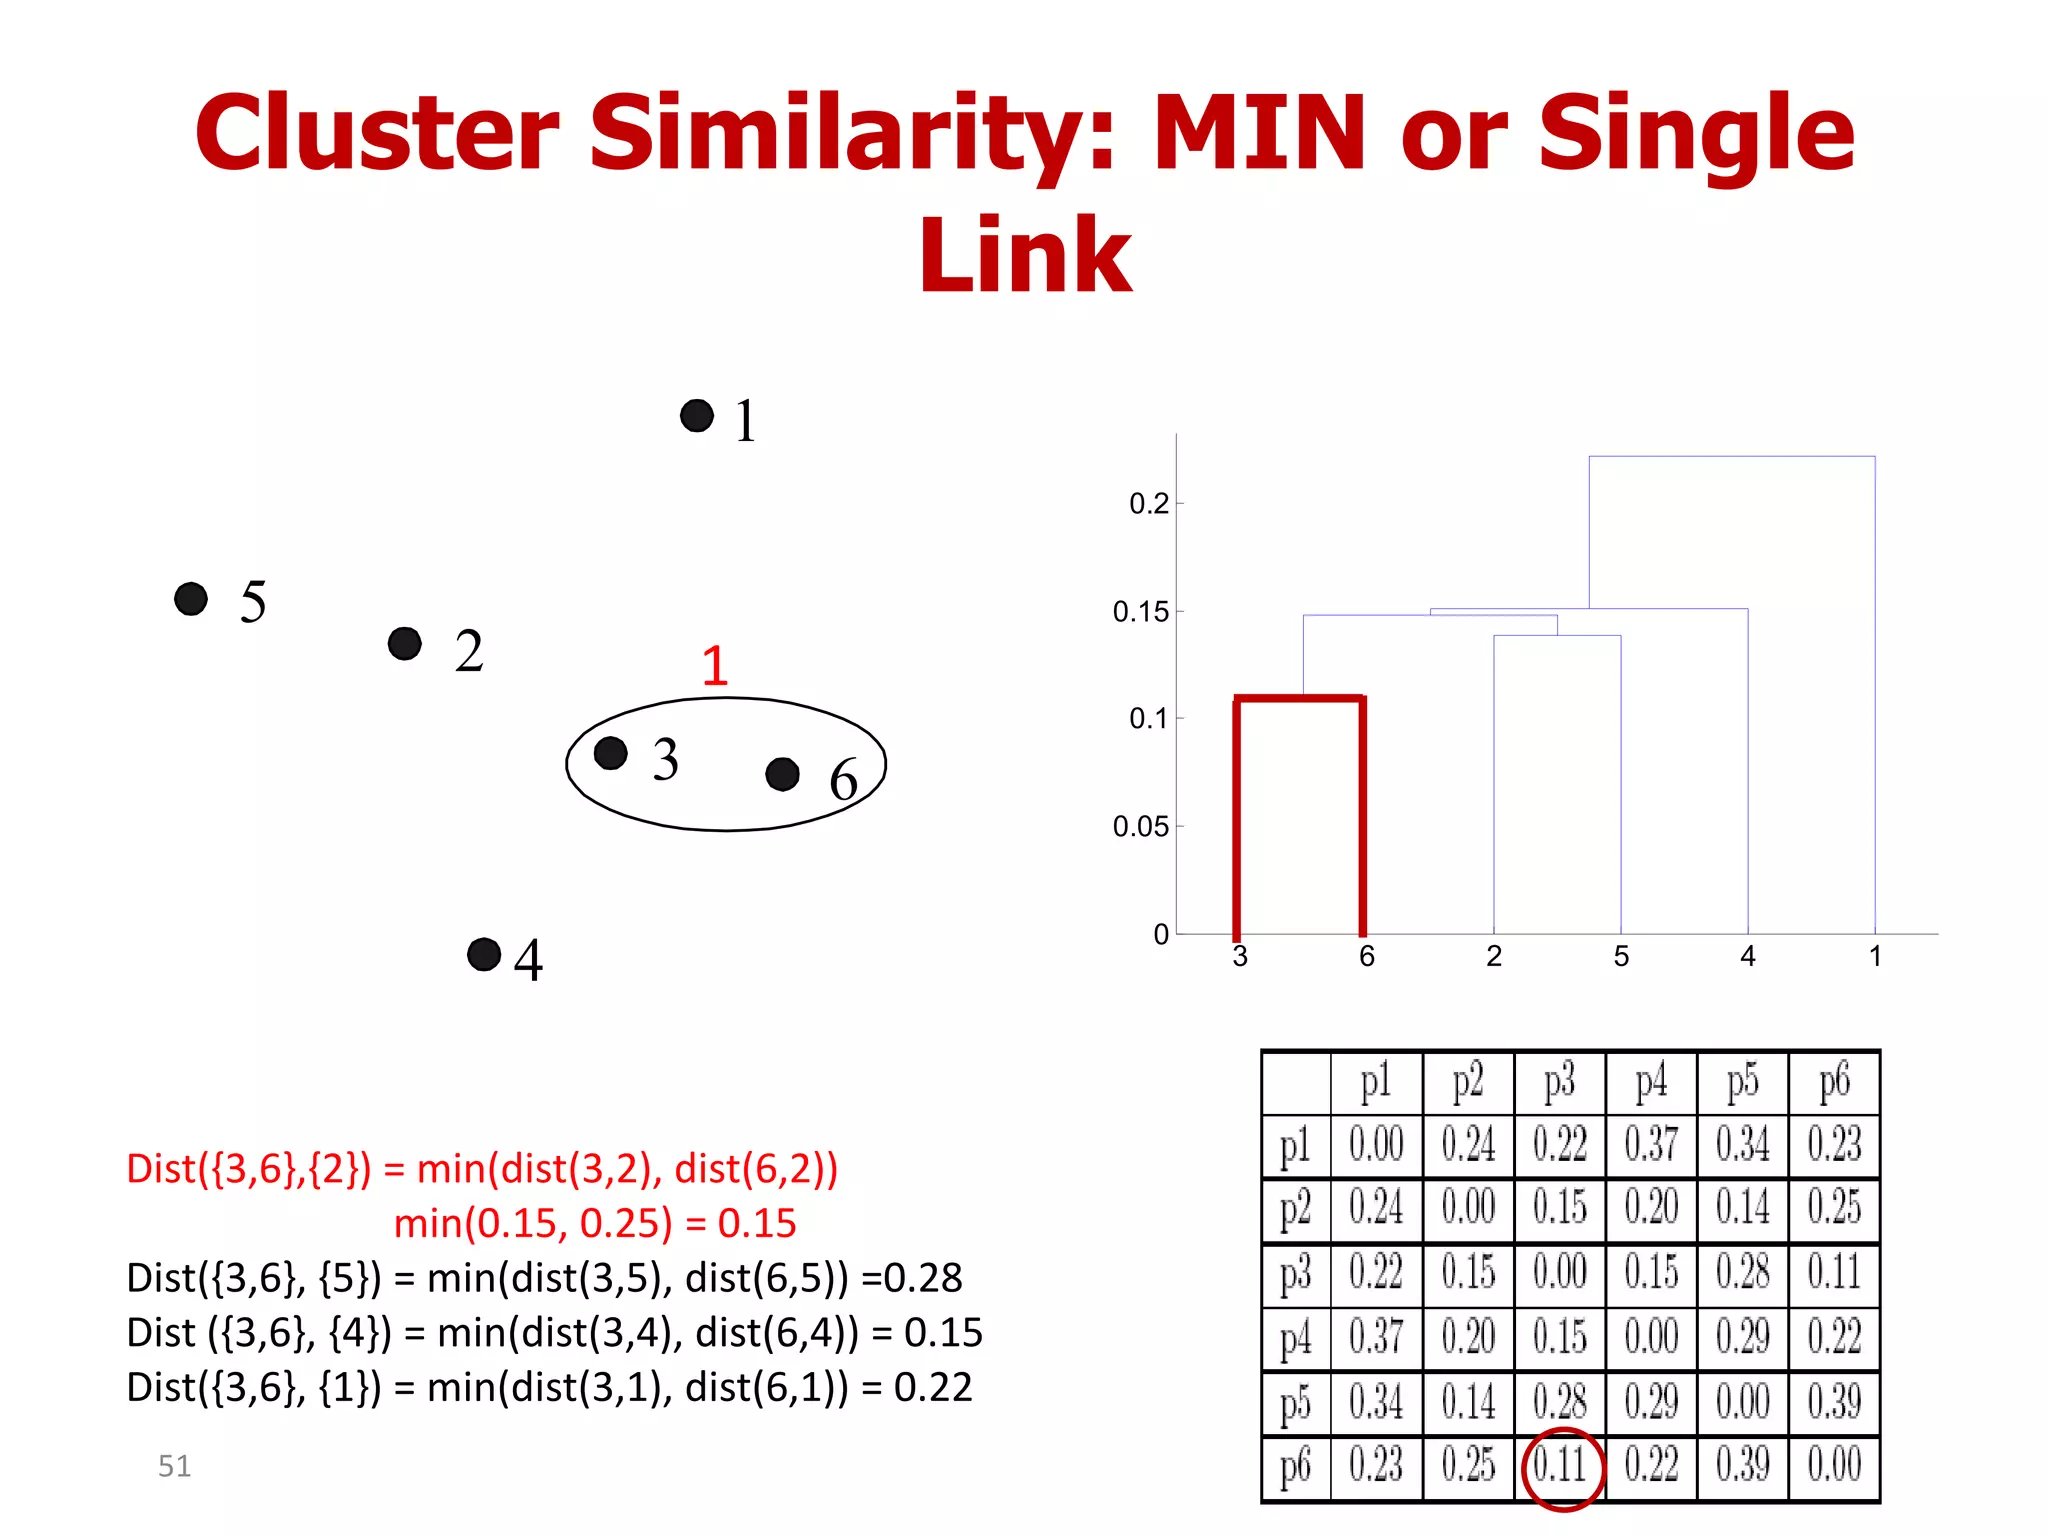
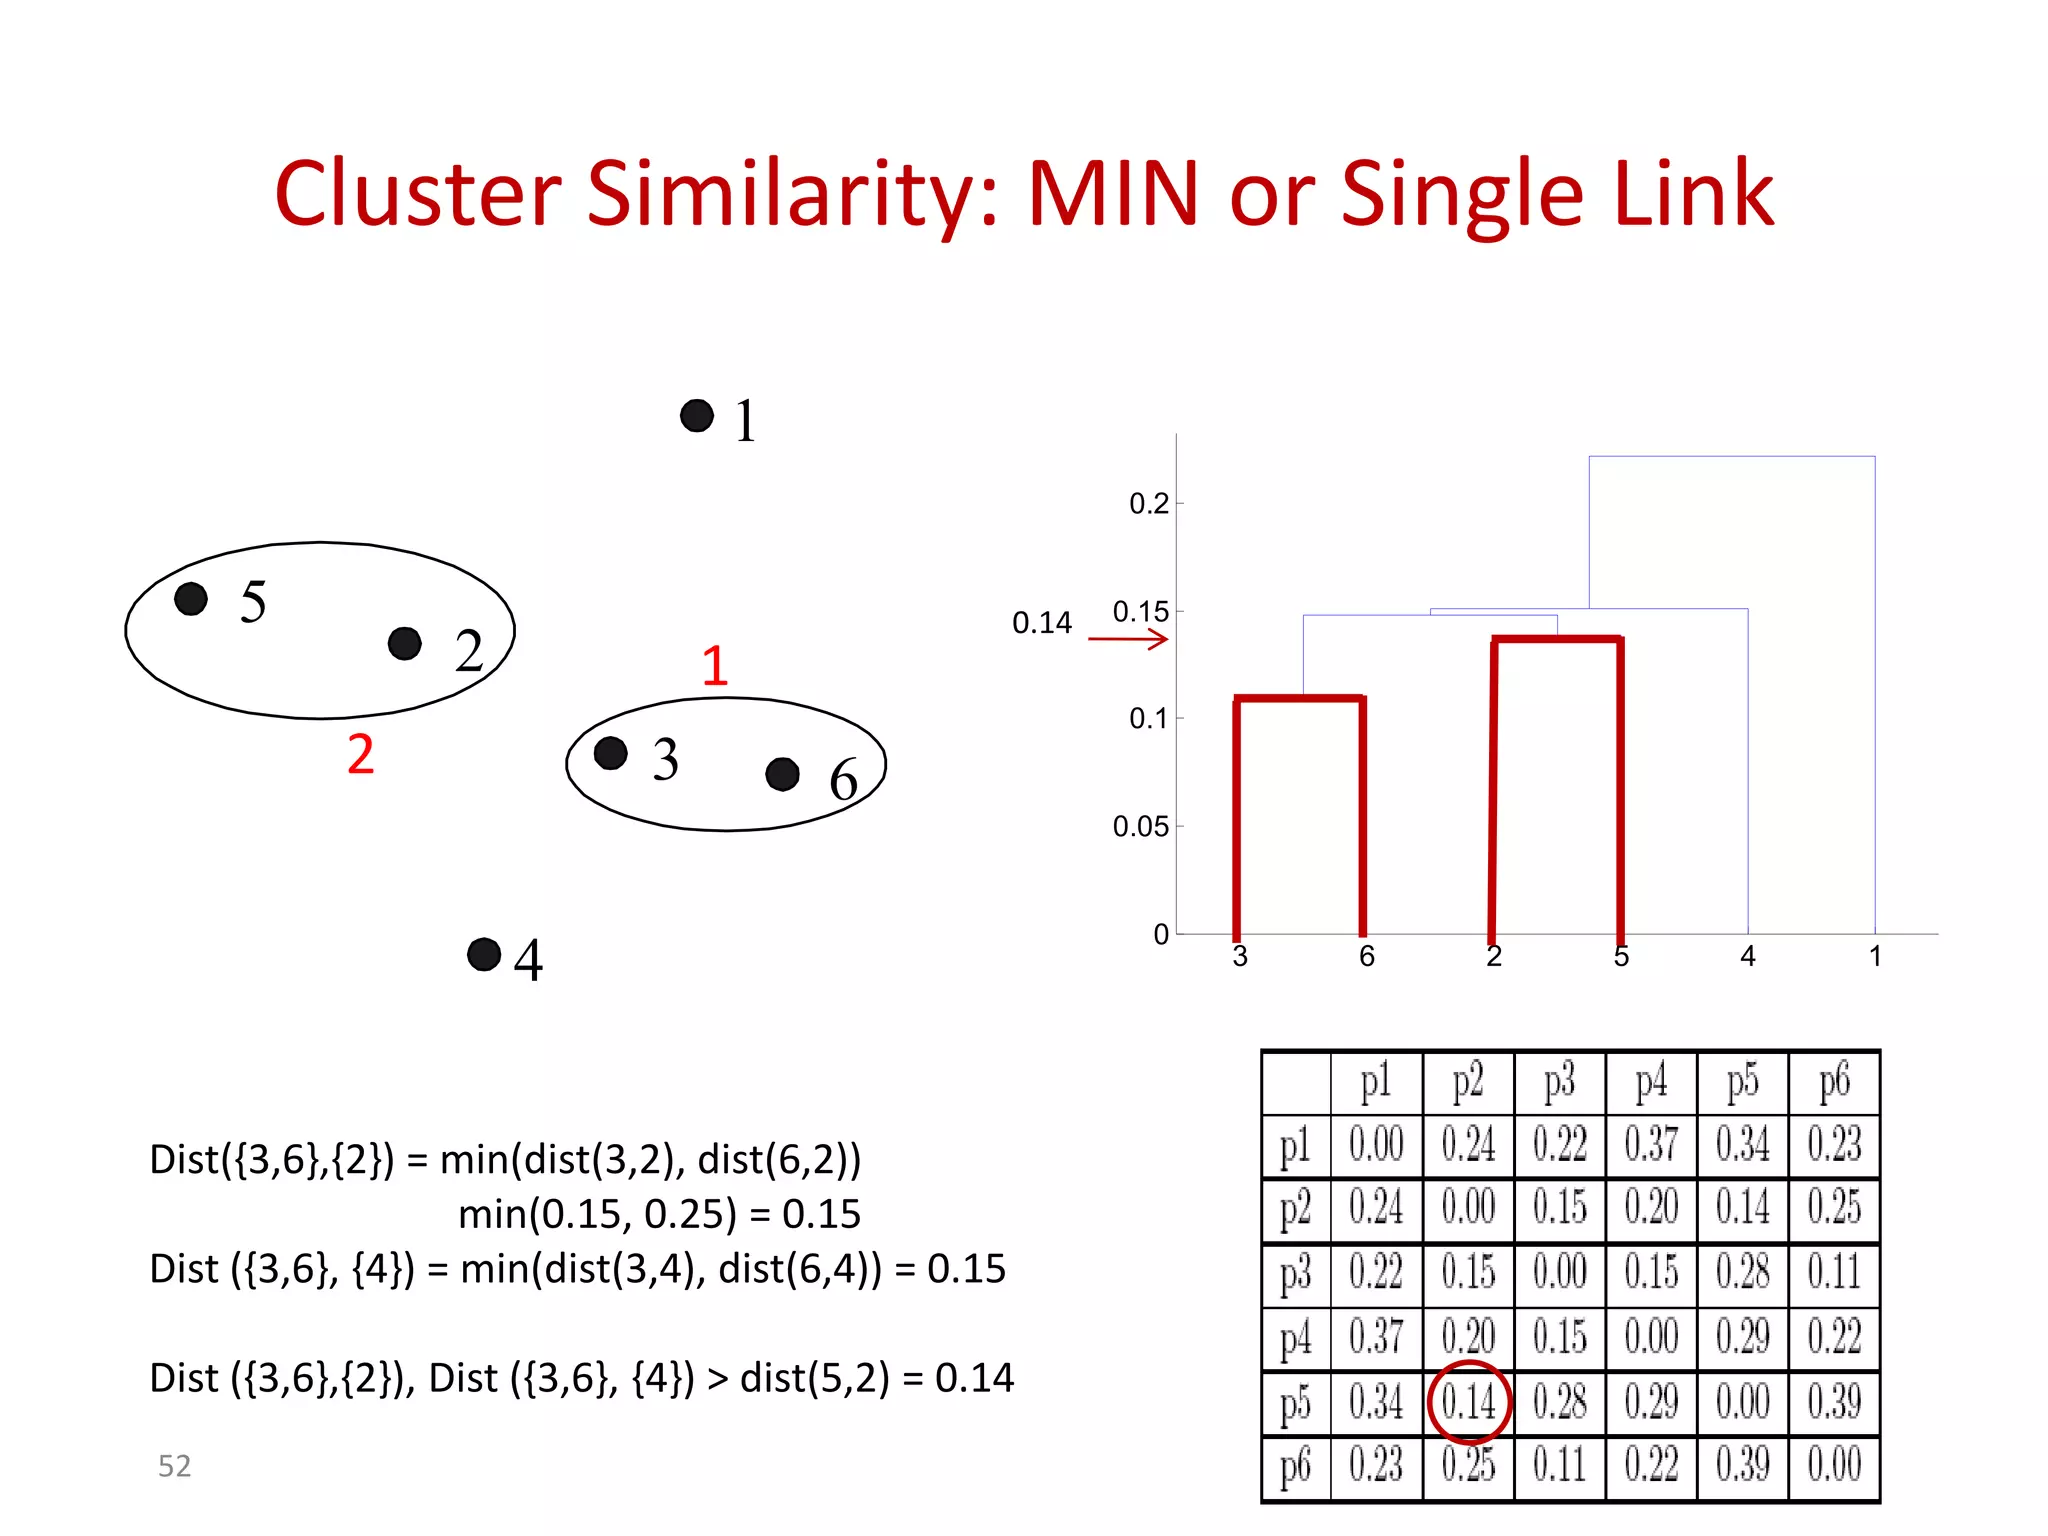
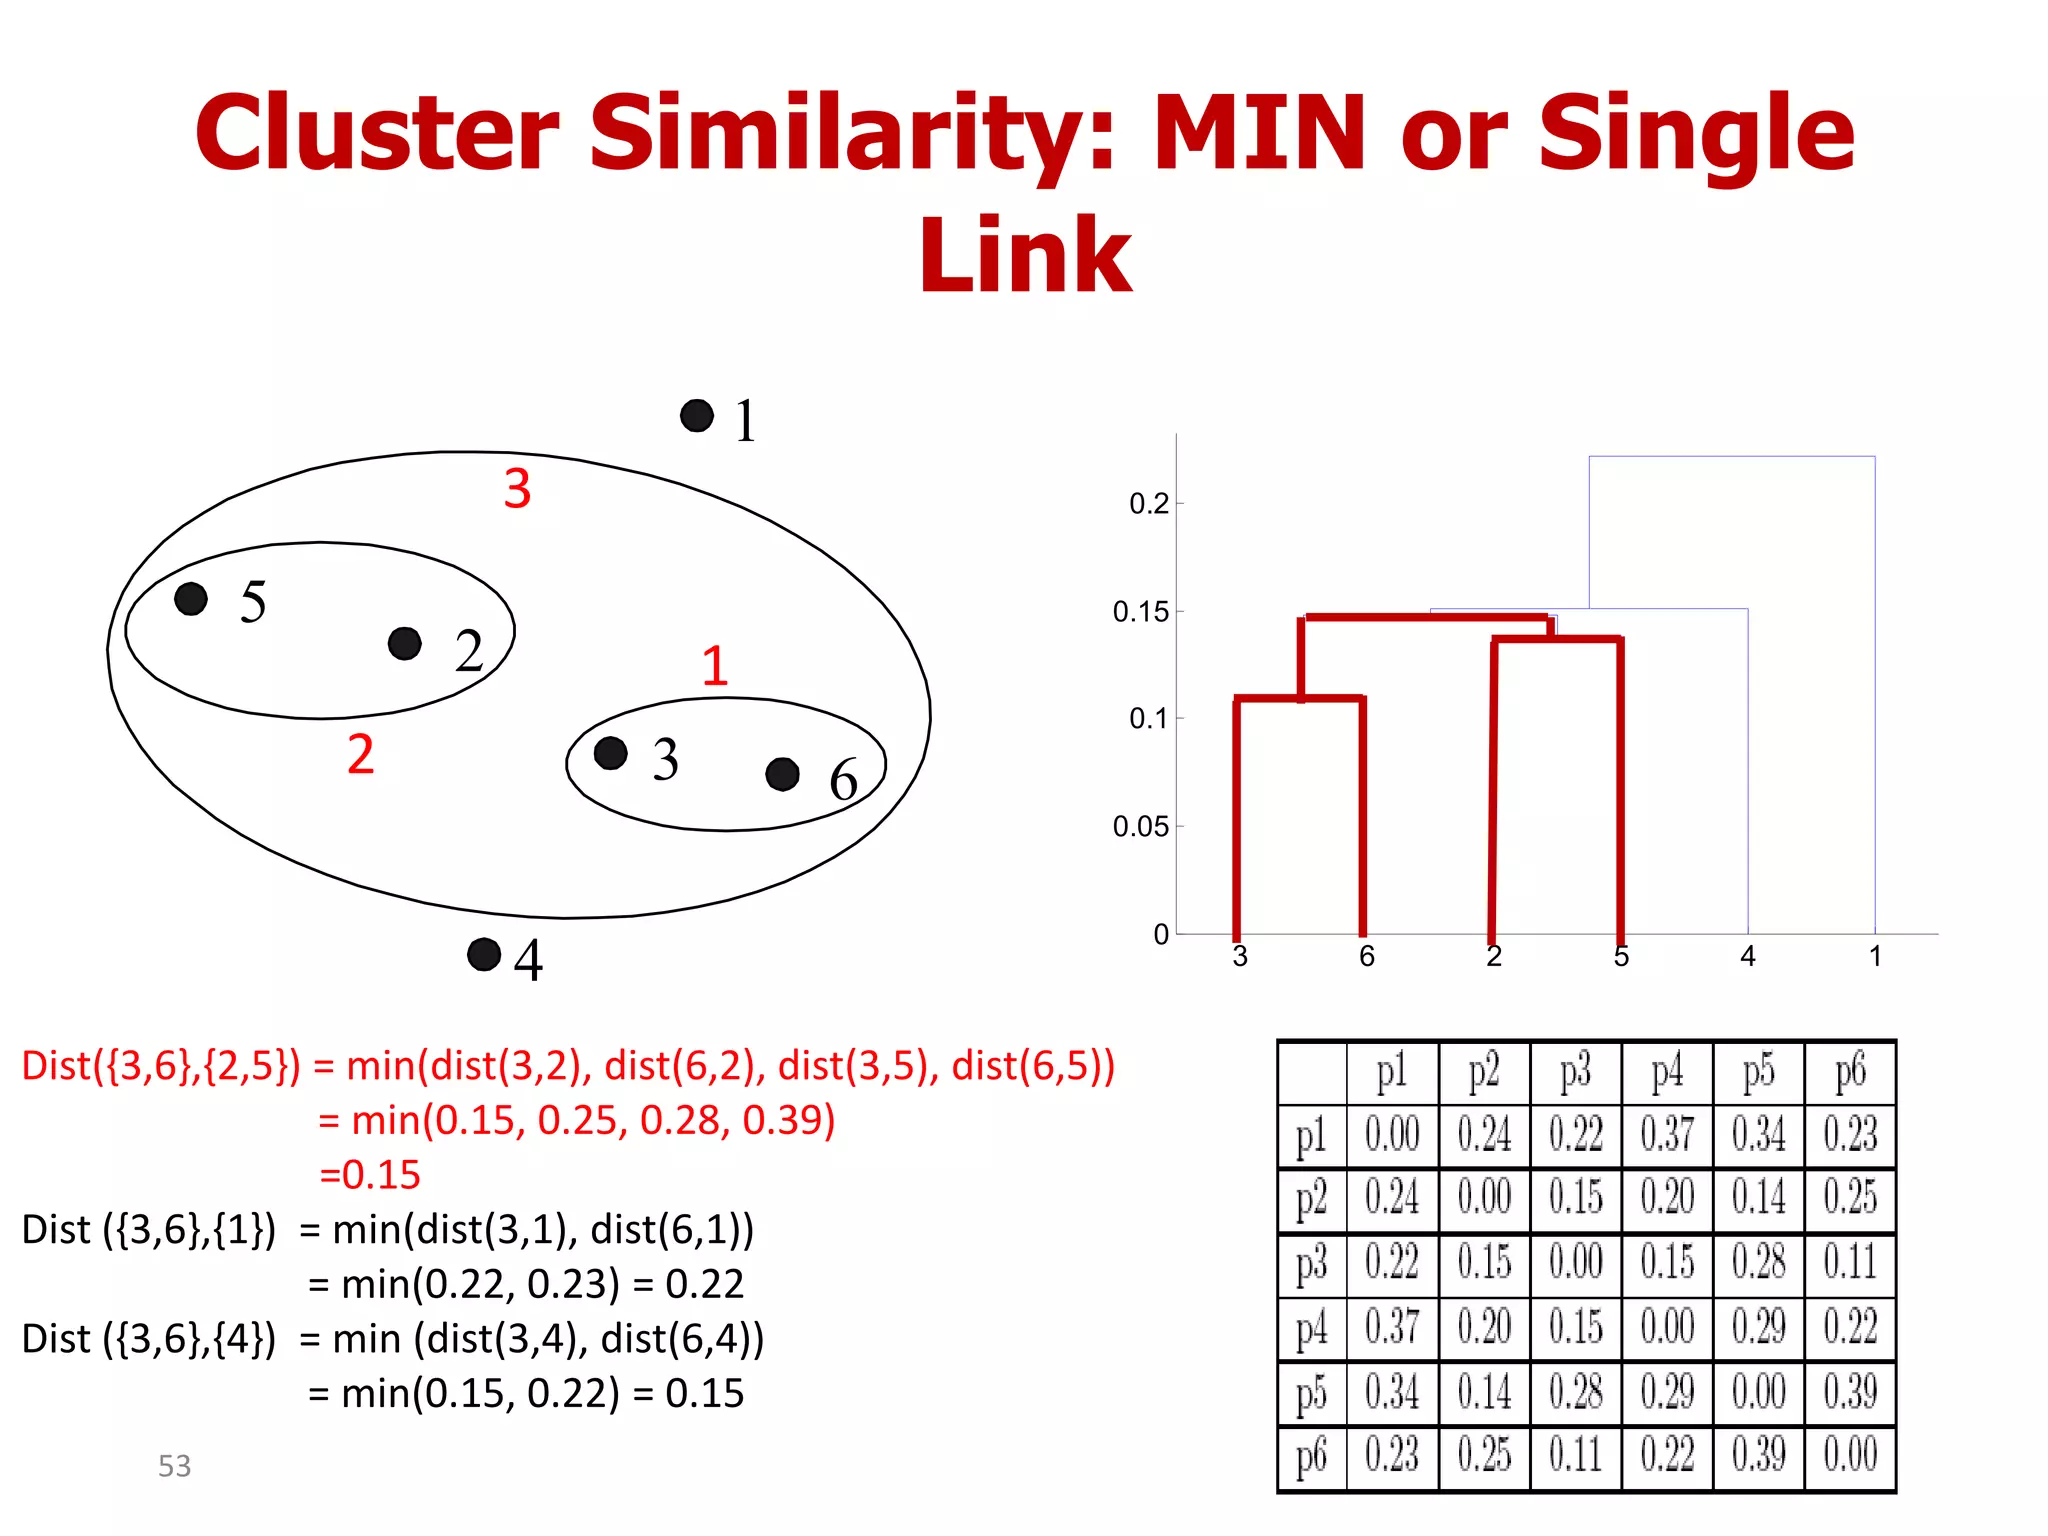
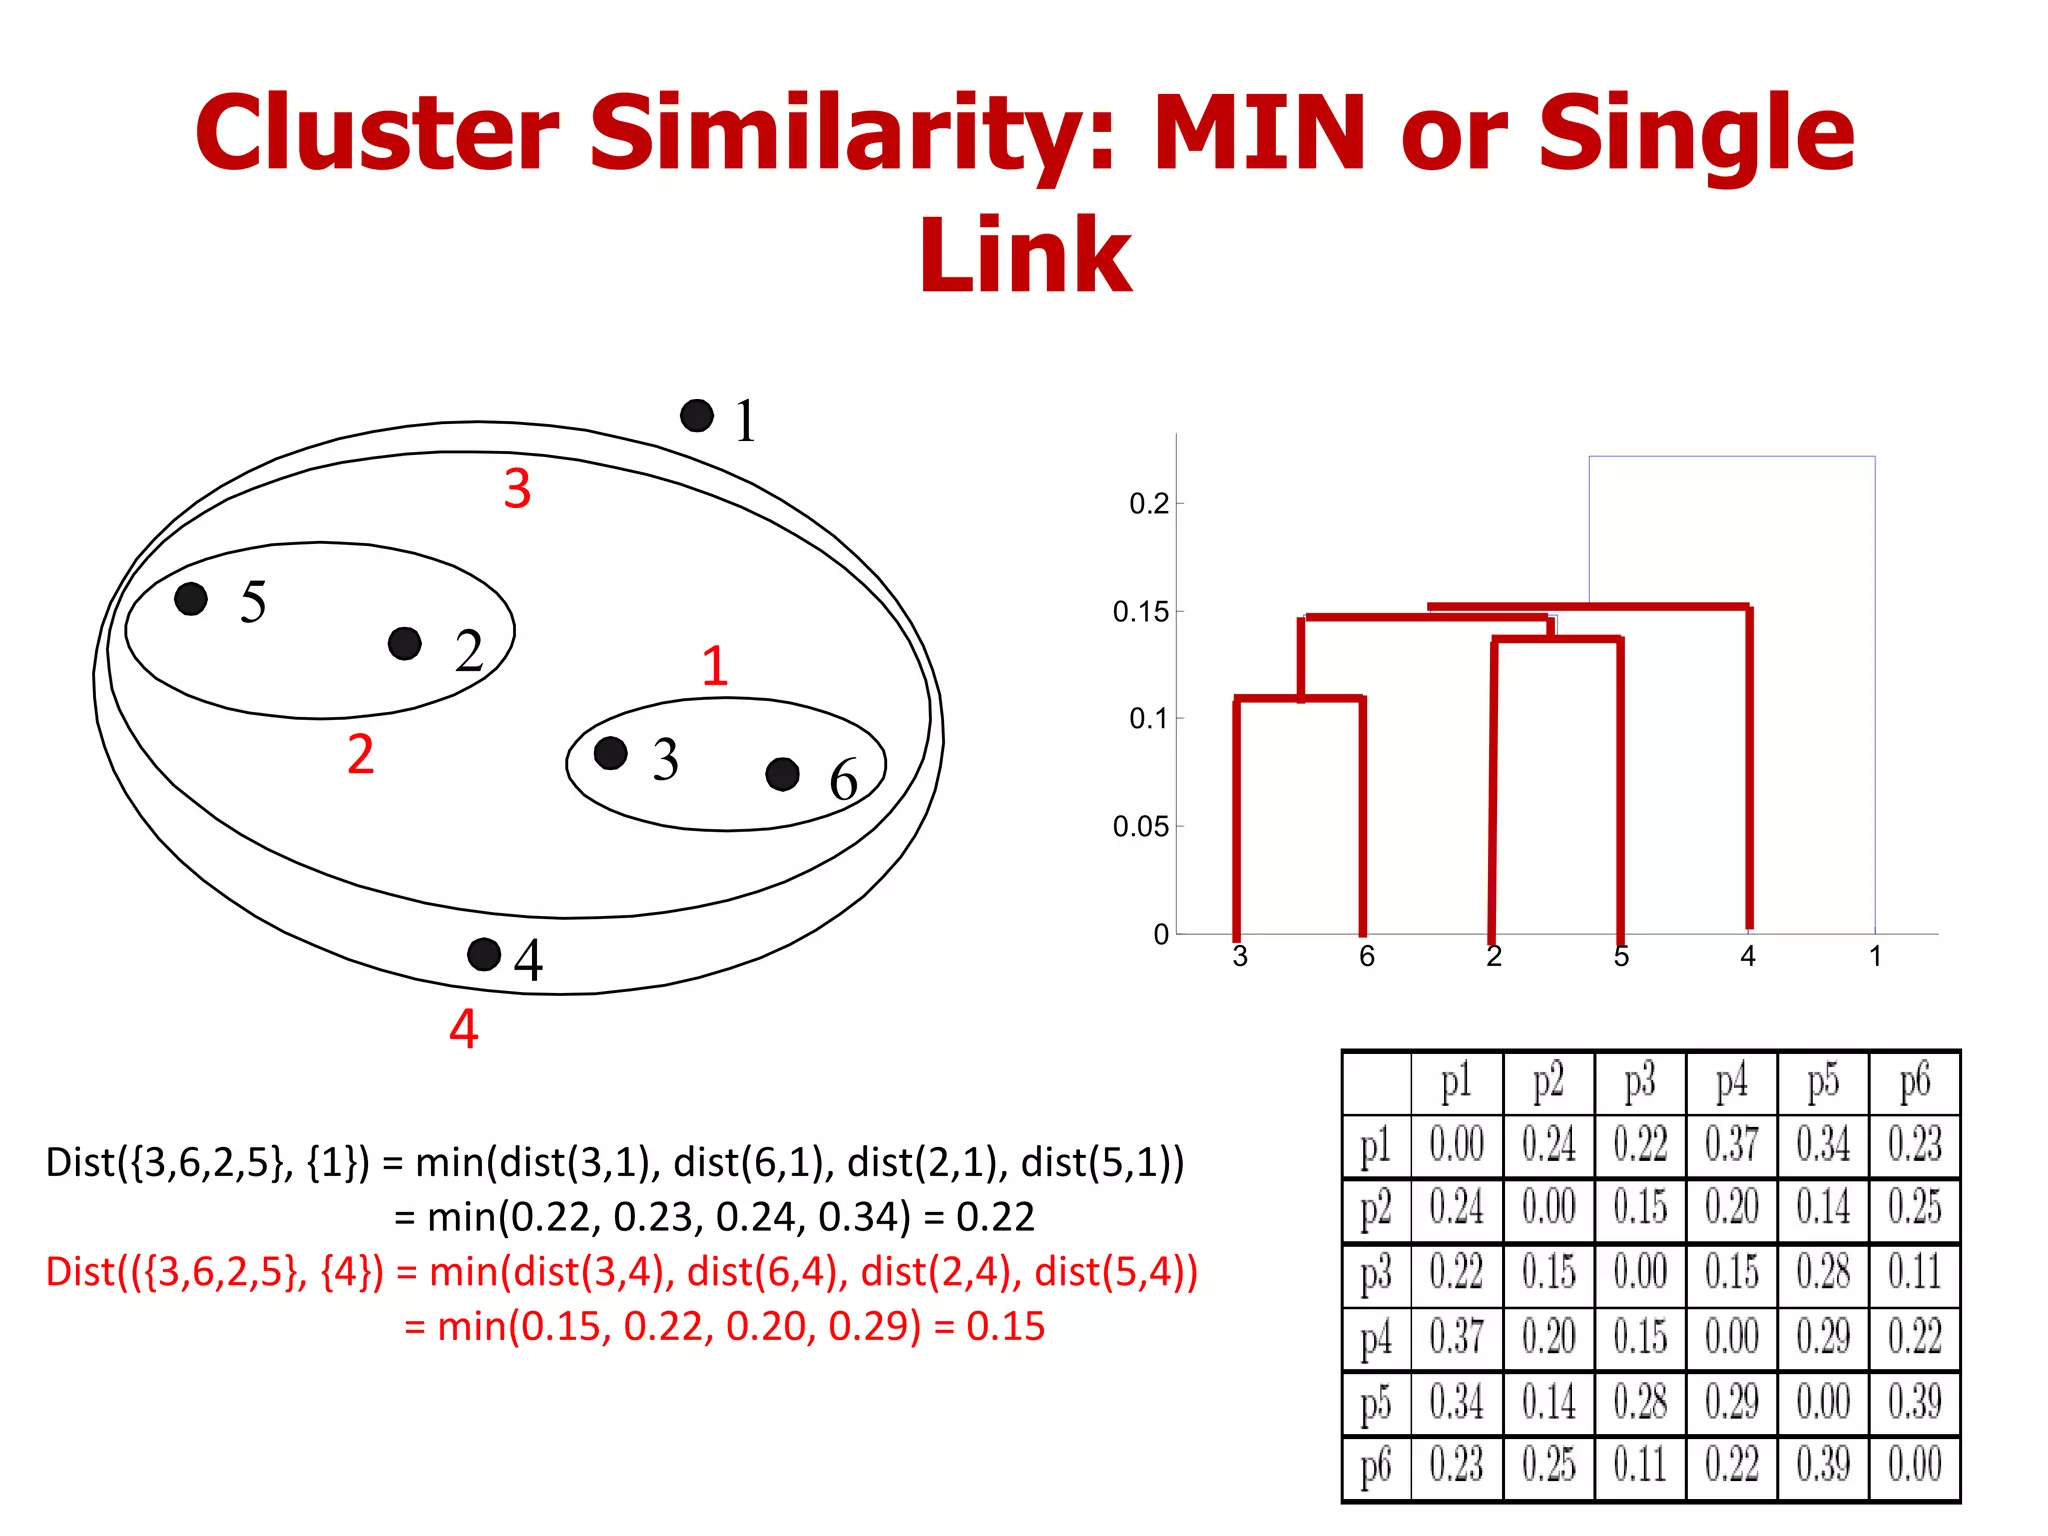
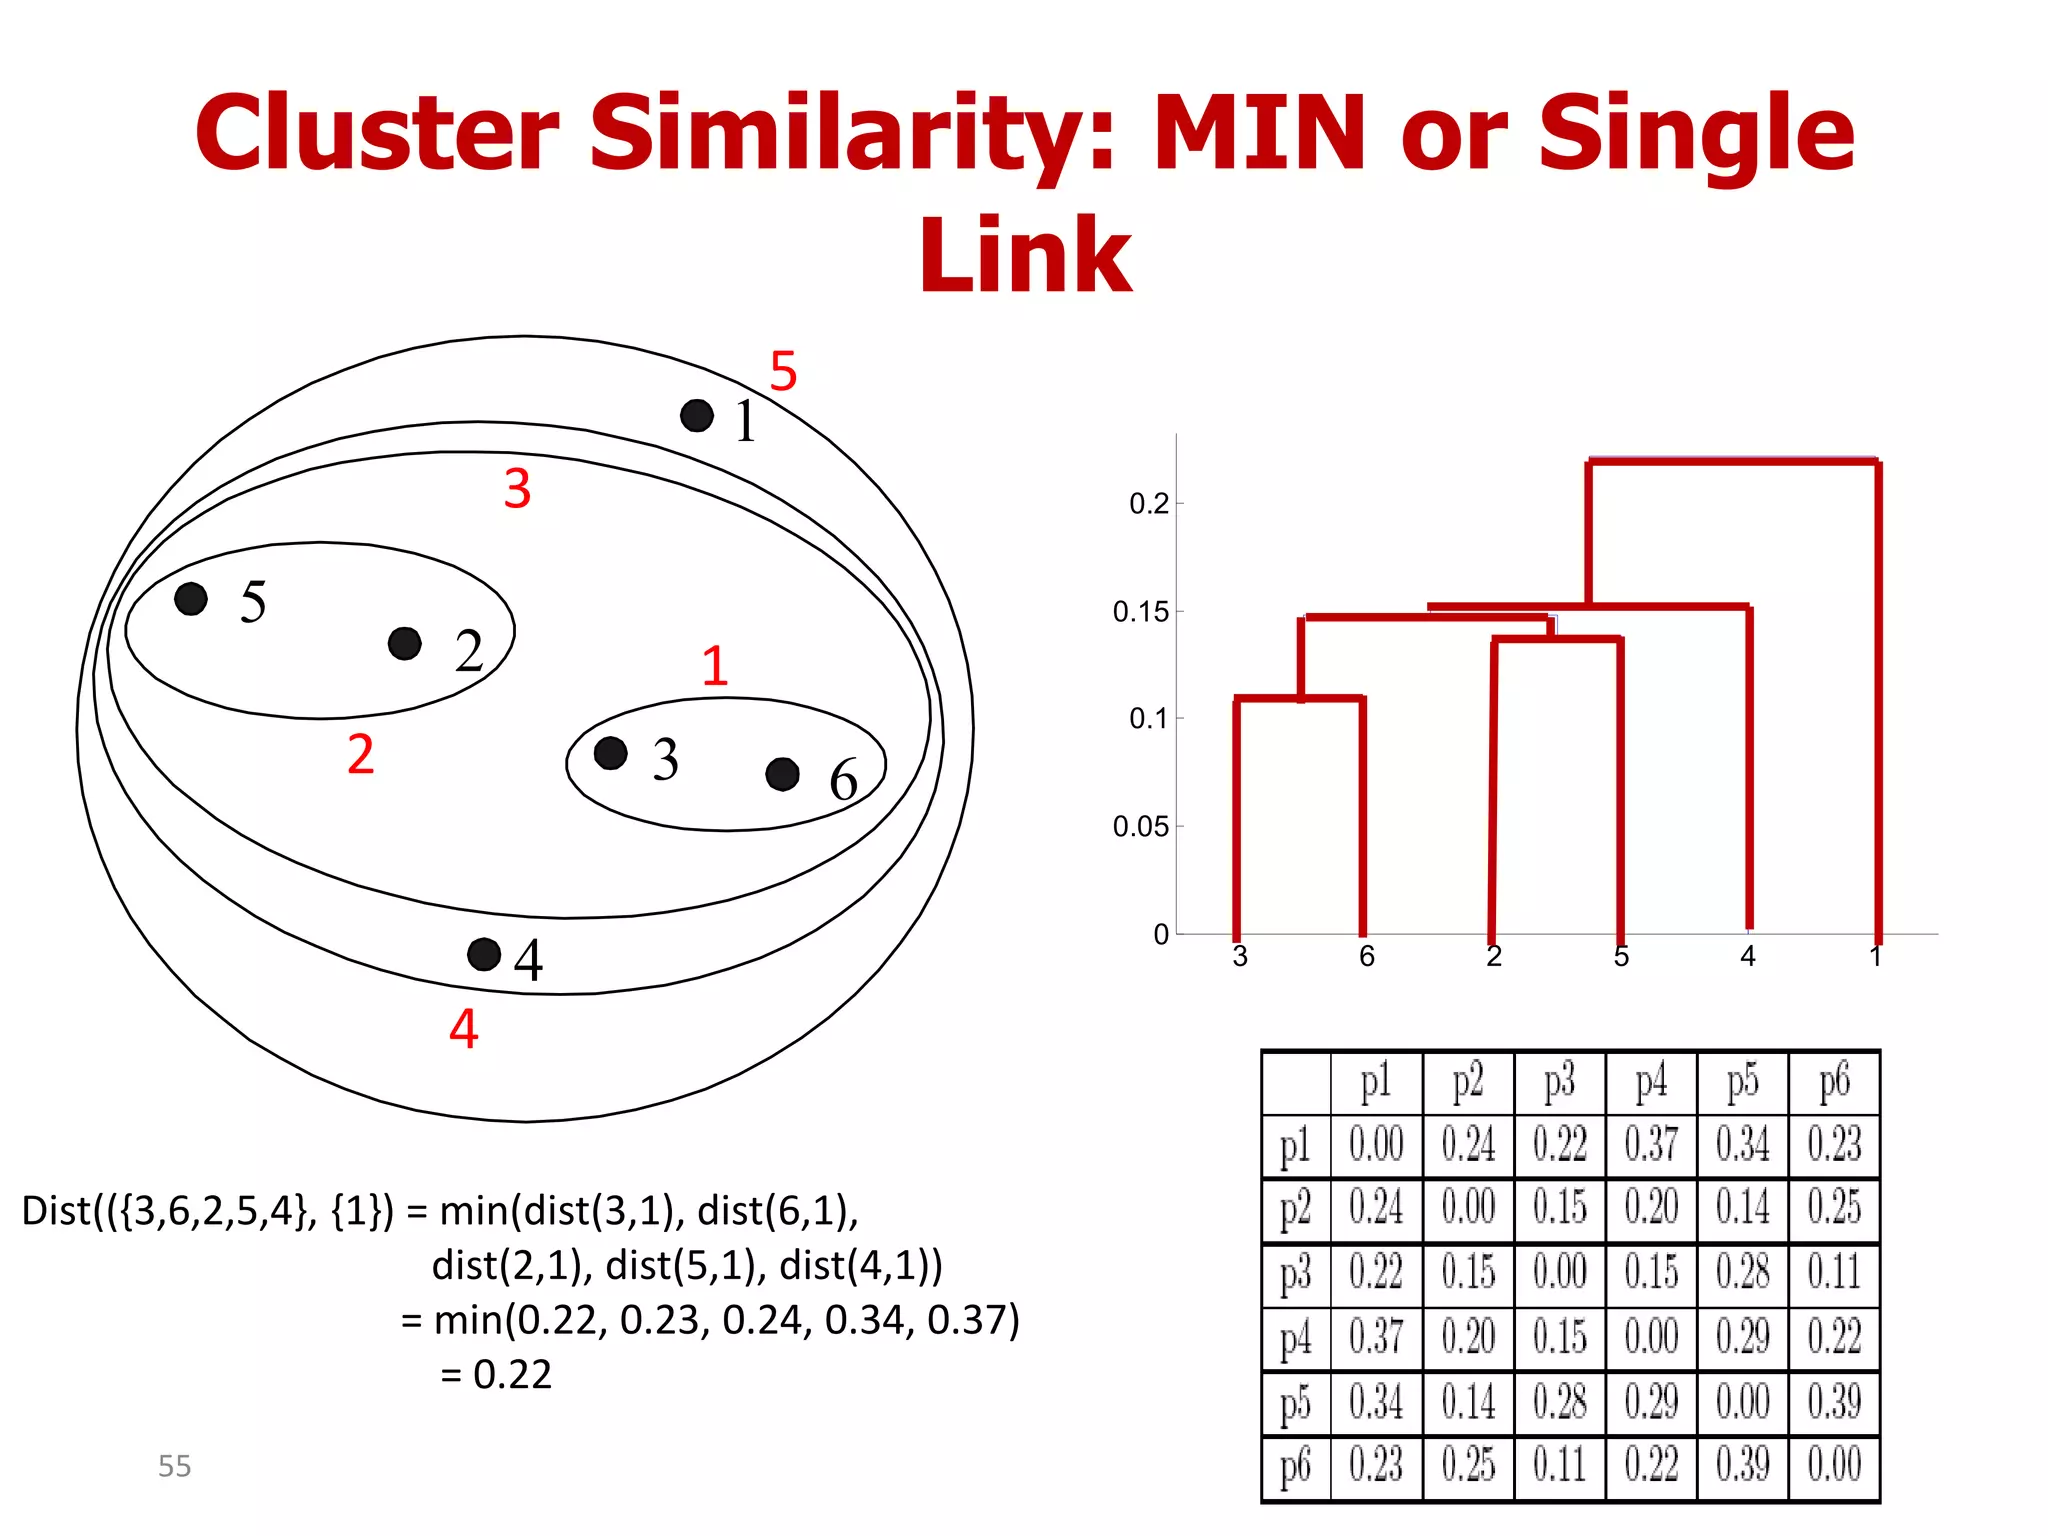
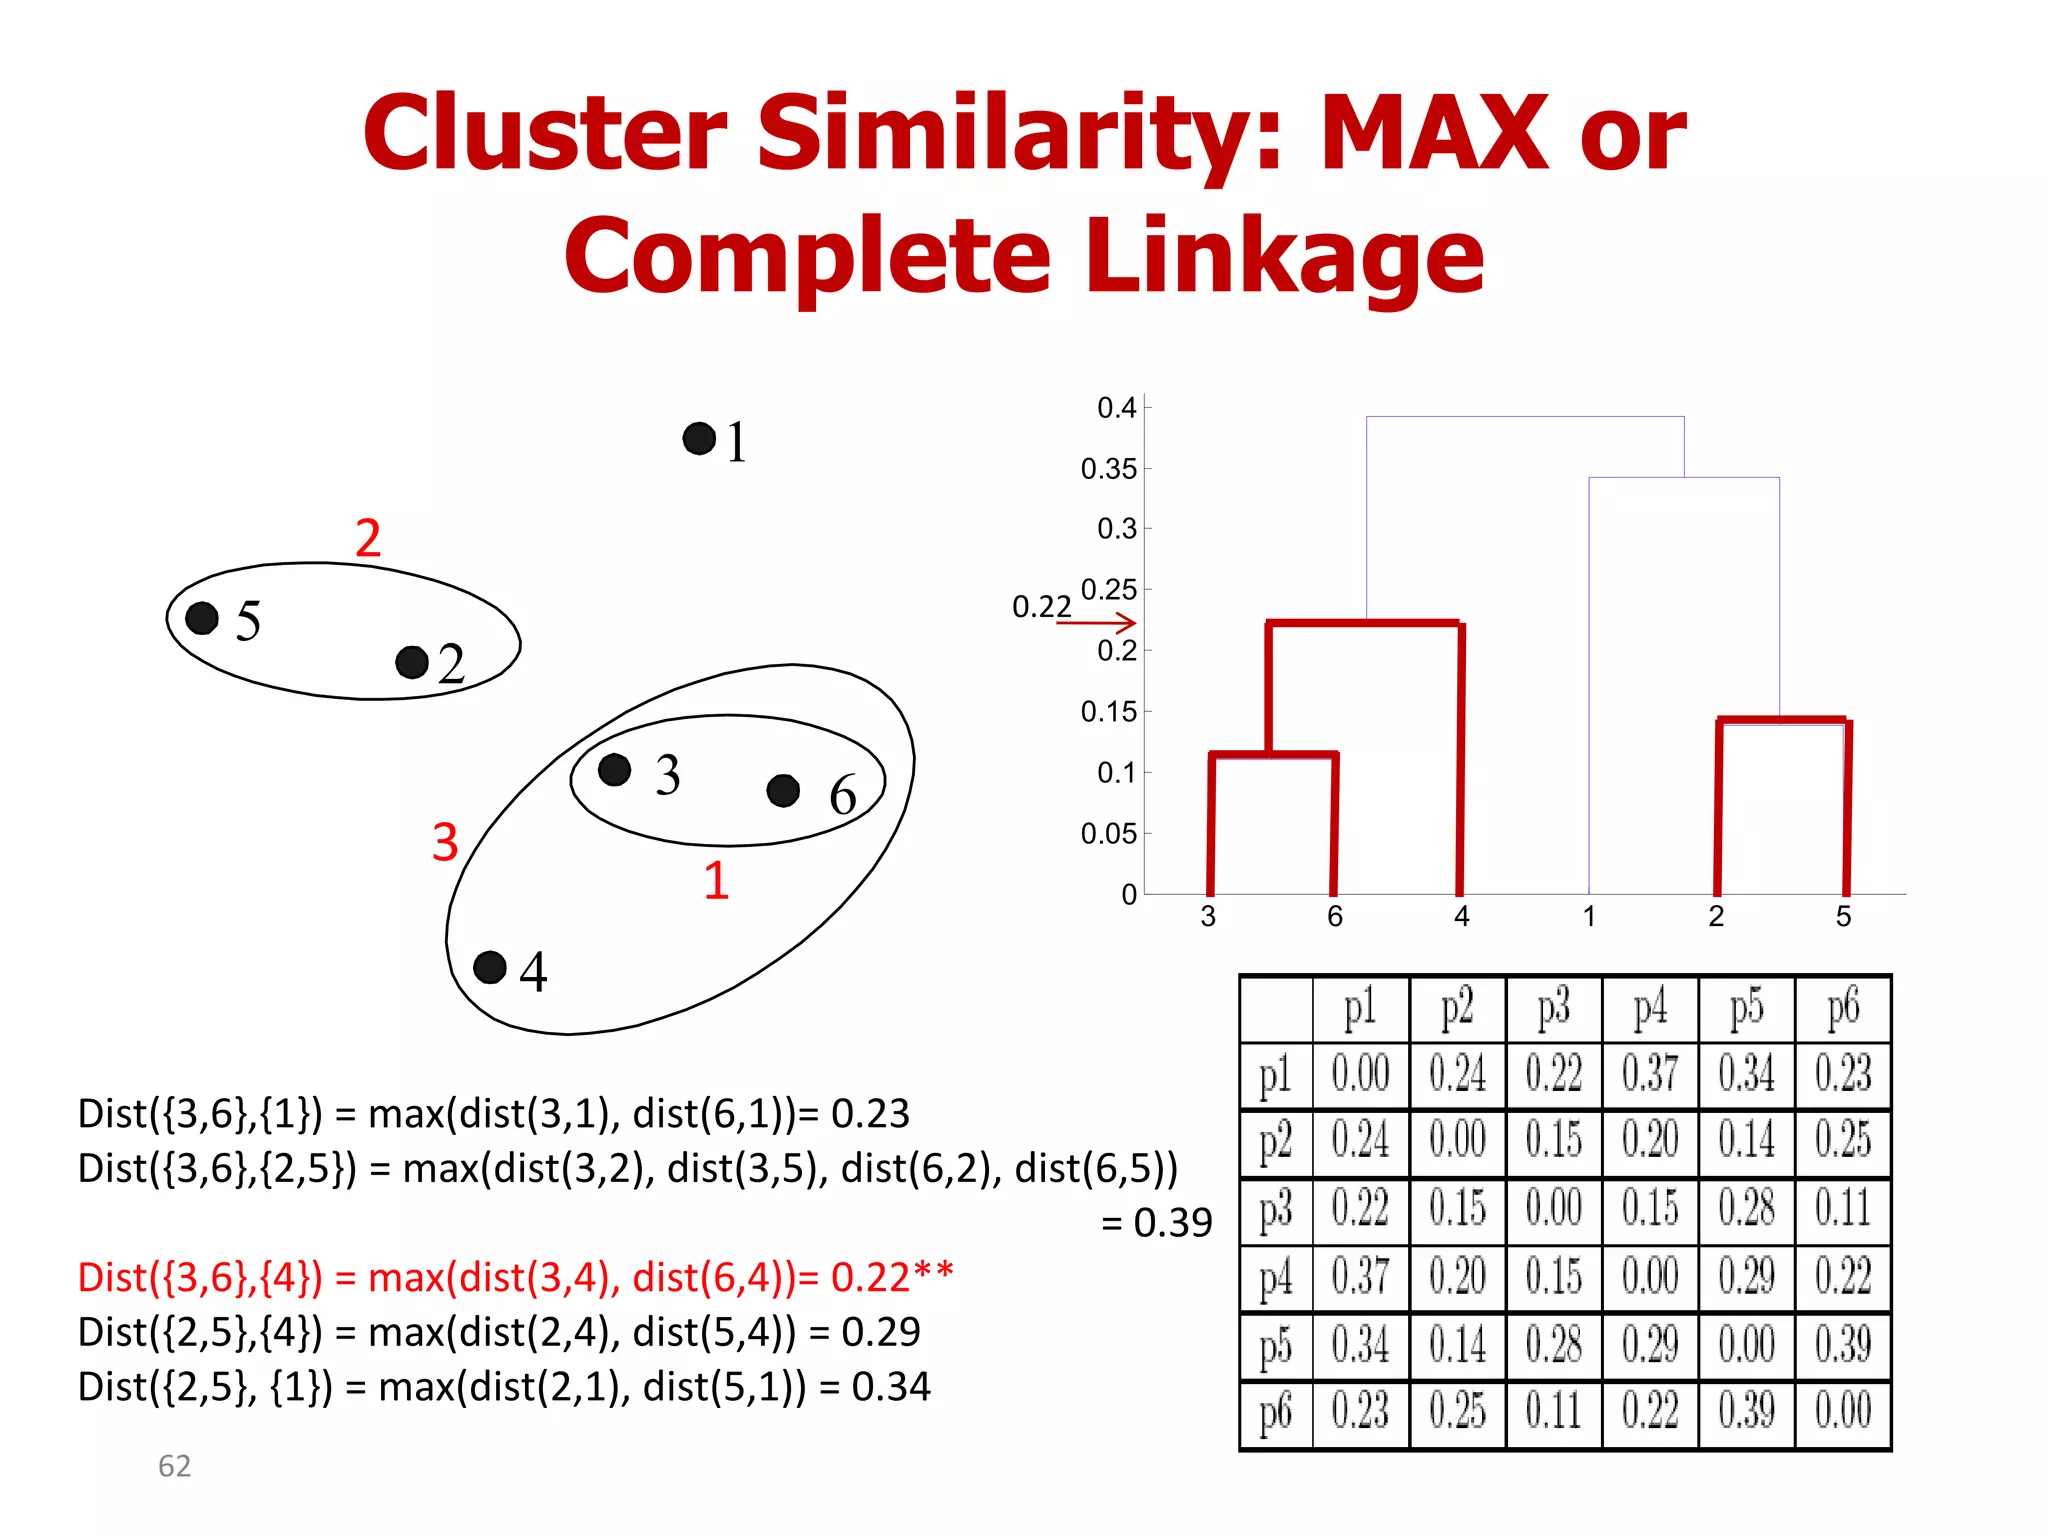
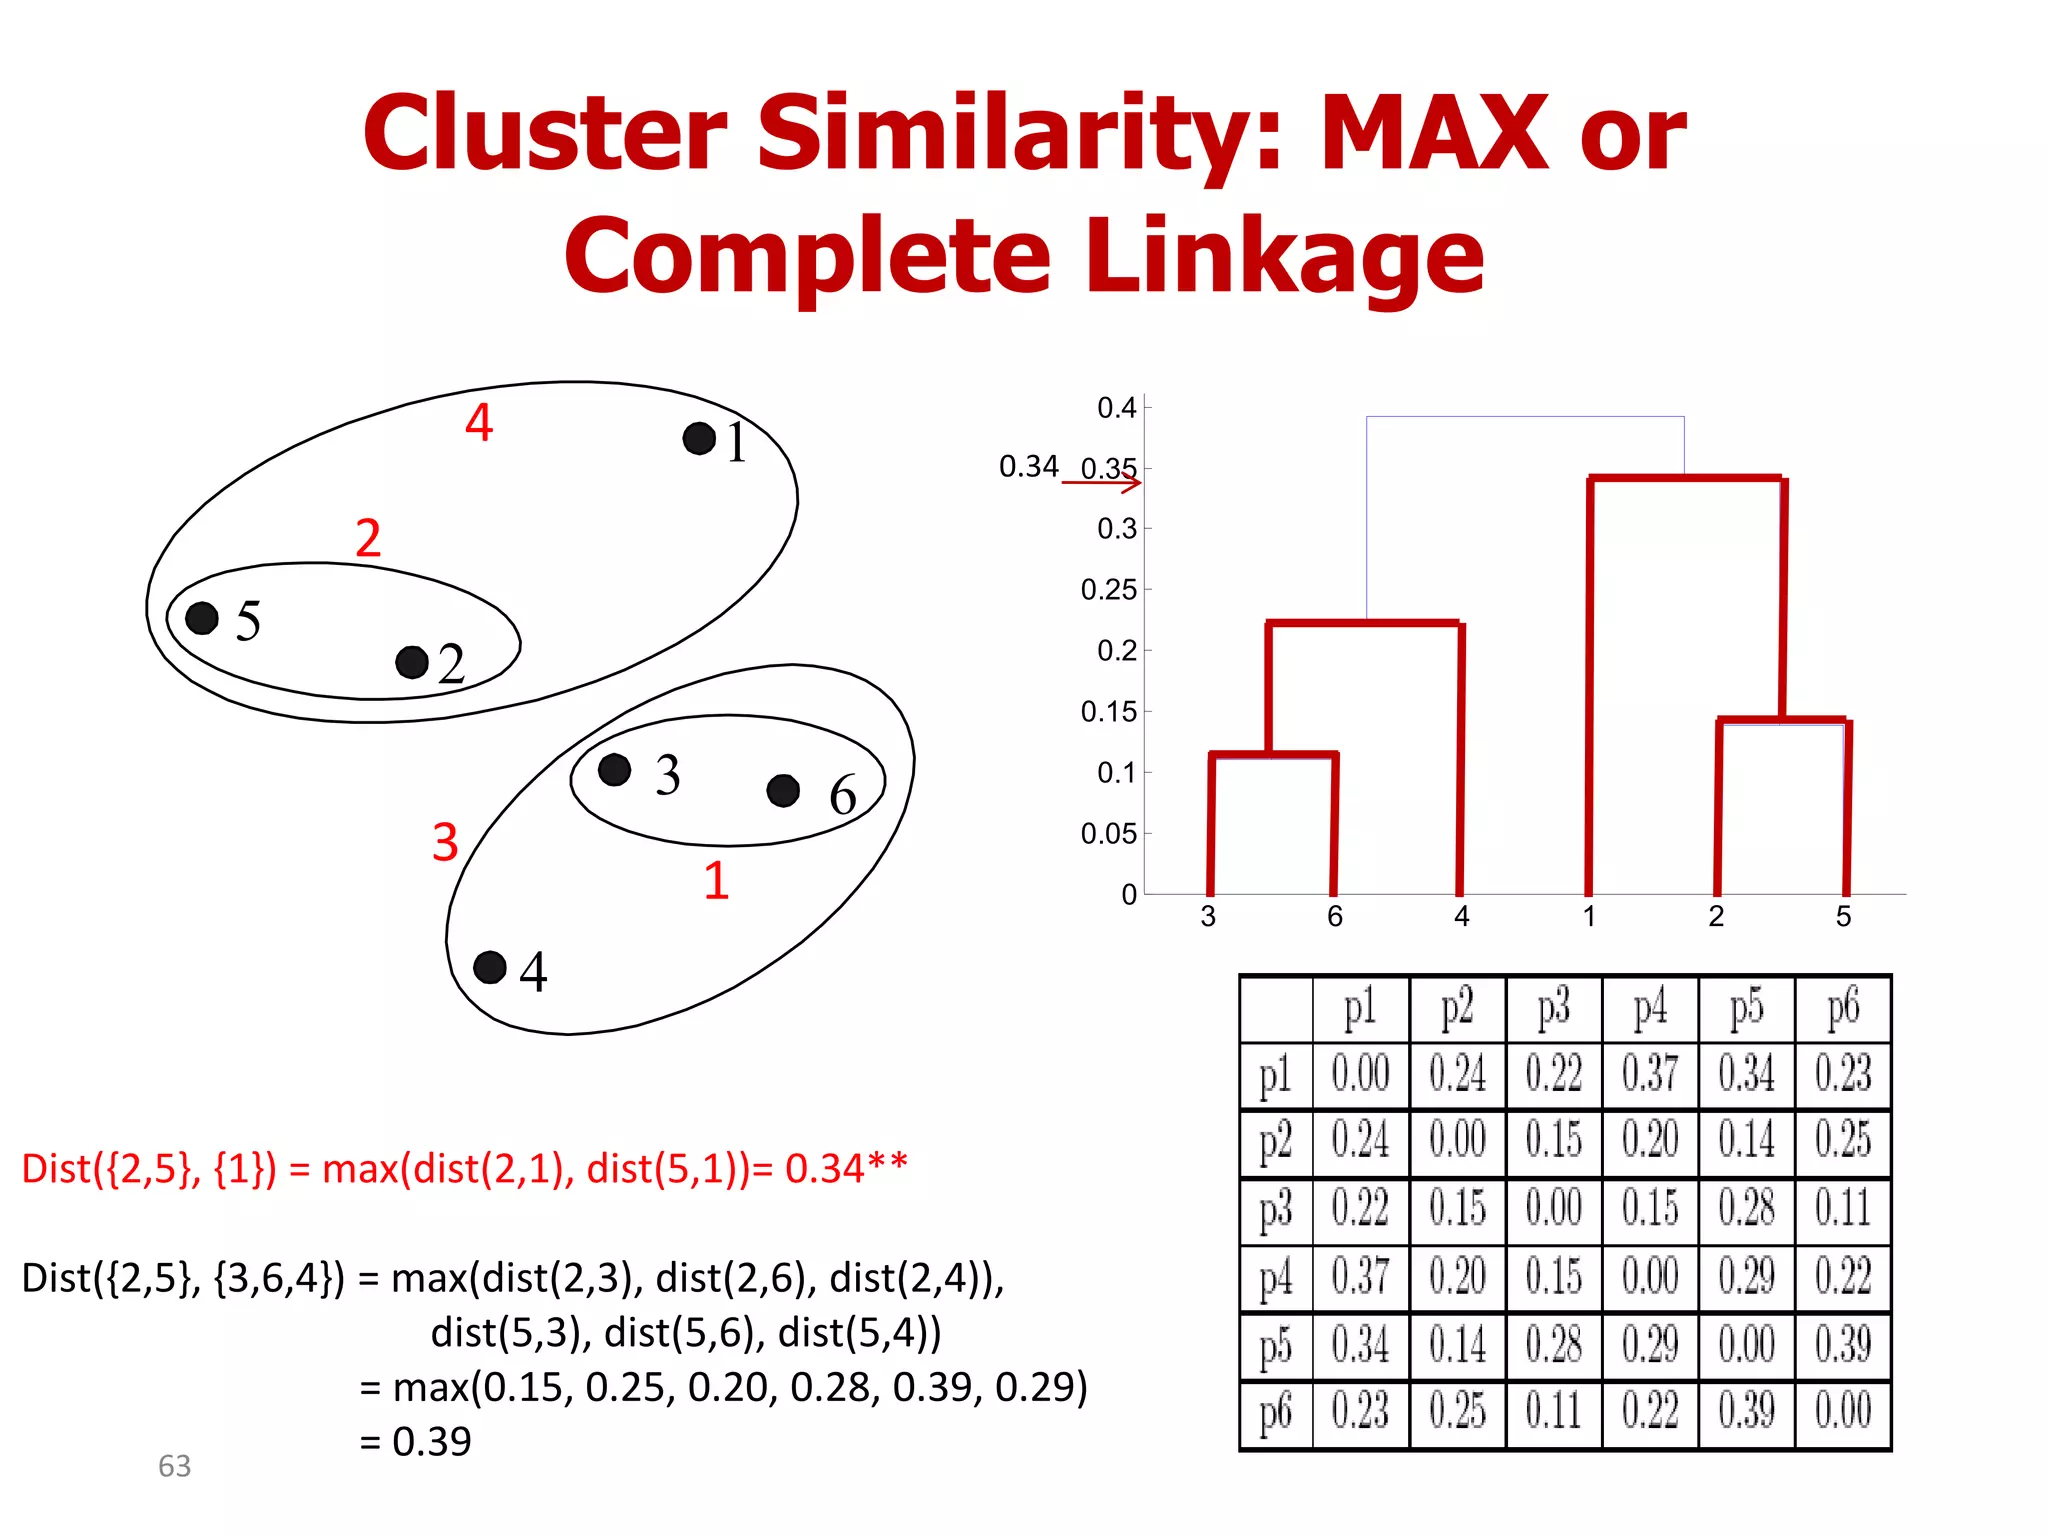
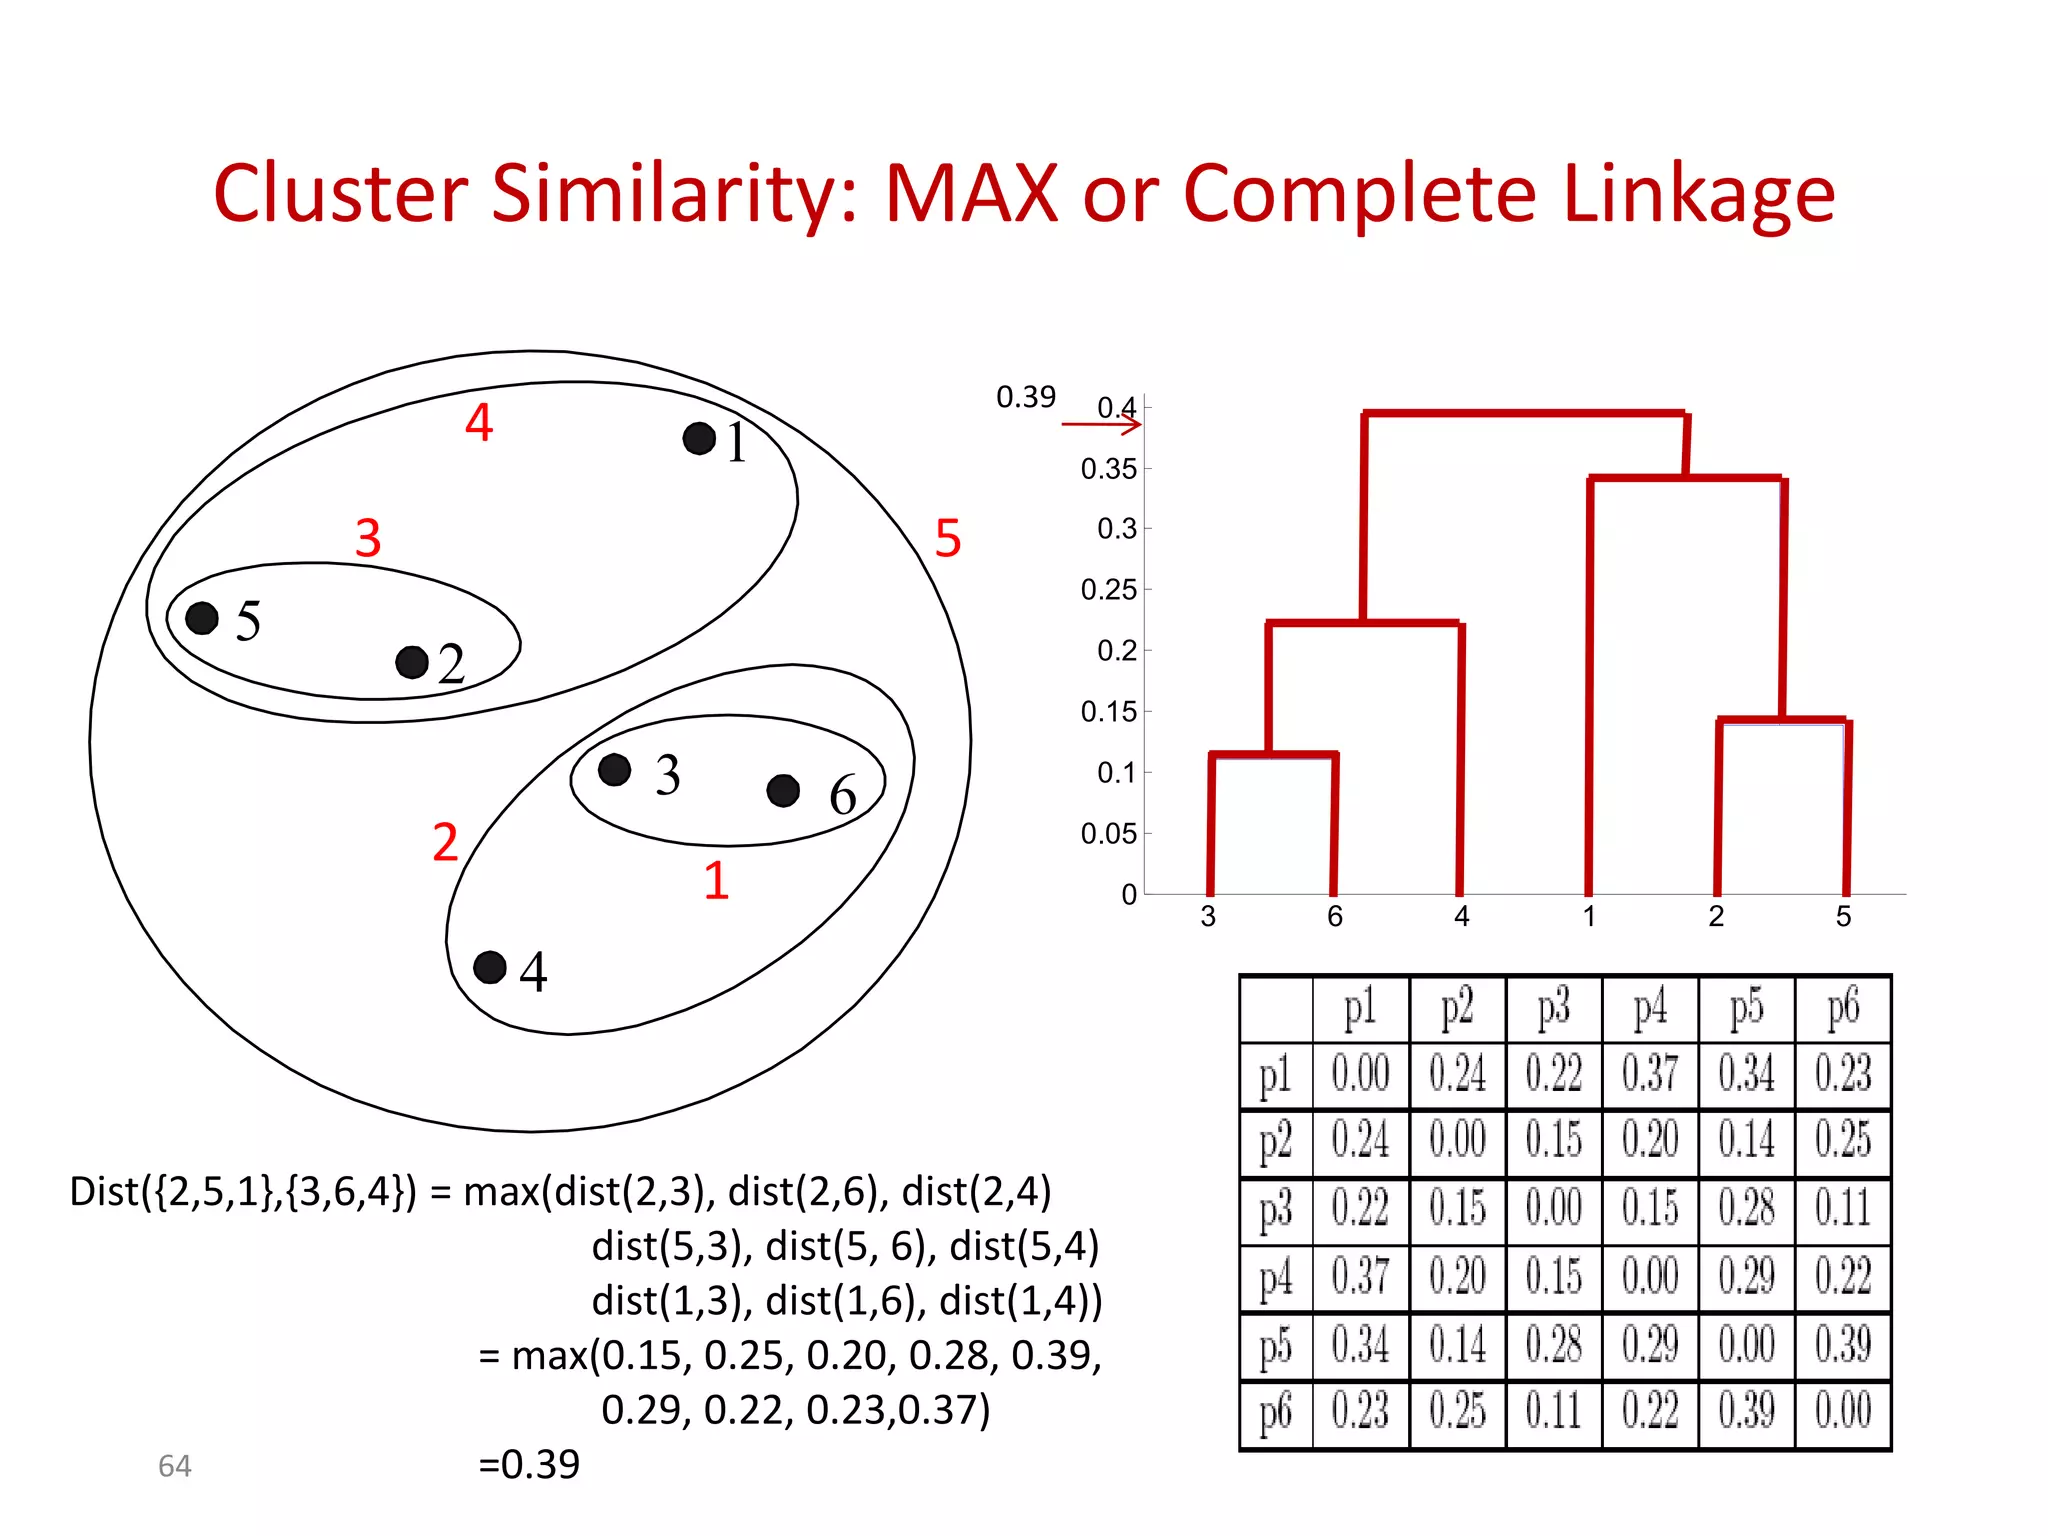
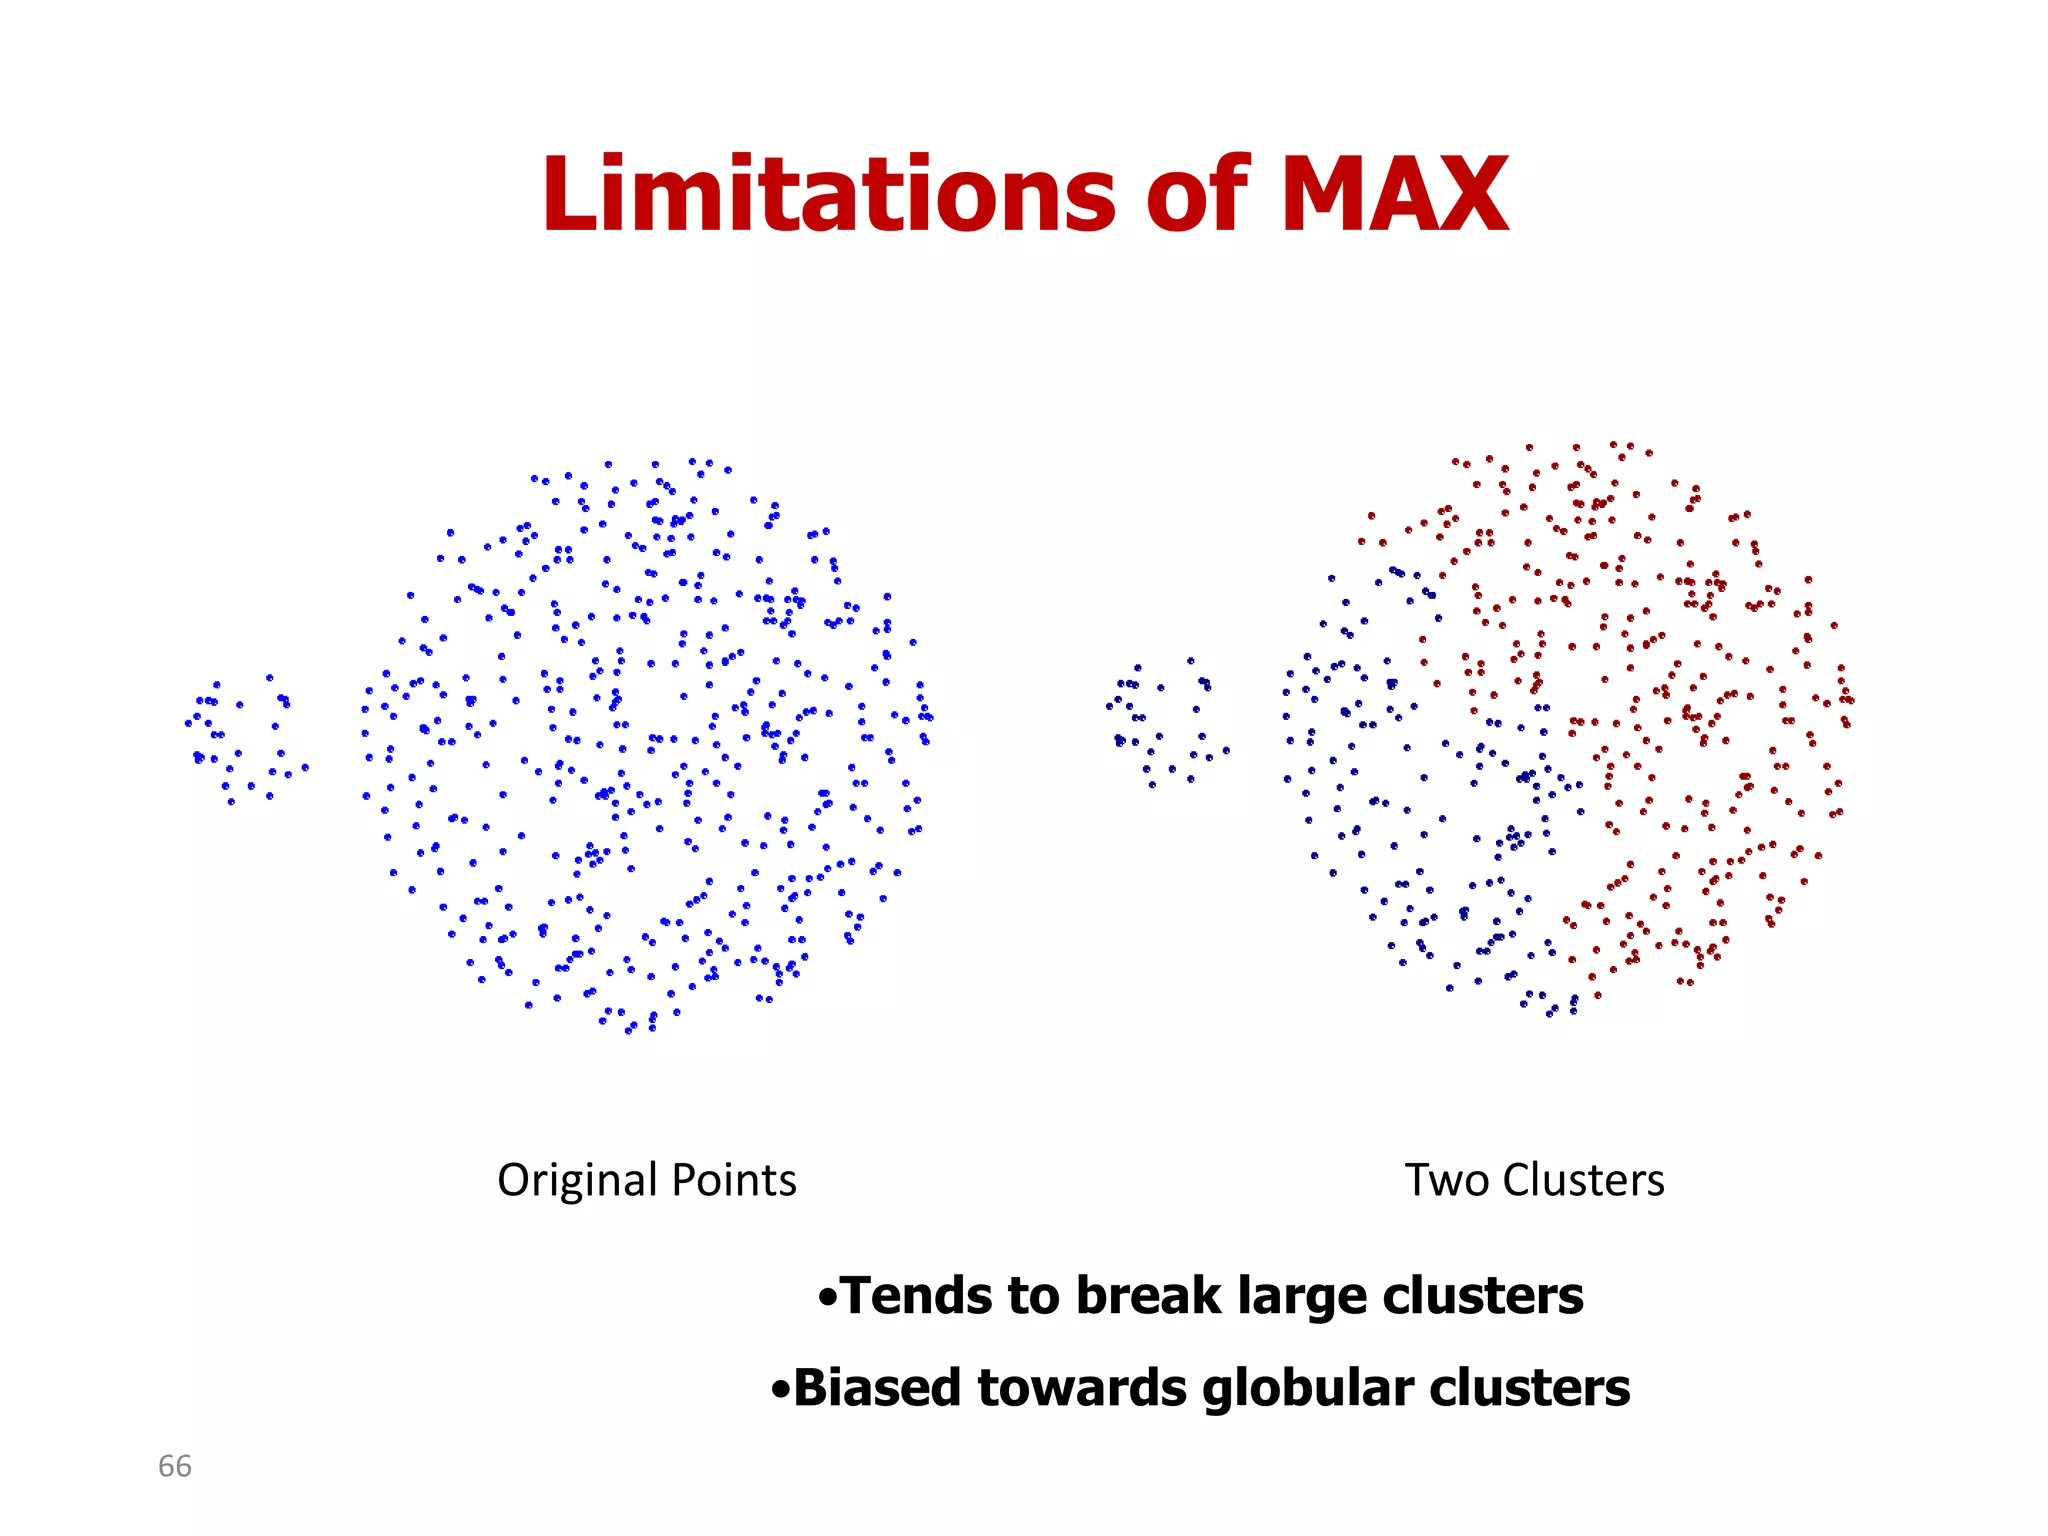
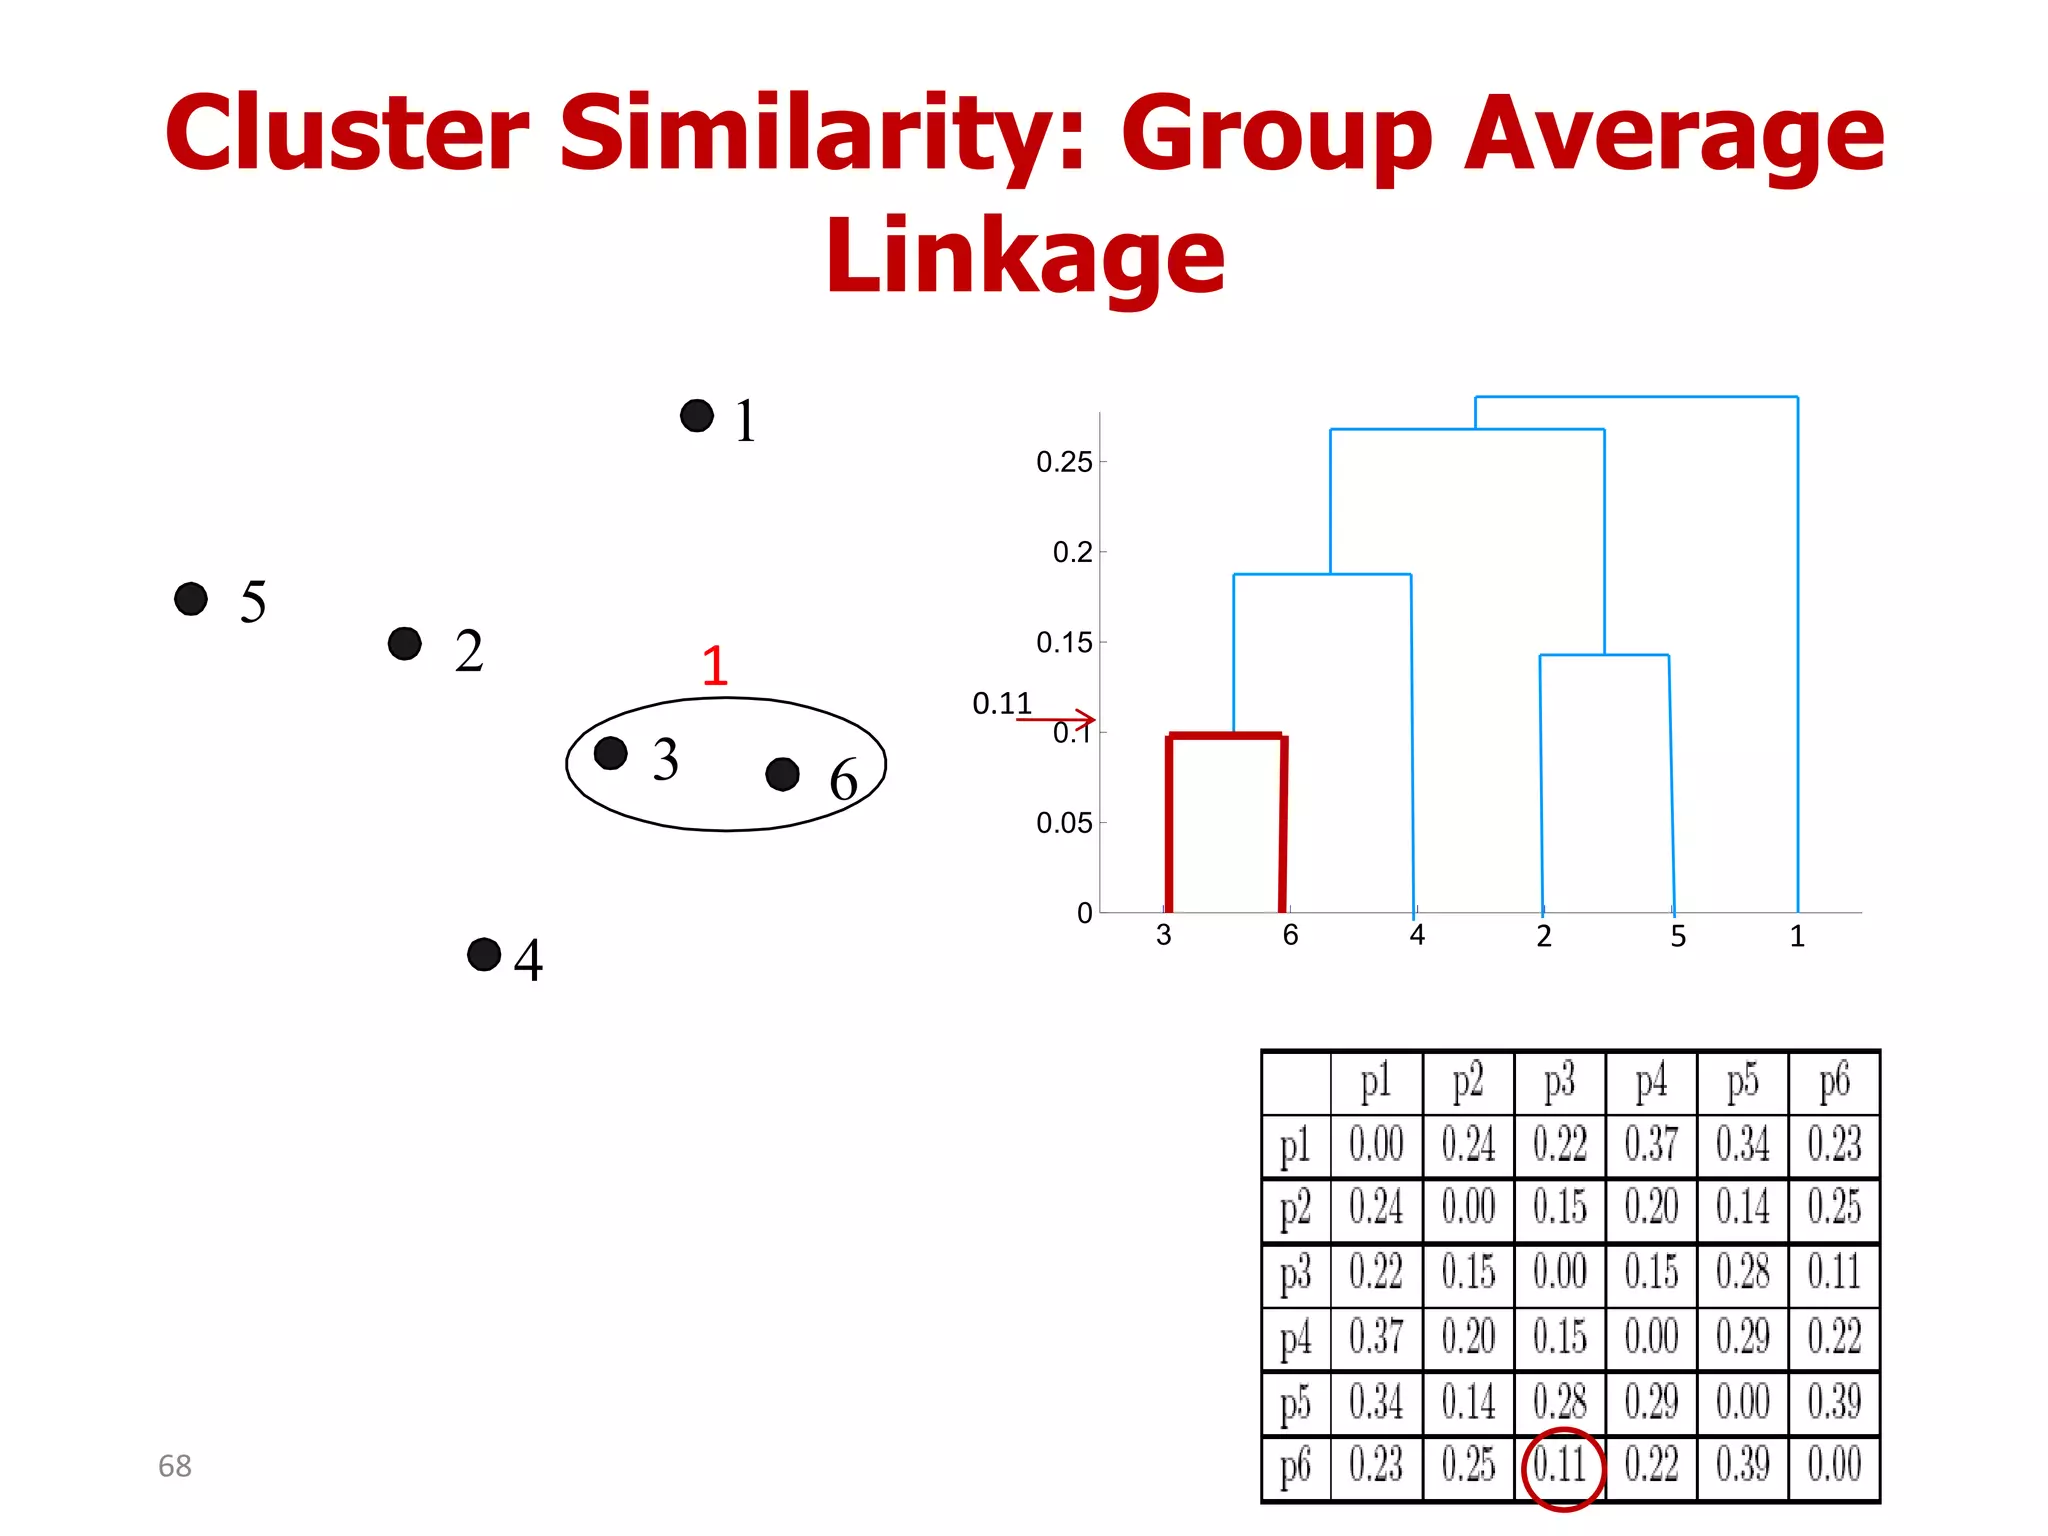
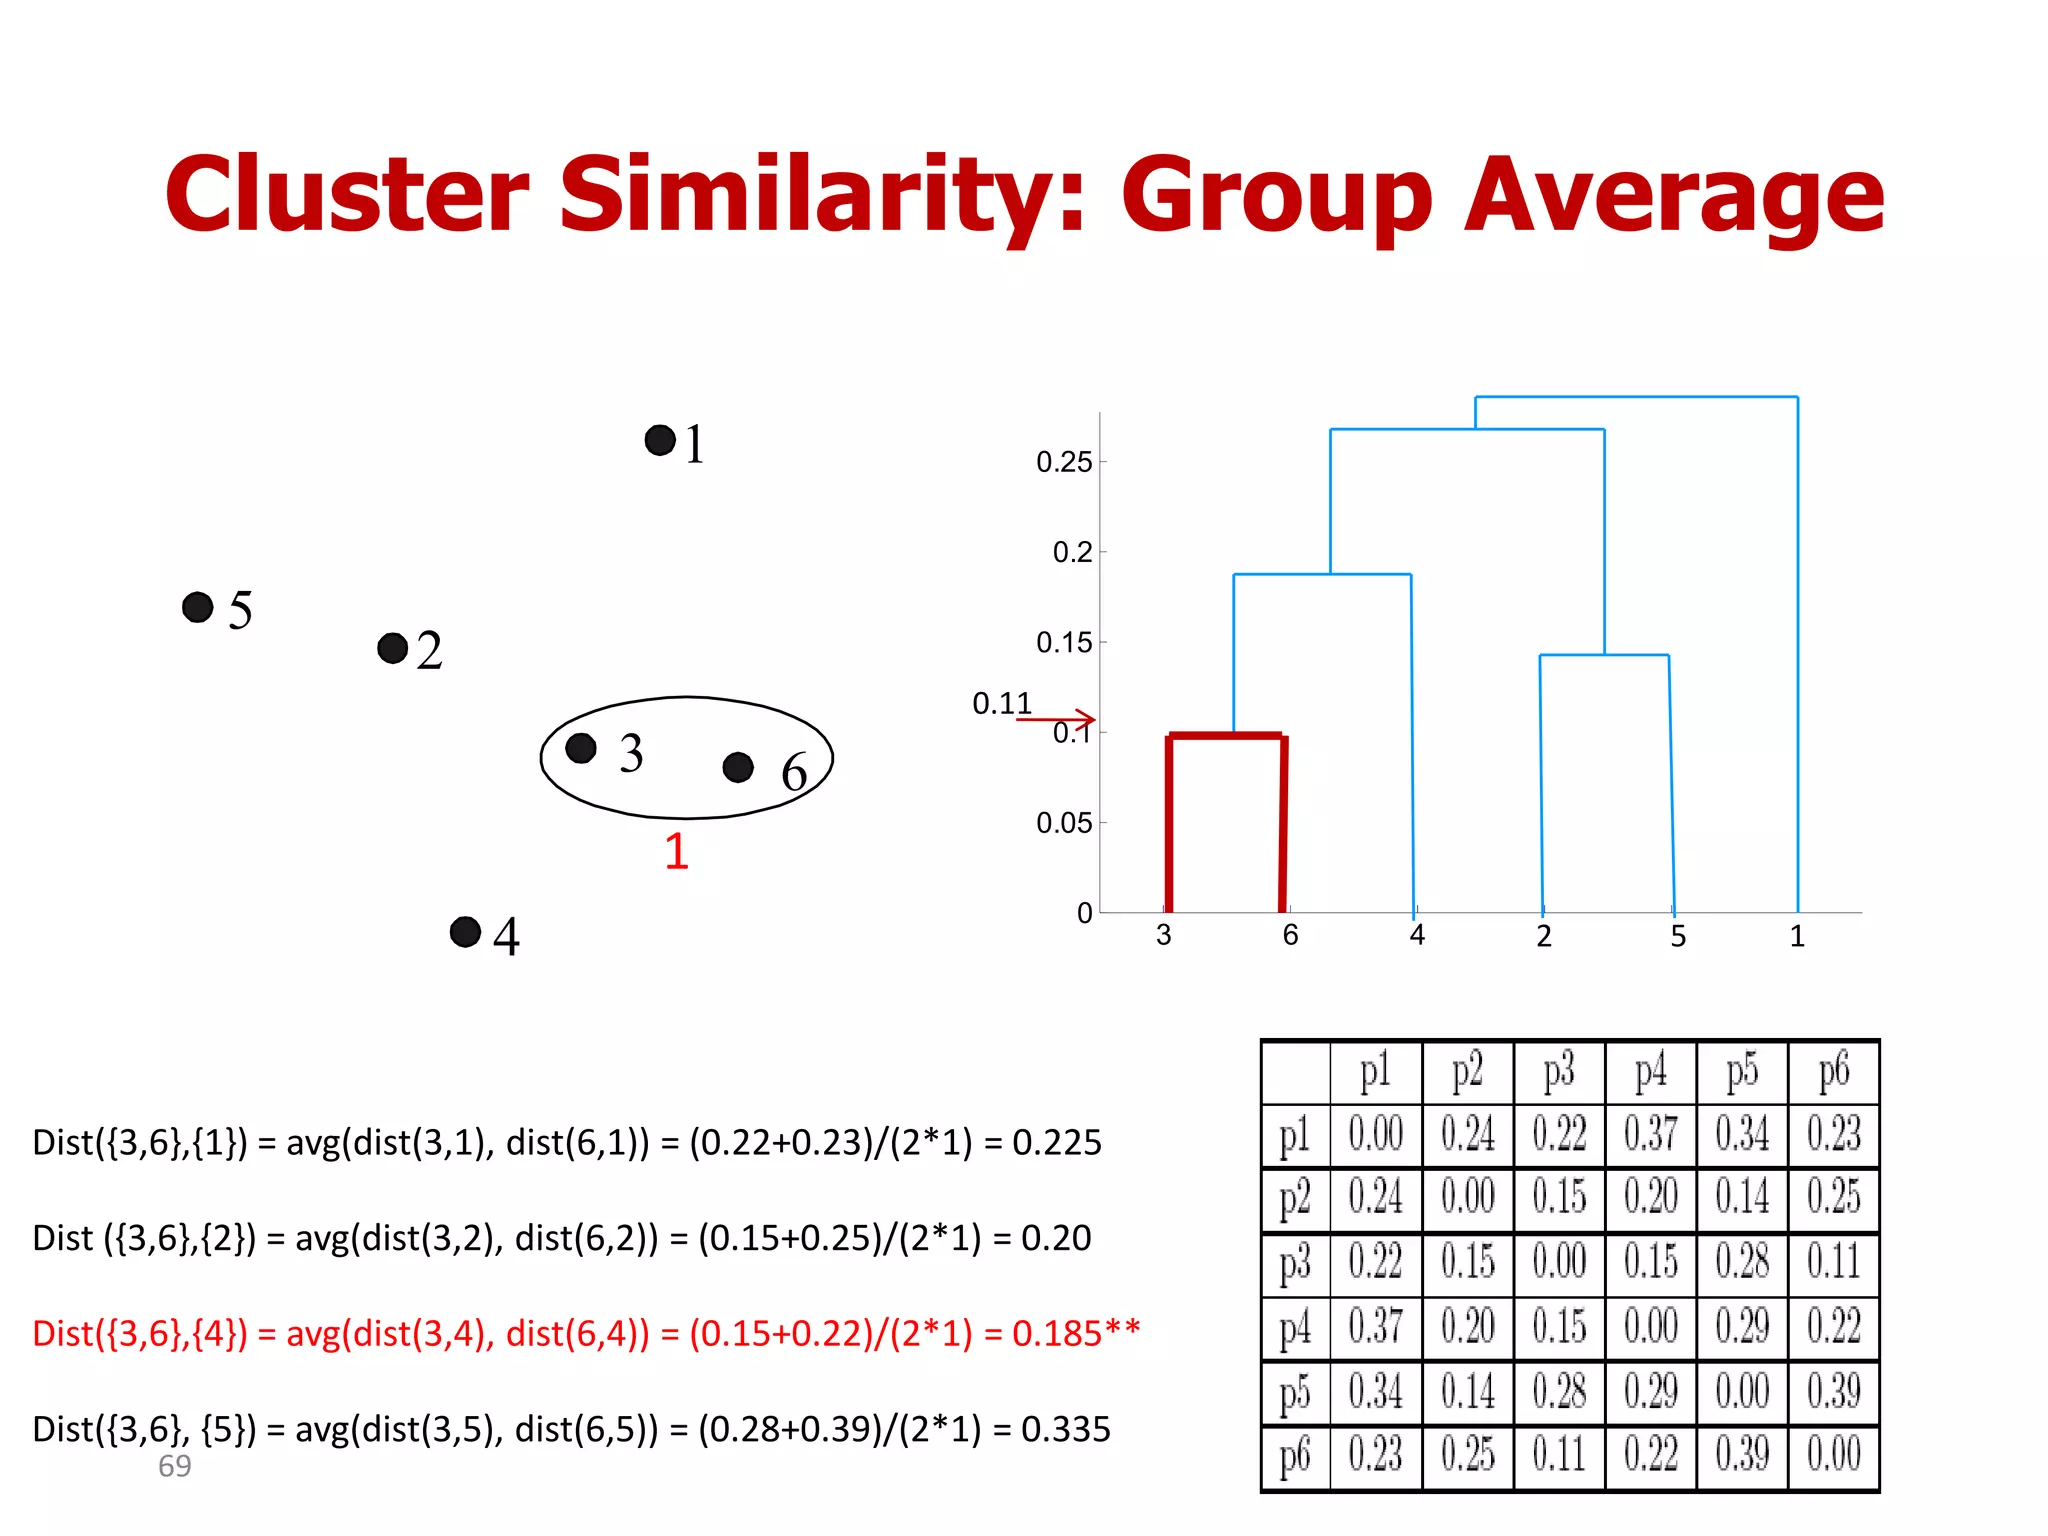
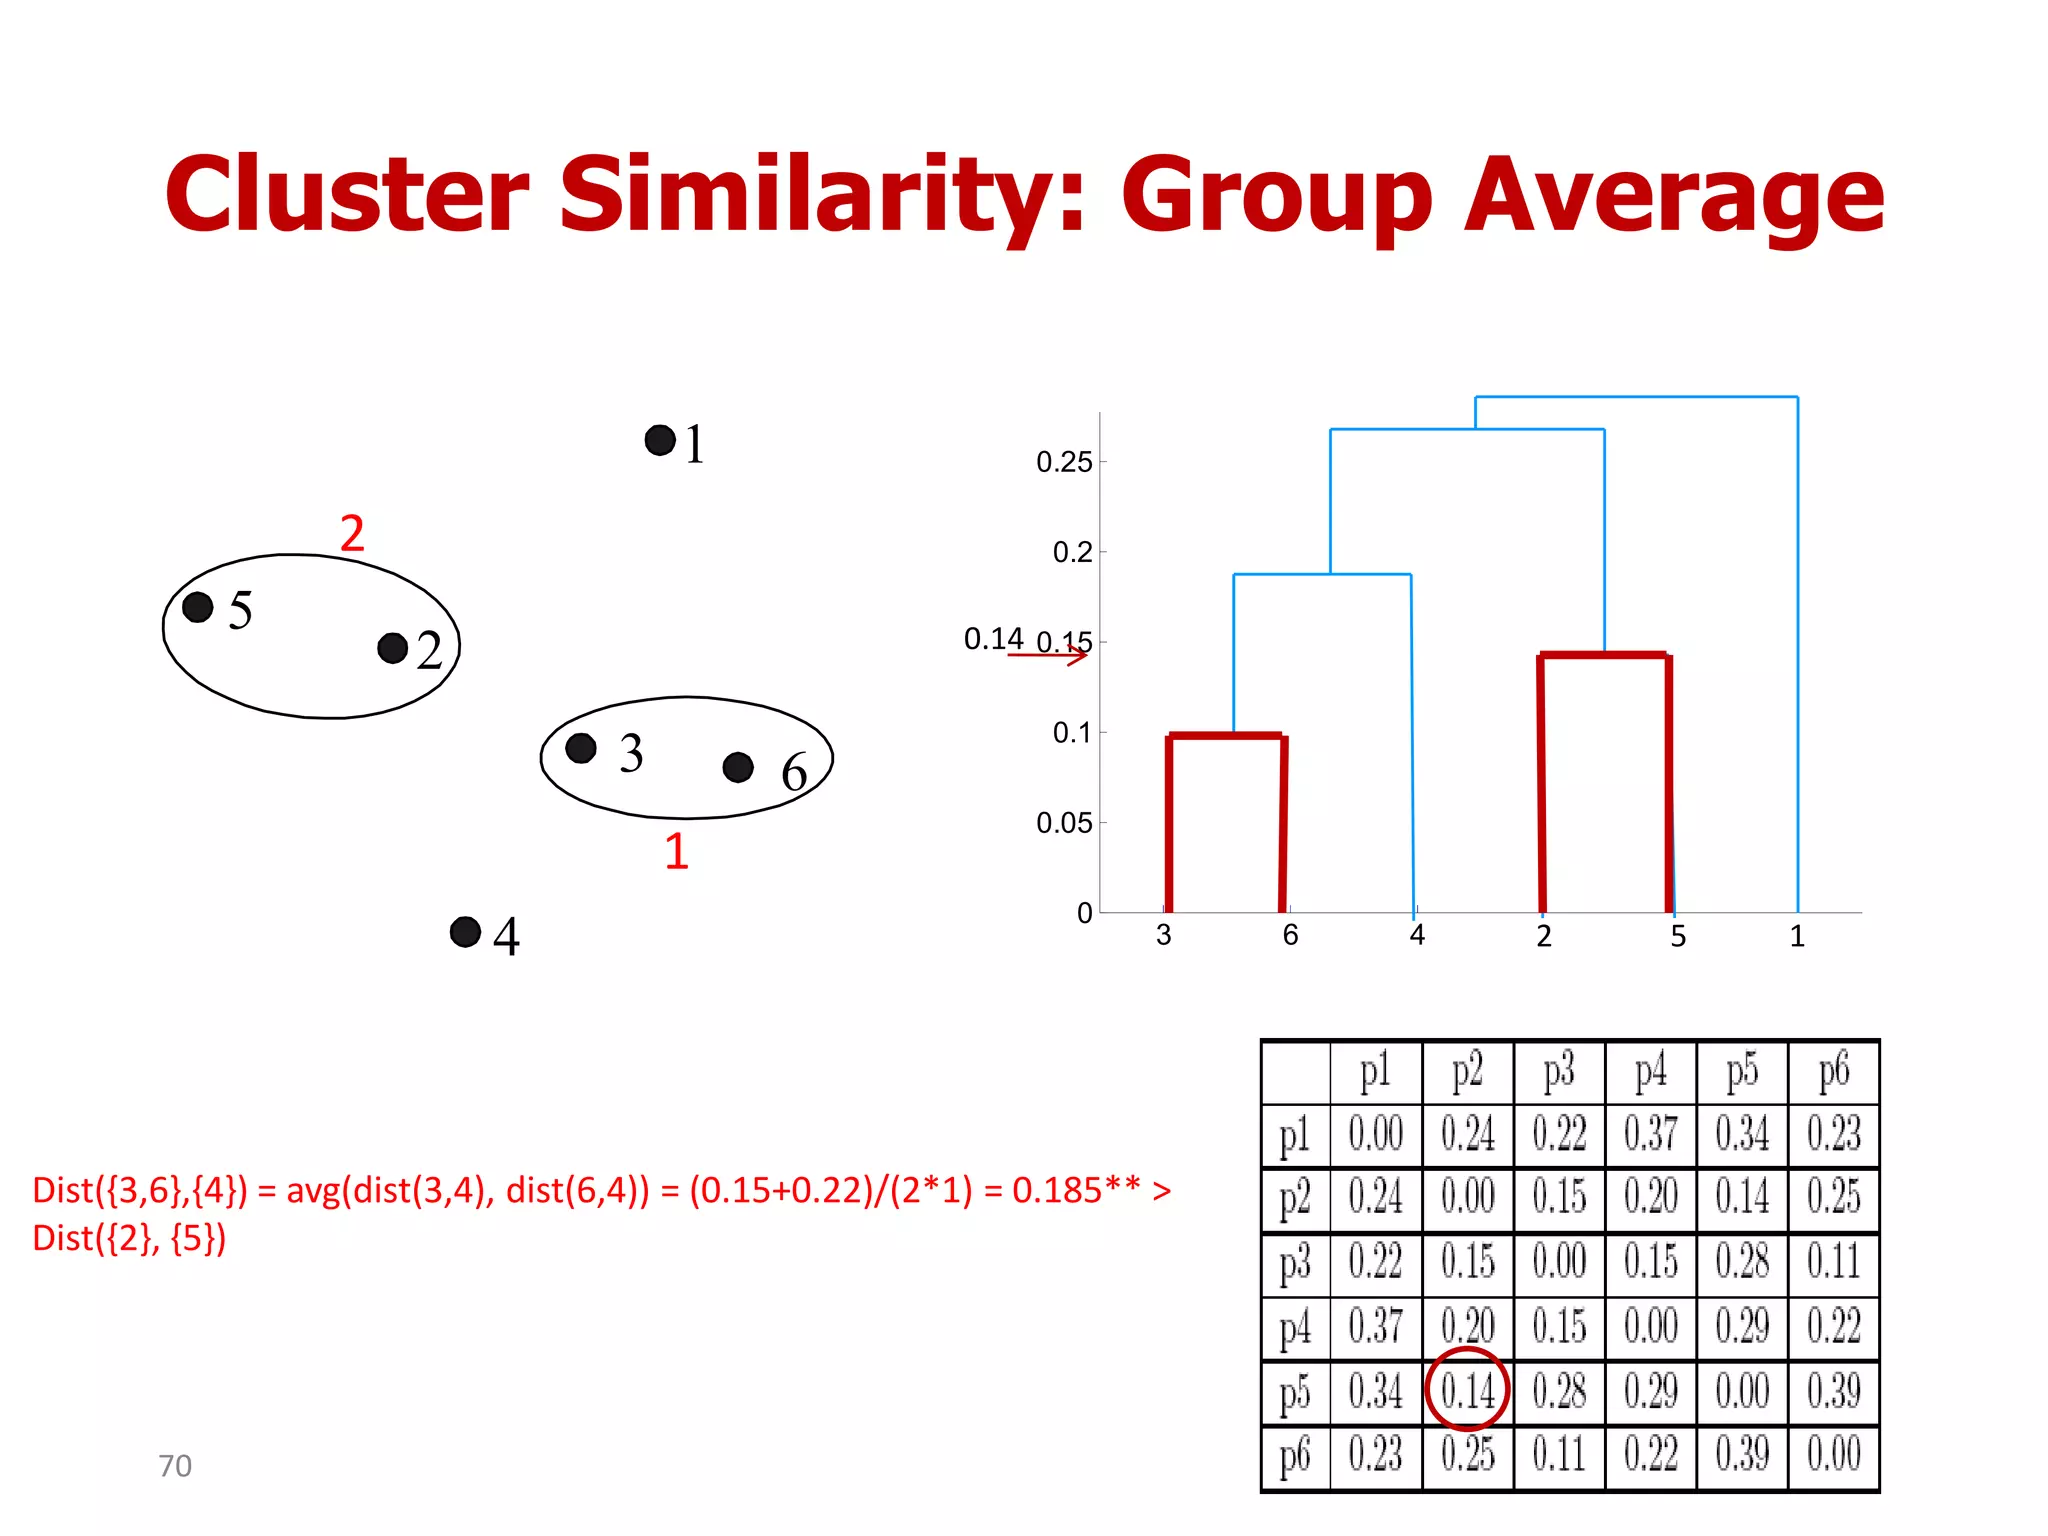
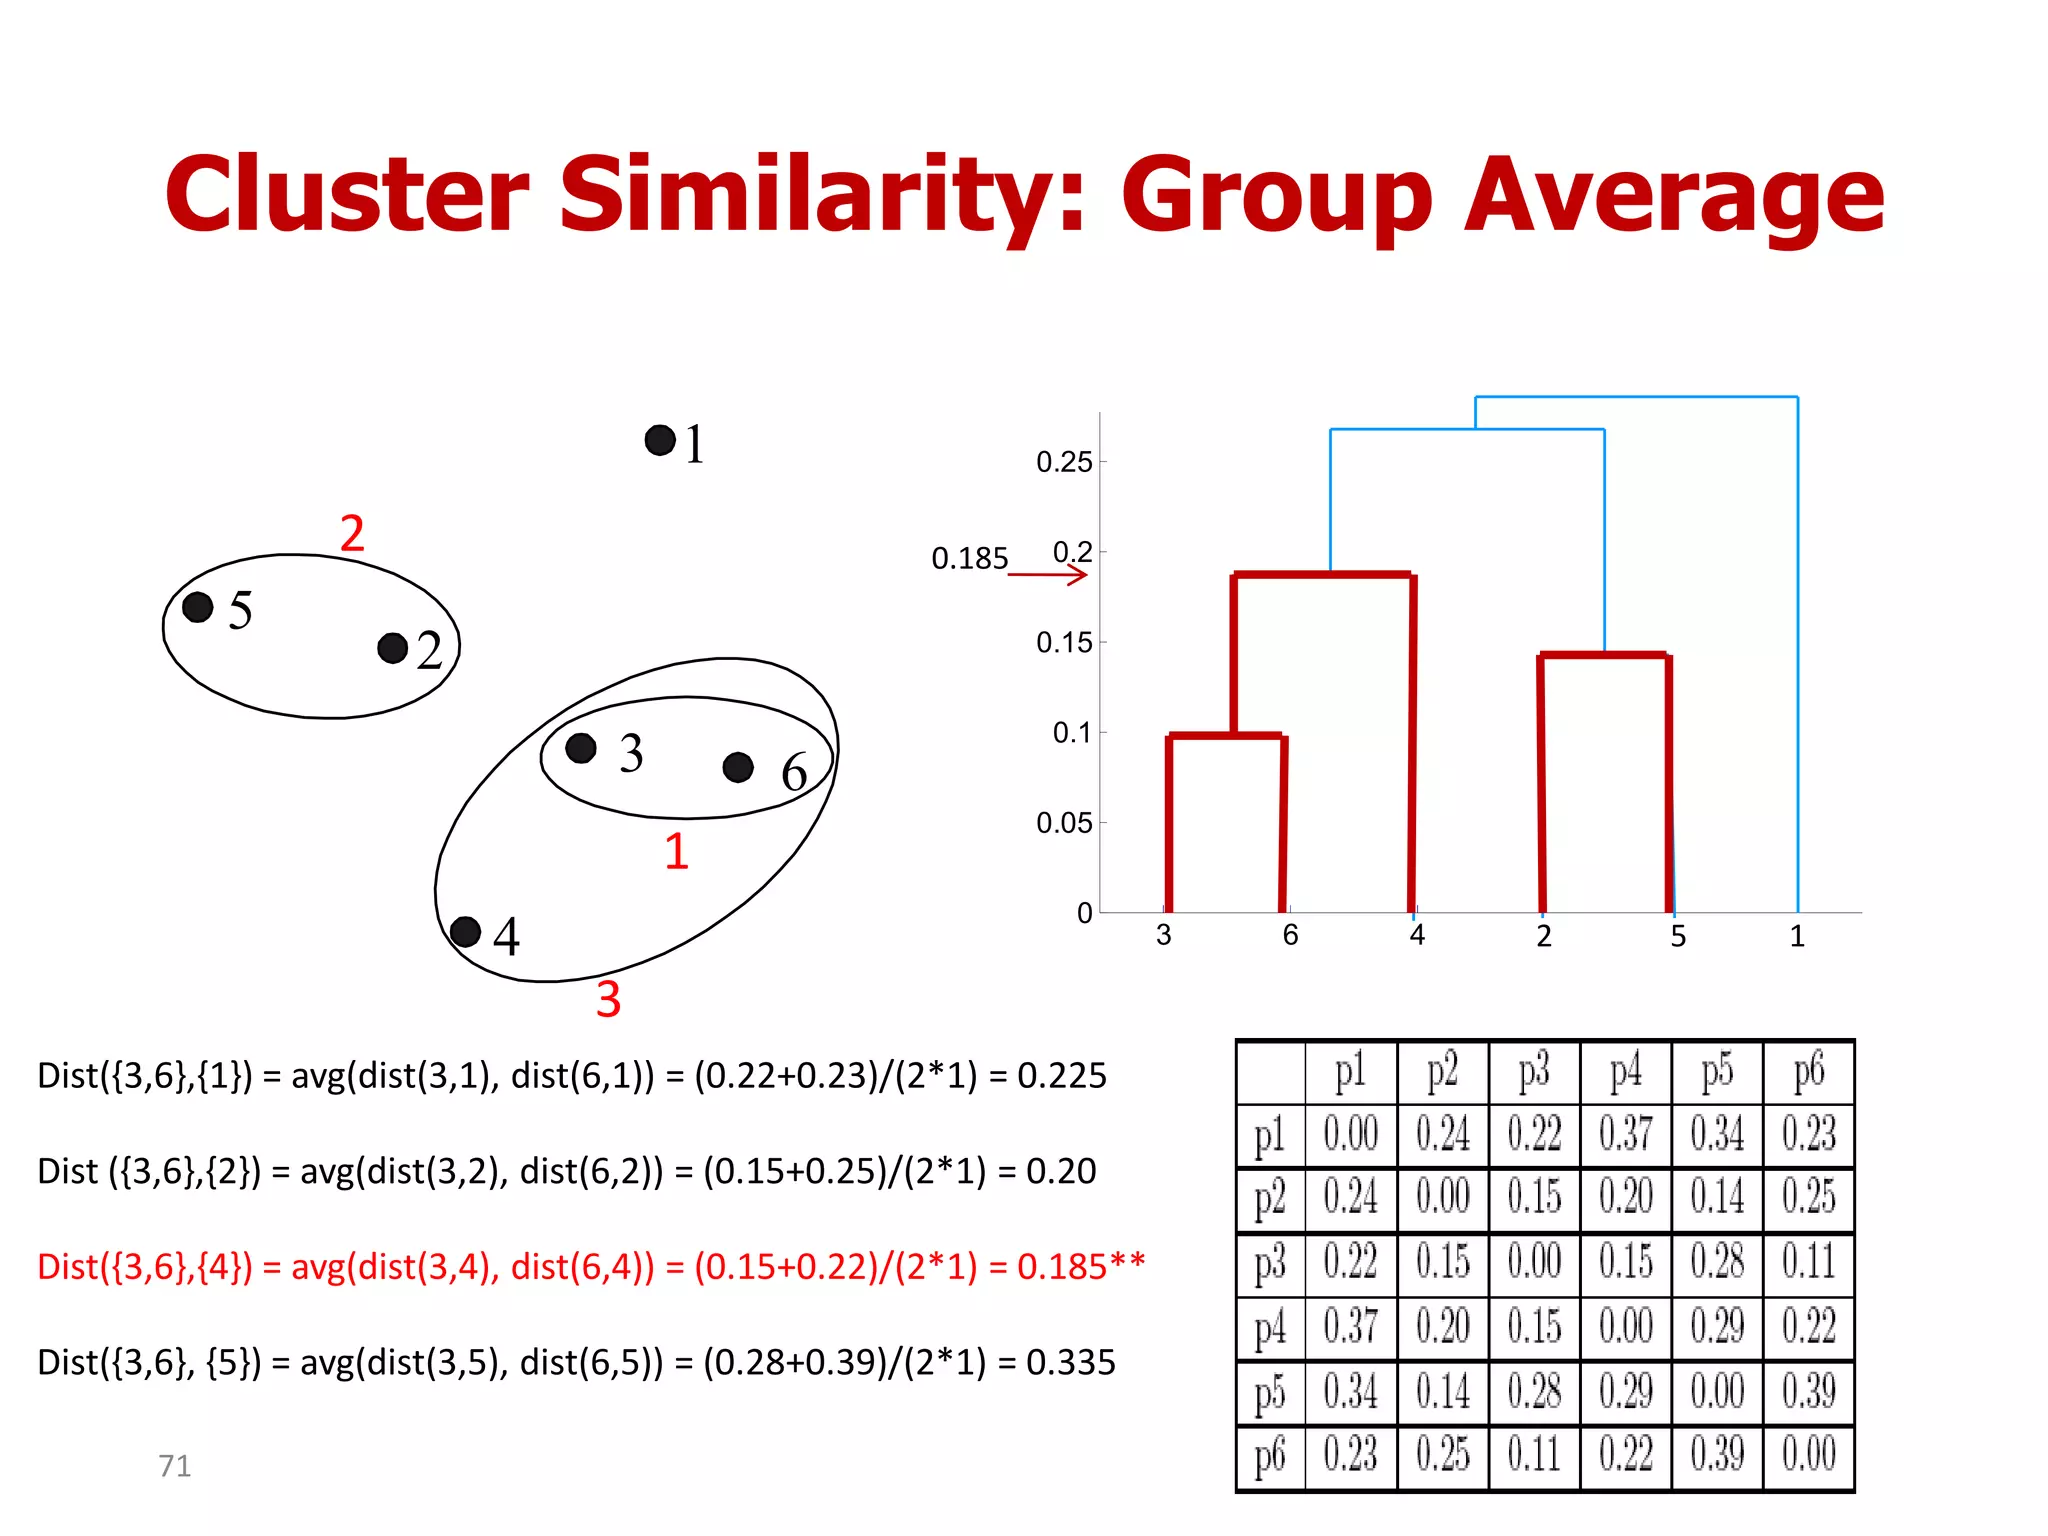
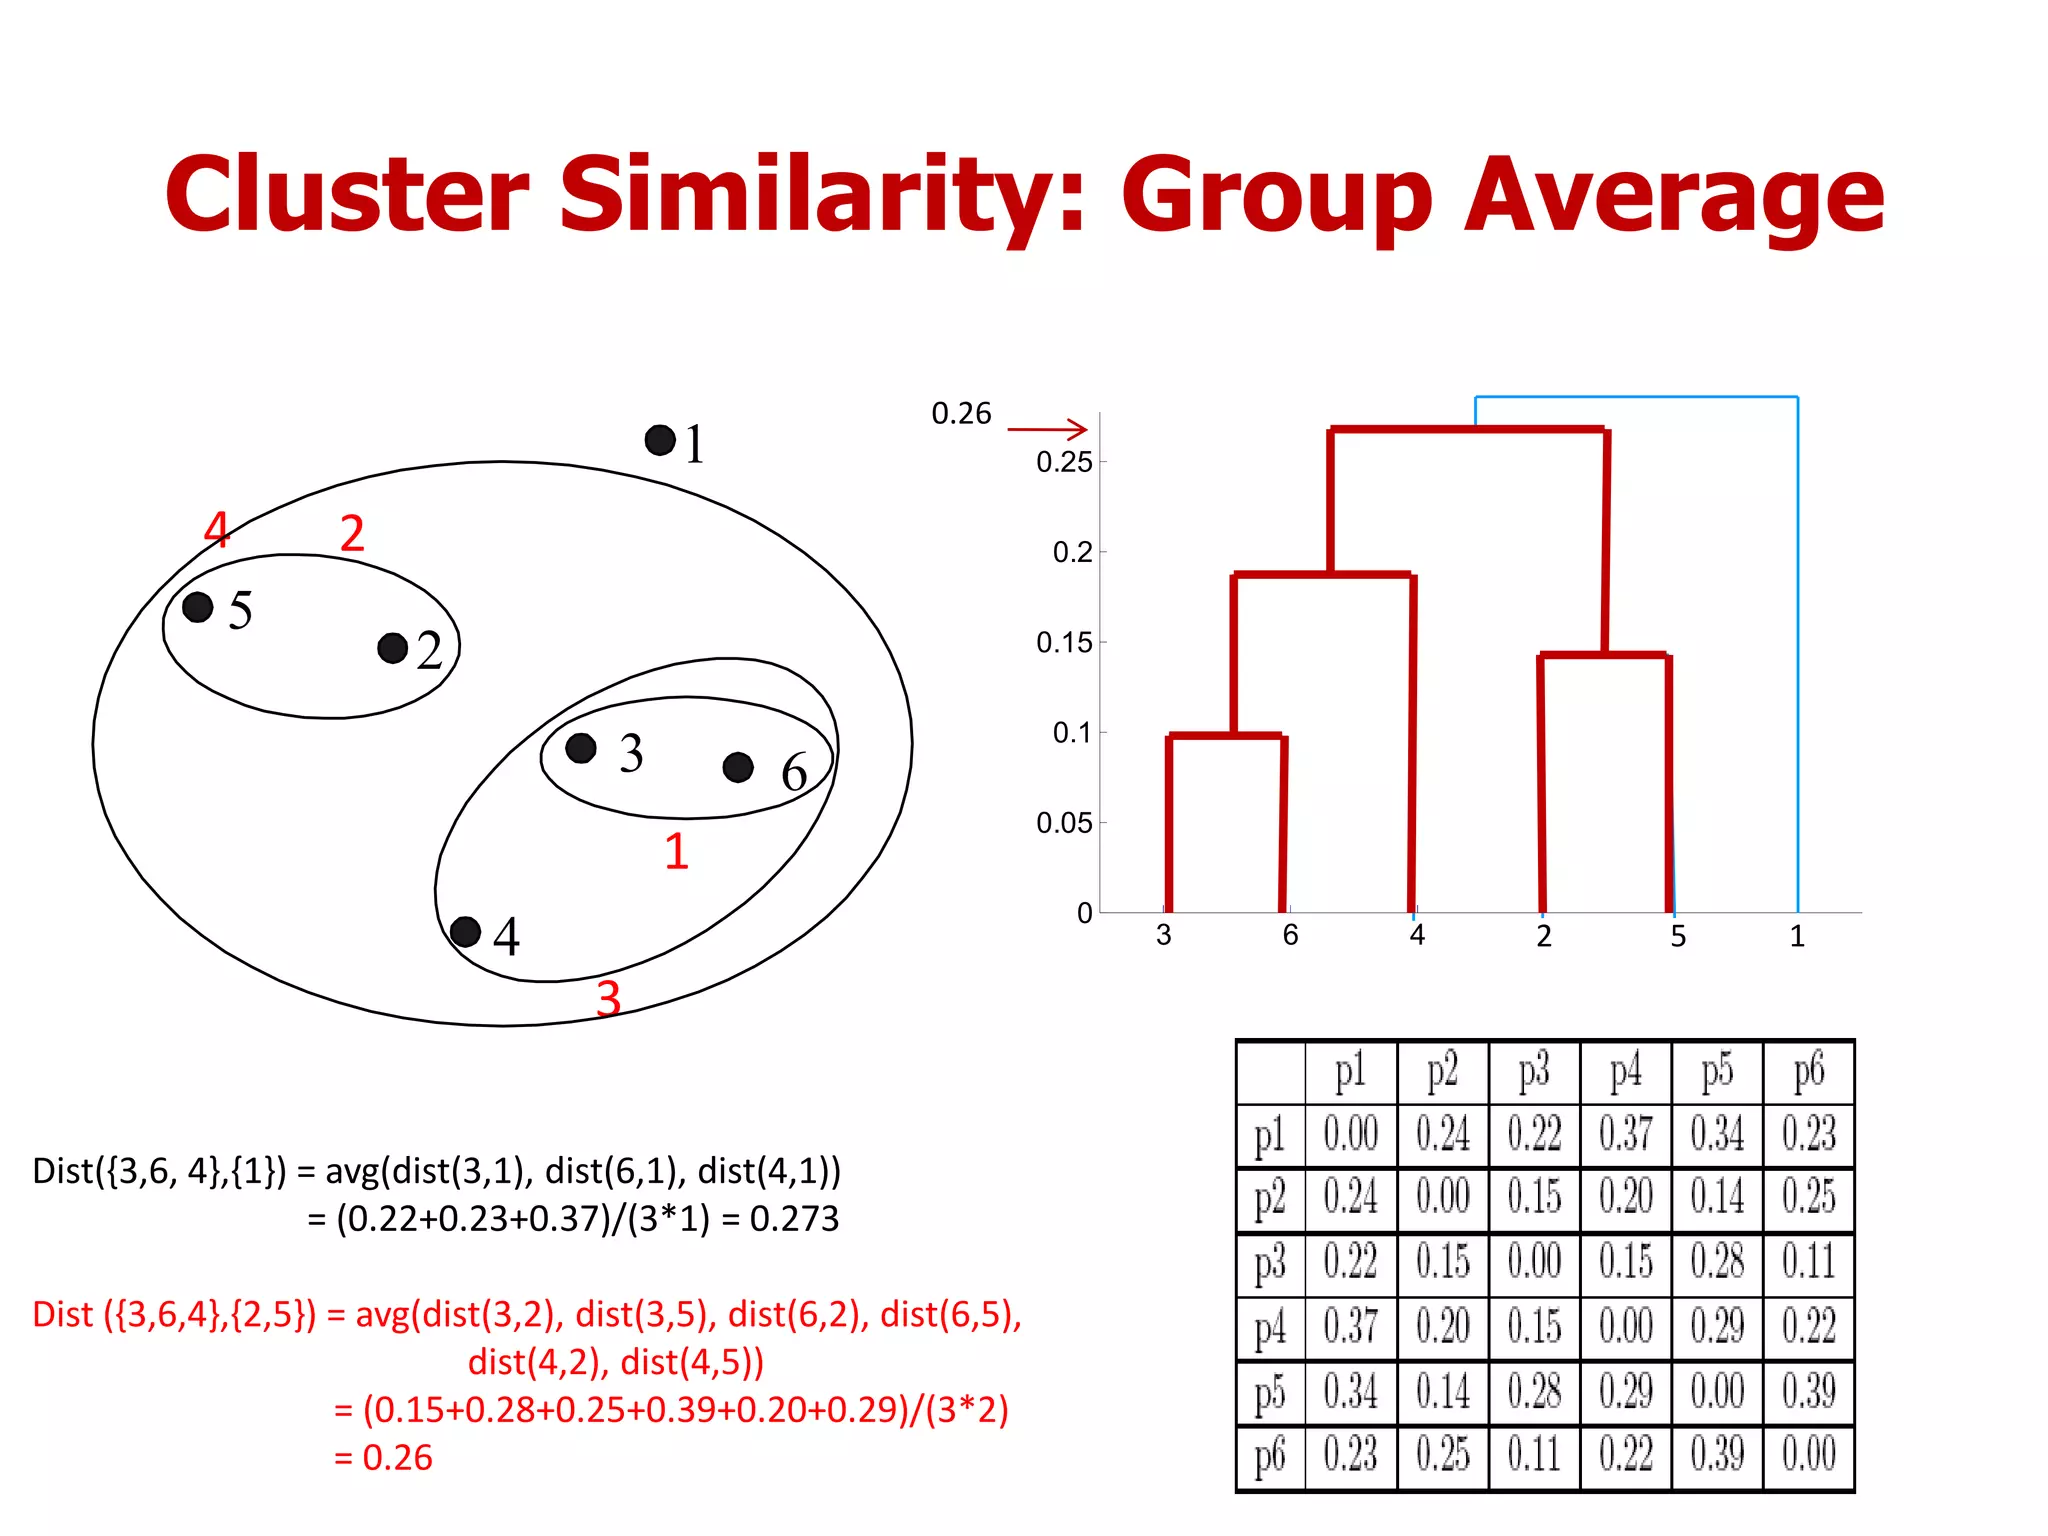
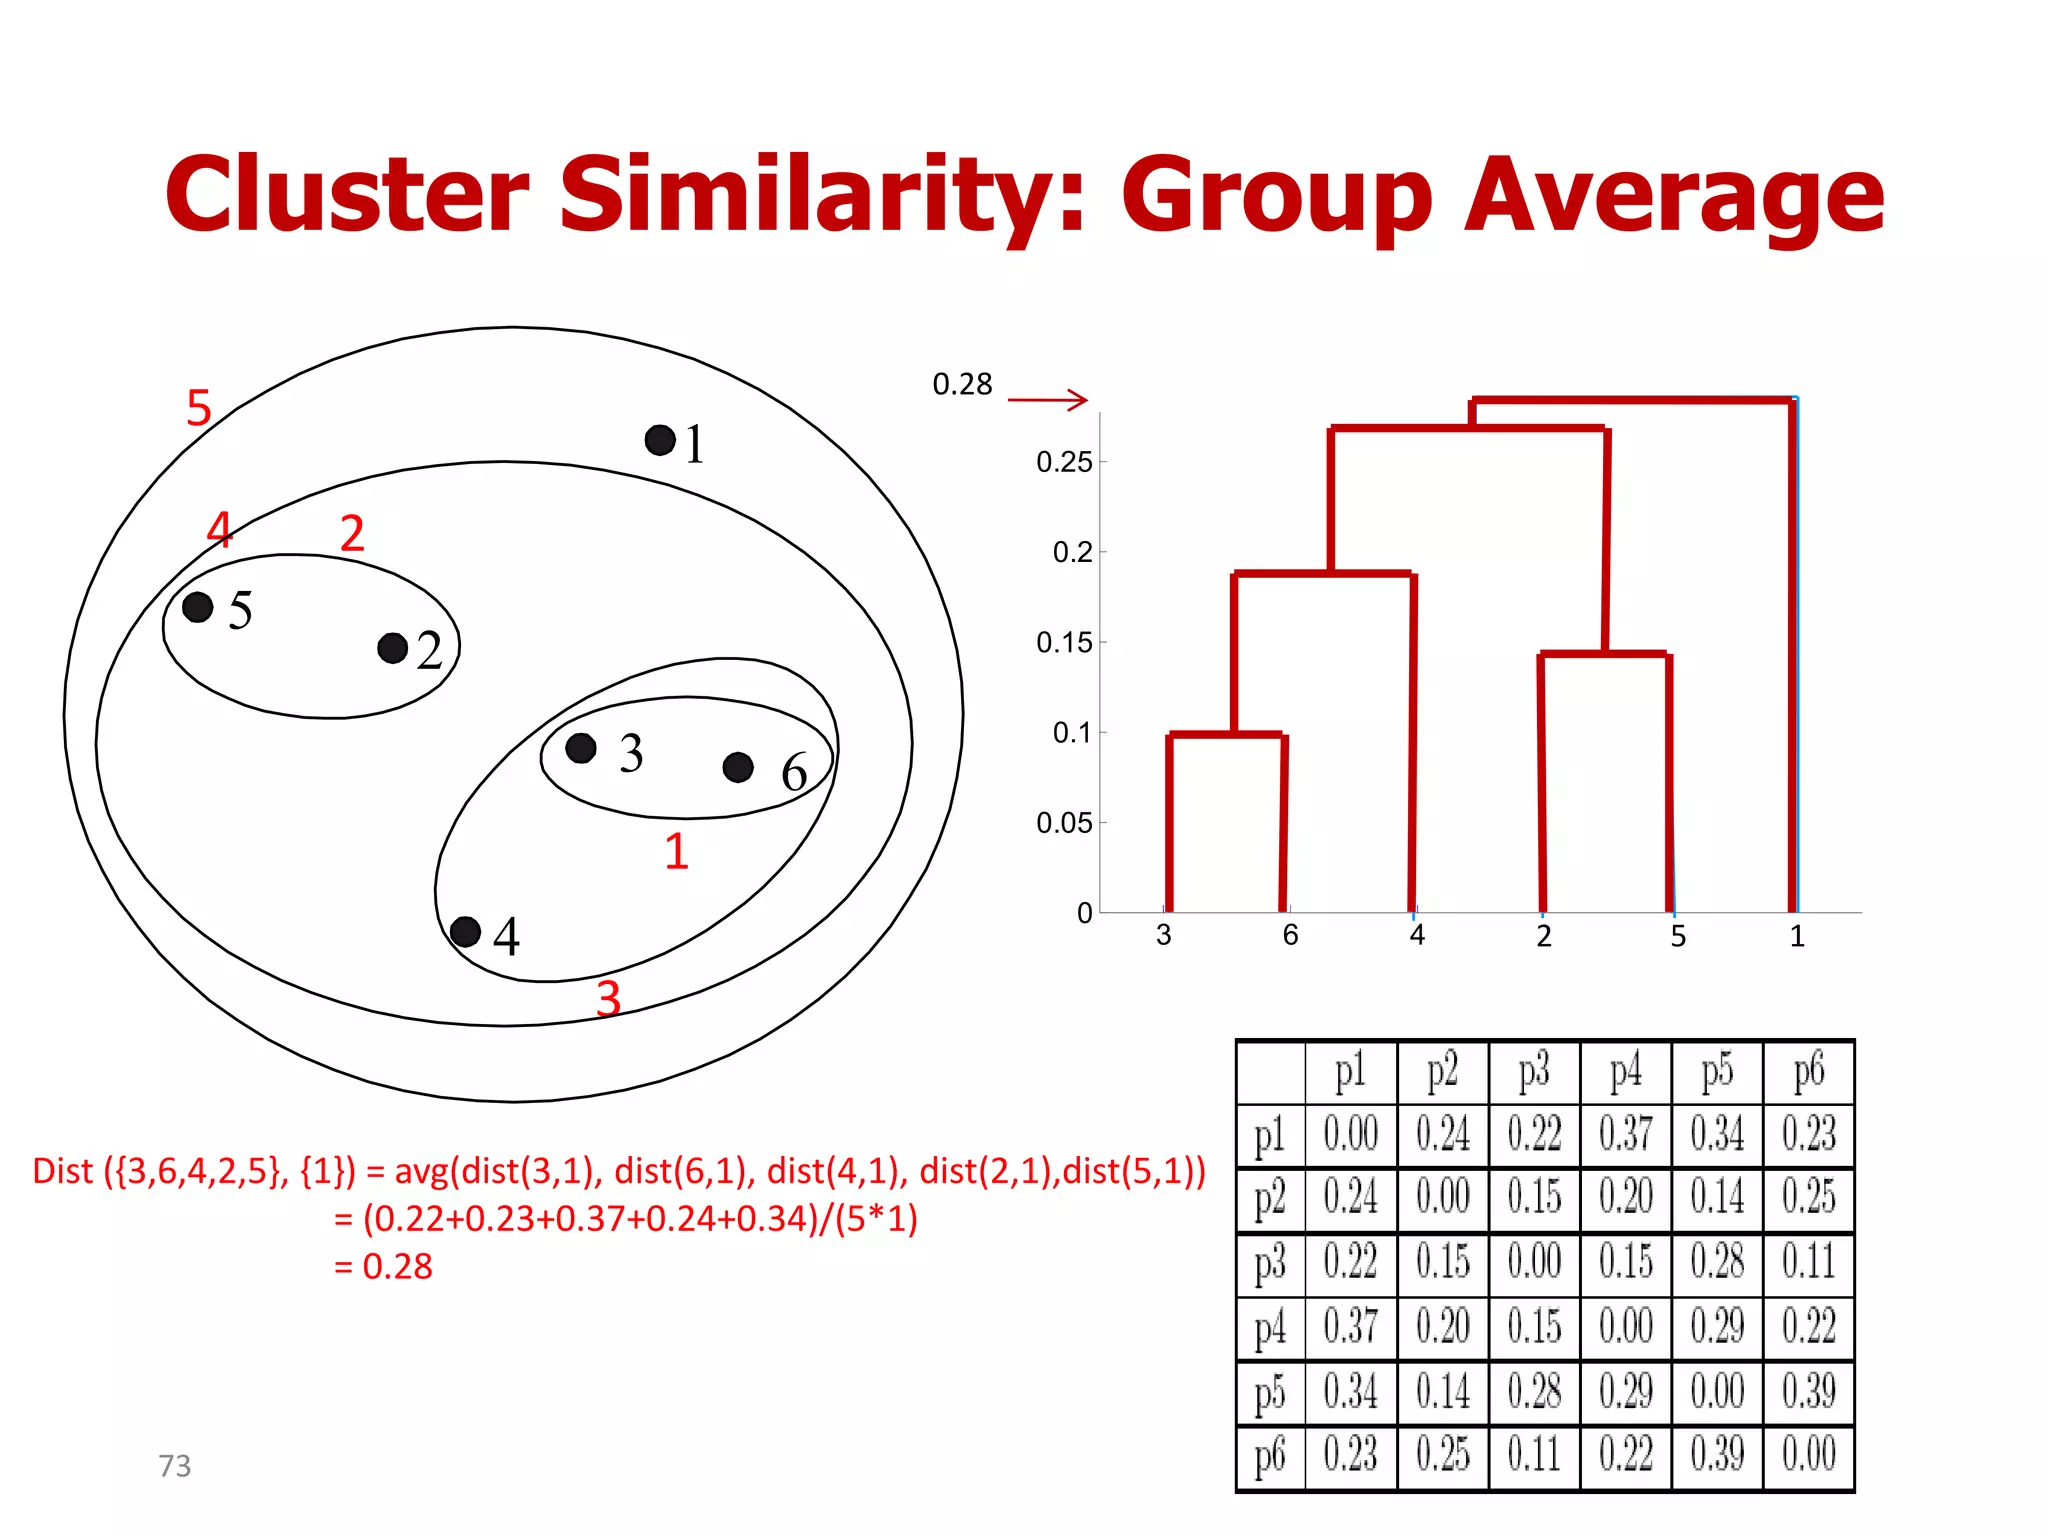
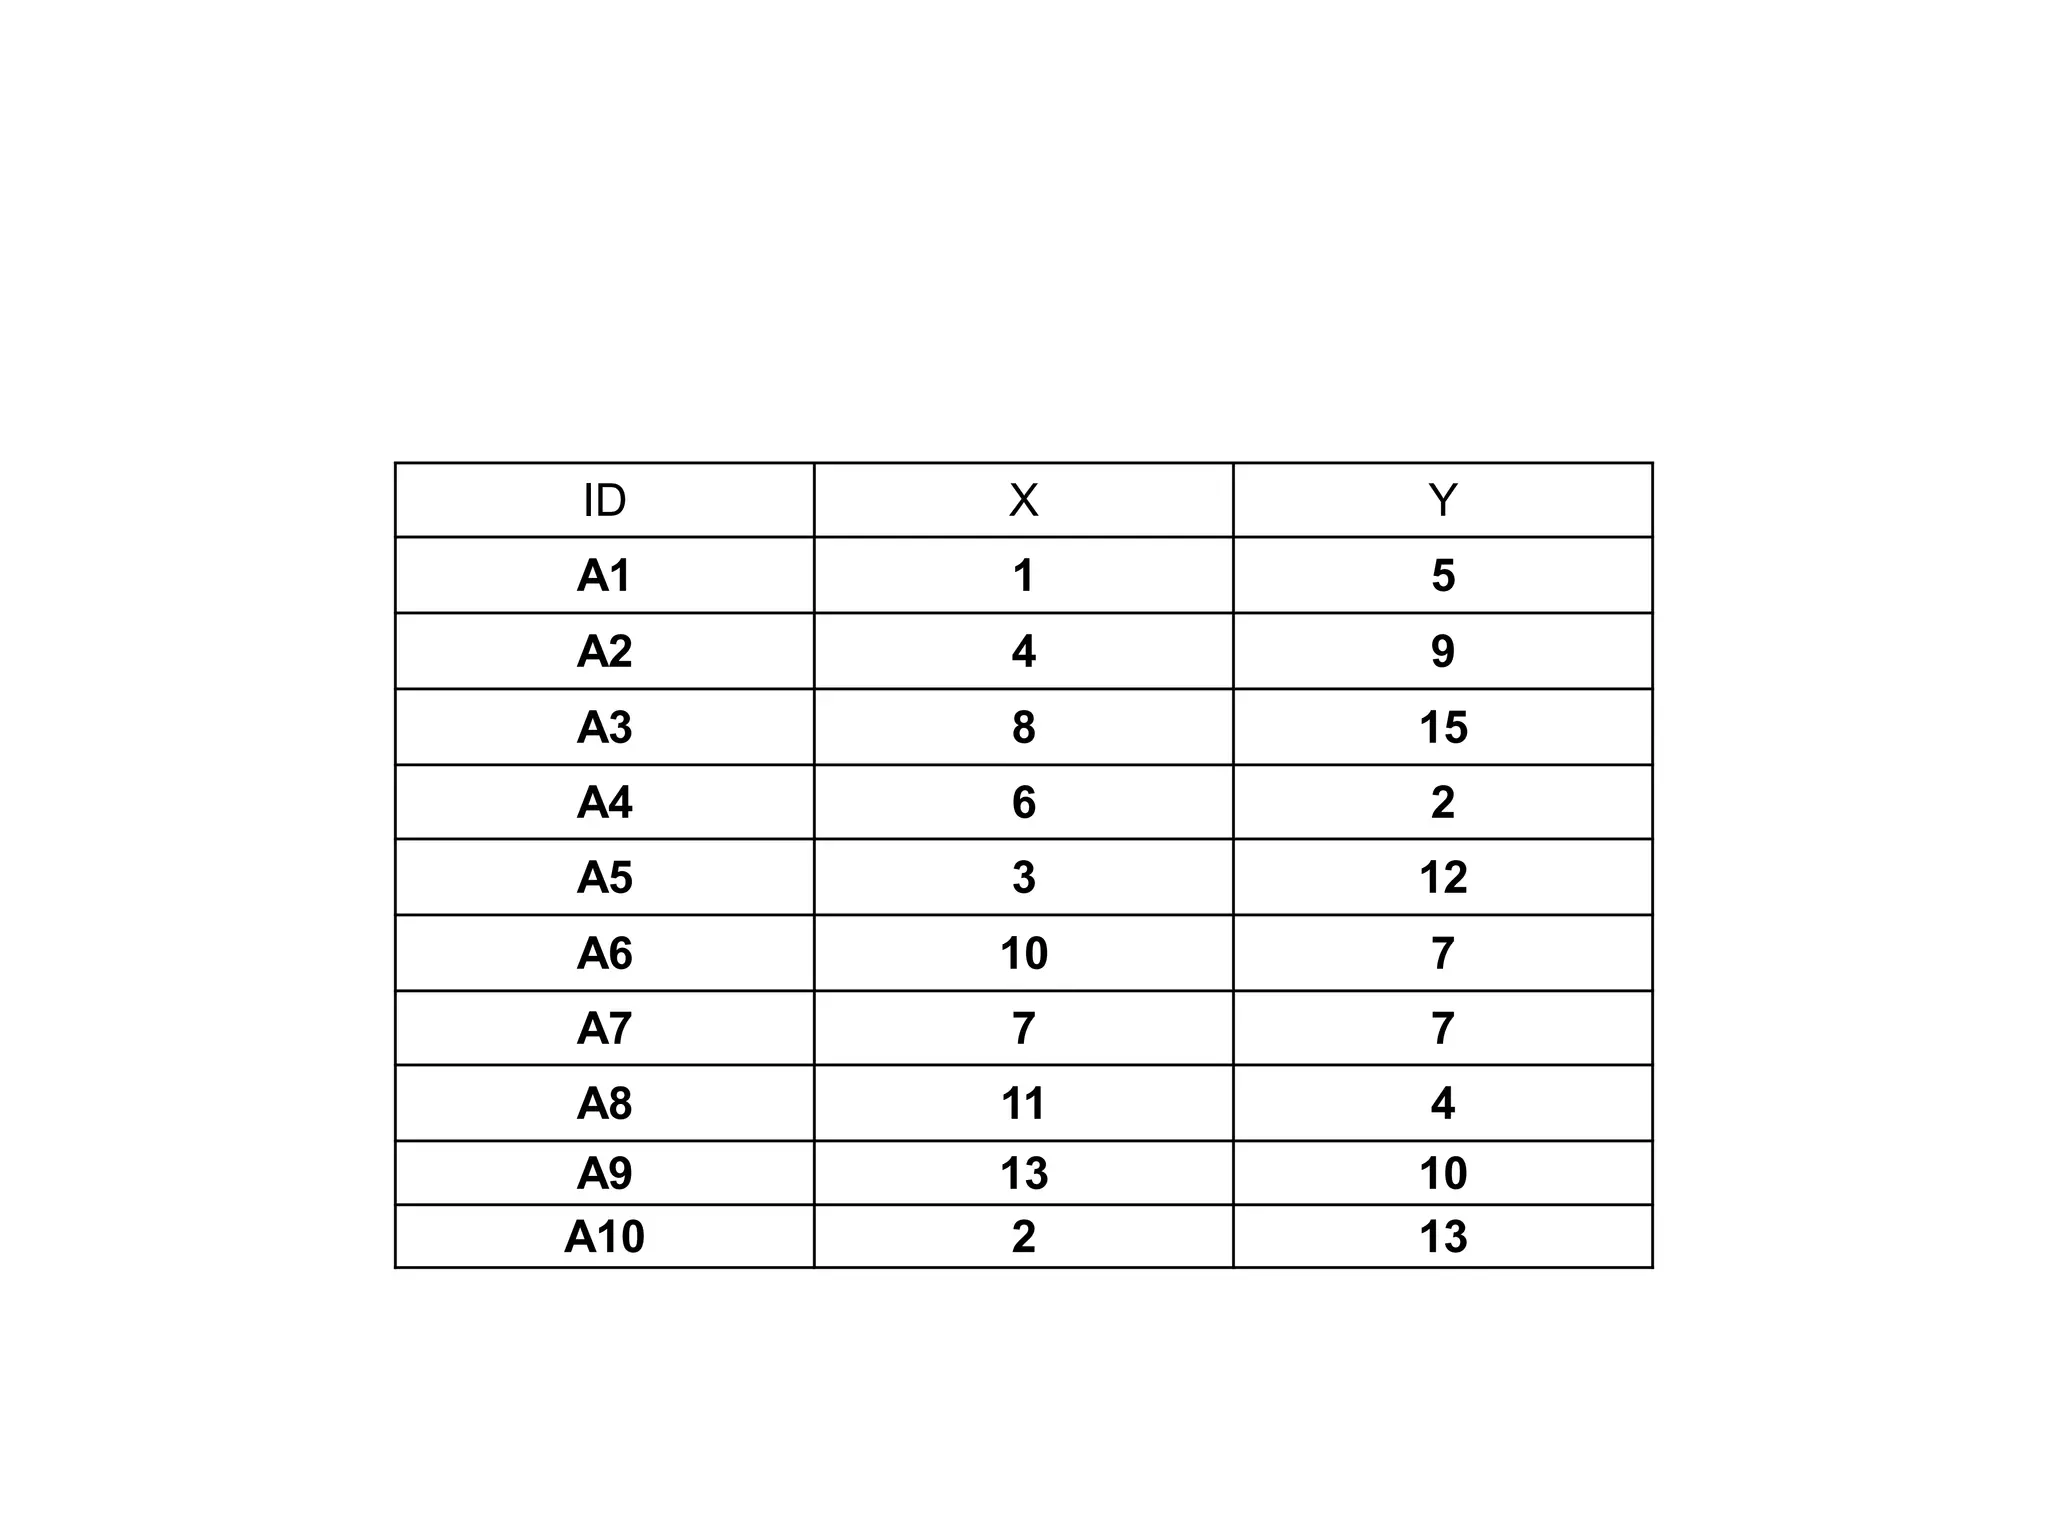

This document discusses different types of clustering analysis techniques in data mining. It describes clustering as the task of grouping similar objects together. The document outlines several key clustering algorithms including k-means clustering and hierarchical clustering. It provides an example to illustrate how k-means clustering works by randomly selecting initial cluster centers and iteratively assigning data points to clusters and recomputing cluster centers until convergence. The document also discusses limitations of k-means and how hierarchical clustering builds nested clusters through sequential merging of clusters based on a similarity measure.


![Chapter#04[Part#01]K-Means Clusterig.pdf](https://cdn.slidesharecdn.com/ss_thumbnails/chapter04part01k-meansclusterig-250525201708-2d369307-thumbnail.jpg?width=640&height=640&fit=bounds)


