Download to read offline
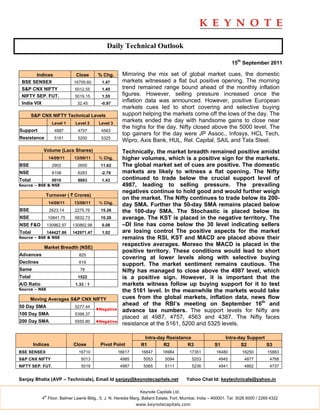


The domestic stock markets opened flat but turned positive due to short covering and selective buying after monthly inflation figures were announced. The markets ended the day with gains and closed near the highs, with the Nifty closing above 5000. Technically, market breadth was positive with higher volumes. The global cues are positive but domestic markets are likely to have a flat opening. Support levels are at 4987, 4757, and 4563 while resistance is at 5161, 5200, and 5325.


