Downloaded 127 times

![How to open a kernel crash dump (vmcore) for analysis ?
a) Typical postmortem debugging: [ Offline mode ]
Syntax:
# crash /path/to/vmlinux /path/to/vmcore
Kernel object file and memory image are supplied, respectively.
# crash osrelease vmcore
2.6.32431.el6.x86_64
# crash d 1 vmcore| grep RELEASE
OSRELEASE=2.6.32431.el6.x86_64
# crash /var/crash/vmcore
/usr/lib/debug/lib/modules/2.6.32431.el6.x86_64/vmlinux
b) Live memory debugging: [ Online mode ]
Syntax:
# crash /path/to/vmlinux
/dev/crash used by default for live memory image.
# crash /usr/lib/debug/lib/modules/2.6.32431.el6.x86_64/vmlinux
c) Live memory debugging (with vmlinux search): [ Online mode ]
Syntax:
# crash
Predefined directories are searched for proper vmlinux
Version string matched to the running kernel (/proc/version)](https://image.slidesharecdn.com/a32c3dd7-4584-46e9-a1d2-28f0f7272794-160202112118/75/Kernel_Crash_Dump_Analysis-7-2048.jpg)
![What is crash extension module ?
The crash utility was designed with extensibility in mind.
You can create shared object library files consisting of crash command
extensions, that can be dynamically linked into the crash executable during
runtime or during initialization.
How to build a crash extension (not supported by Red Hat Support) ?
# git clone https://github.com/crashutility/crash.git
# cd crash/
# make
# make install
# cd extensions/
# wget http://people.redhat.com/anderson/extensions/swap_usage.c
# cd ..
# make extensions
# ls l extensions/swap_usage.so
rwxrxrx. 1 root root 54101 Jan 22 21:11 extensions/swap_usage.so
How to load a crash extension ?
Syntax:
crash> extend /path/to/<name>.so
crash> extend /crash/extensions/swap_usage.so
./crash/extensions/swap_usage.so: shared object loaded
crash> pswap h
Usage:
pswap [k G] [pid | taskp]
Enter "help pswap" for details.](https://image.slidesharecdn.com/a32c3dd7-4584-46e9-a1d2-28f0f7272794-160202112118/75/Kernel_Crash_Dump_Analysis-9-2048.jpg)

![How to check kernel ring buffer (dmesg) ?
"log" or "dmesg" command dumps the kernel log_buf contents.
crash> log | tail n 38
SysRq : Trigger a crash
BUG: unable to handle kernel NULL pointer dereference at (null)
IP: [<ffffffff8134b6c6>] sysrq_handle_crash+0x16/0x20
PGD 140aff067 PUD 140a9f067 PMD 0
Oops: 0002 [#1] SMP
last sysfs file: /sys/devices/pci0000:00/0000:00:01.2/usb1/11/speed
CPU 2
Modules linked in: nfsd lockd nfs_acl auth_rpcgss exportfs autofs4 sunrpc bnx2fc
cnic uio fcoe 8021q libfcoe garp stp libfc llc scsi_transport_fc scsi_tgt
xt_NFQUEUE iptable_filter ip_tables ip6t_REJECT nf_conntrack_ipv6 nf_defrag_ipv6
xt_state nf_conntrack ip6table_filter ip6_tables ipv6 uinput microcode
virtio_balloon virtio_net snd_hda_intel snd_hda_codec snd_hwdep snd_seq
snd_seq_device snd_pcm snd_timer snd soundcore snd_page_alloc i2c_piix4 i2c_core
ext4 jbd2 mbcache virtio_blk pata_acpi ata_generic ata_piix virtio_pci virtio_ring
virtio dm_mirror dm_region_hash dm_log dm_mod [last unloaded: speedstep_lib]
Pid: 2187, comm: bash Not tainted 2.6.32431.el6.x86_64 #1 Red Hat KVM
RIP: 0010:[<ffffffff8134b6c6>] [<ffffffff8134b6c6>] sysrq_handle_crash+0x16/0x20
RSP: 0018:ffff8801422bde18 EFLAGS: 00010096
RAX: 0000000000000010 RBX: 0000000000000063 RCX: 0000000000000000
RDX: 0000000000000000 RSI: 0000000000000000 RDI: 0000000000000063
RBP: ffff8801422bde18 R08: 0000000000000000 R09: 203a207152737953
R10: 0000000000000000 R11: 0000000000000000 R12: 0000000000000000
R13: ffffffff81b01a40 R14: 0000000000000286 R15: 0000000000000007
FS: 00007ffdf778f700(0000) GS:ffff880028280000(0000) knlGS:0000000000000000
CS: 0010 DS: 0000 ES: 0000 CR0: 0000000080050033
CR2: 0000000000000000 CR3: 0000000140815000 CR4: 00000000000006e0
DR0: 0000000000000000 DR1: 0000000000000000 DR2: 0000000000000000
DR3: 0000000000000000 DR6: 00000000ffff0ff0 DR7: 0000000000000400
Process bash (pid: 2187, threadinfo ffff8801422bc000, task ffff88018d4e8ae0)
Stack:
ffff8801422bde68 ffffffff8134b982 ffff88018d4e8ae0 ffff880100000000
<d> 0000000000000300 0000000000000002 ffff880140ace3c0 00007ffdf7799000
<d> 0000000000000002 fffffffffffffffb ffff8801422bde98 ffffffff8134ba3e
Call Trace:
[<ffffffff8134b982>] __handle_sysrq+0x132/0x1a0
[<ffffffff8134ba3e>] write_sysrq_trigger+0x4e/0x50
[<ffffffff811f328e>] proc_reg_write+0x7e/0xc0
[<ffffffff81188f78>] vfs_write+0xb8/0x1a0
[<ffffffff81189871>] sys_write+0x51/0x90
[<ffffffff8100b072>] system_call_fastpath+0x16/0x1b
Code: d0 88 81 a3 1c fe 81 c9 c3 66 66 66 2e 0f 1f 84 00 00 00 00 00 55 48 89 e5 0f
1f 44 00 00 c7 05 0d 07 75 00 01 00 00 00 0f ae f8 <c6> 04 25 00 00 00 00 01 c9 c3
55 48 89 e5 0f 1f 44 00 00 8d 47
RIP [<ffffffff8134b6c6>] sysrq_handle_crash+0x16/0x20
RSP <ffff8801422bde18>
CR2: 0000000000000000](https://image.slidesharecdn.com/a32c3dd7-4584-46e9-a1d2-28f0f7272794-160202112118/75/Kernel_Crash_Dump_Analysis-12-2048.jpg)
![How to determine the panic task ?
The option (p) of "set" command sets the context to the panic task, or back
to the crash task on a live system.
crash> set p
PID: 2187
COMMAND: "bash"
TASK: ffff88018d4e8ae0 [THREAD_INFO: ffff8801422bc000]
CPU: 2
STATE: TASK_RUNNING (SYSRQ)
How to check the backtrace of panic task ?
"bt" command displays a kernel stack backtrace. If no arguments are given,
the stack trace of the current context will be displayed.
crash> bt
PID: 2187 TASK: ffff88018d4e8ae0 CPU: 2 COMMAND: "bash"
#0 [ffff8801422bd9e0] machine_kexec at ffffffff81038f3b
#1 [ffff8801422bda40] crash_kexec at ffffffff810c5d92
#2 [ffff8801422bdb10] oops_end at ffffffff8152b510
#3 [ffff8801422bdb40] no_context at ffffffff8104a00b
#4 [ffff8801422bdb90] __bad_area_nosemaphore at ffffffff8104a295
#5 [ffff8801422bdbe0] bad_area at ffffffff8104a3be
#6 [ffff8801422bdc10] __do_page_fault at ffffffff8104ab6f
#7 [ffff8801422bdd30] do_page_fault at ffffffff8152d45e
#8 [ffff8801422bdd60] page_fault at ffffffff8152a815
[exception RIP: sysrq_handle_crash+22]
RIP: ffffffff8134b6c6 RSP: ffff8801422bde18 RFLAGS: 00010096
RAX: 0000000000000010 RBX: 0000000000000063 RCX: 0000000000000000
RDX: 0000000000000000 RSI: 0000000000000000 RDI: 0000000000000063
RBP: ffff8801422bde18 R8: 0000000000000000 R9: 203a207152737953
R10: 0000000000000000 R11: 0000000000000000 R12: 0000000000000000
R13: ffffffff81b01a40 R14: 0000000000000286 R15: 0000000000000007
ORIG_RAX: ffffffffffffffff CS: 0010 SS: 0018
#9 [ffff8801422bde20] __handle_sysrq at ffffffff8134b982
#10 [ffff8801422bde70] write_sysrq_trigger at ffffffff8134ba3e
#11 [ffff8801422bdea0] proc_reg_write at ffffffff811f328e
#12 [ffff8801422bdef0] vfs_write at ffffffff81188f78
#13 [ffff8801422bdf30] sys_write at ffffffff81189871
#14 [ffff8801422bdf80] system_call_fastpath at ffffffff8100b072
RIP: 0000003e2c2db560 RSP: 00007fff425f6548 RFLAGS: 00010202
RAX: 0000000000000001 RBX: ffffffff8100b072 RCX: 00000000004b5e34
RDX: 0000000000000002 RSI: 00007ffdf7799000 RDI: 0000000000000001
RBP: 00007ffdf7799000 R8: 000000000000000a R9: 00007ffdf778f700
R10: 0000000000000000 R11: 0000000000000246 R12: 0000000000000002
R13: 0000003e2c58e7a0 R14: 0000000000000002 R15: 0000003e2c58e7a0
ORIG_RAX: 0000000000000001 CS: 0033 SS: 002b](https://image.slidesharecdn.com/a32c3dd7-4584-46e9-a1d2-28f0f7272794-160202112118/75/Kernel_Crash_Dump_Analysis-13-2048.jpg)
![How to determine the UID and GID of a process ?
RHEL6:
struct task_struct contains the PID of a process.
crash> struct task_struct.pid ox
struct task_struct {
[0x4a8] pid_t pid;
}
struct cred contains the UID and GID of a process.
crash> struct cred.uid ox
struct cred {
[0x4] uid_t uid;
}
crash> struct cred.gid ox
struct cred {
[0x8] gid_t gid;
}
struct cred * can be determined from struct task_struct
crash> struct task_struct.cred ox
struct task_struct {
[0x648] const struct cred *cred;
}
crash> set 2187
PID: 2187
COMMAND: "bash"
TASK: ffff88018d4e8ae0 [THREAD_INFO: ffff8801422bc000]
CPU: 2
STATE: TASK_RUNNING (SYSRQ)
crash> struct task_struct.pid ffff88018d4e8ae0
pid = 2187
crash> struct task_struct.cred ffff88018d4e8ae0
cred = 0xffff88014c2a8200
crash> struct cred.uid 0xffff88014c2a8200
uid = 0
crash> struct cred.gid 0xffff88014c2a8200
gid = 0](https://image.slidesharecdn.com/a32c3dd7-4584-46e9-a1d2-28f0f7272794-160202112118/75/Kernel_Crash_Dump_Analysis-14-2048.jpg)
![How to check task priority and policy ?
"task" command can used to determine the task priority and policy.
"task" command displays the contents of a task's task_struct and
thread_info structures.
crash> set p
PID: 2187
COMMAND: "bash"
TASK: ffff88018d4e8ae0 [THREAD_INFO: ffff8801422bc000]
CPU: 2
STATE: TASK_RUNNING (SYSRQ)
crash> task 2187 R policy, prio, rt_priority
PID: 2187 TASK: ffff88018d4e8ae0 CPU: 2 COMMAND: "bash"
policy = 0,
prio = 120,
rt_priority = 0,
Scheduling policies:
#define SCHED_NORMAL 0
#define SCHED_FIFO 1
#define SCHED_RR 2
#define SCHED_BATCH 3
#define SCHED_IDLE 5
OR
crash> set p
PID: 2187
COMMAND: "bash"
TASK: ffff88018d4e8ae0 [THREAD_INFO: ffff8801422bc000]
CPU: 2
STATE: TASK_RUNNING (SYSRQ)
crash> task_struct.policy,prio,rt_priority 0xffff88018d4e8ae0
policy = 0
prio = 120
rt_priority = 0](https://image.slidesharecdn.com/a32c3dd7-4584-46e9-a1d2-28f0f7272794-160202112118/75/Kernel_Crash_Dump_Analysis-18-2048.jpg)
![How to determine resource limits (rlimits) of a process ?
The option (r) of "ps" command displays resource limits (rlimits) of selected,
or all, tasks.
crash> set 1
PID: 1
COMMAND: "init"
TASK: ffff880192d39500 [THREAD_INFO: ffff880192d3a000]
CPU: 2
STATE: TASK_INTERRUPTIBLE
crash> ps r 1
PID: 1 TASK: ffff880192d39500 CPU: 2 COMMAND: "init"
RLIMIT CURRENT MAXIMUM
CPU (unlimited) (unlimited)
FSIZE (unlimited) (unlimited)
DATA (unlimited) (unlimited)
STACK 10485760 (unlimited)
CORE 0 (unlimited)
RSS (unlimited) (unlimited)
NPROC 45331 45331
NOFILE 1024 4096
MEMLOCK 65536 65536
AS (unlimited) (unlimited)
LOCKS (unlimited) (unlimited)
SIGPENDING 45331 45331
MSGQUEUE 819200 819200
NICE 0 0
RTPRIO 0 0
RTTIME (unlimited) (unlimited)](https://image.slidesharecdn.com/a32c3dd7-4584-46e9-a1d2-28f0f7272794-160202112118/75/Kernel_Crash_Dump_Analysis-20-2048.jpg)
![How to determine total number of tasks in different state ?
The option (S) of "ps" command displays a summary consisting of the
number of tasks in a task state.
crash> ps S
RU: 5
IN: 259
How to display only user space process ?
The option (u) of "ps" command displays only user tasks.
crash> ps u | head
PID PPID CPU TASK ST %MEM VSZ RSS COMM
1 0 2 ffff880192d39500 IN 0.0 19364 1500 init
483 1 1 ffff88018d76a040 IN 0.0 11240 1320 udevd
1336 1 3 ffff88014cf00aa0 IN 0.0 27640 864 auditd
1337 1 0 ffff88018e46f540 IN 0.0 27640 864 auditd
1361 1 0 ffff88018cde6080 IN 0.0 249092 1628 rsyslogd
1362 1 3 ffff880191be5540 IN 0.0 249092 1628 rs:main Q:Reg
1363 1 2 ffff88018d49c080 IN 0.0 249092 1628 rsyslogd
1364 1 3 ffff88018e796aa0 IN 0.0 249092 1628 rsyslogd
1396 1 2 ffff88018d4d4080 IN 0.0 18976 924 rpcbind
How to display only kernel threads ?
The option (k) of "ps" command displays only kernel threads.
crash> ps k | head
PID PPID CPU TASK ST %MEM VSZ RSS COMM
> 0 0 0 ffffffff81a8d020 RU 0.0 0 0 [swapper]
> 0 0 1 ffff880192d81540 RU 0.0 0 0 [swapper]
0 0 2 ffff880192d8a040 RU 0.0 0 0 [swapper]
> 0 0 3 ffff880192dc2aa0 RU 0.0 0 0 [swapper]
2 0 1 ffff880192d38aa0 IN 0.0 0 0 [kthreadd]
3 2 0 ffff880192d38040 IN 0.0 0 0 [migration/0]
4 2 0 ffff880192d67540 IN 0.0 0 0 [ksoftirqd/0]
5 2 0 ffff880192d66ae0 IN 0.0 0 0 [migration/0]
6 2 0 ffff880192d66080 IN 0.0 0 0 [watchdog/0]](https://image.slidesharecdn.com/a32c3dd7-4584-46e9-a1d2-28f0f7272794-160202112118/75/Kernel_Crash_Dump_Analysis-21-2048.jpg)
![How to check the total time of a process in a specific state ?
The option (m) of "ps" command displays the timestamp into days, hours,
minutes, seconds, and milliseconds since the task was last run on a cpu.
crash> ps m | grep RU
[0 00:00:00.000] [RU] PID: 2187 TASK: ffff88018d4e8ae0 CPU: 2 COMMAND: "bash"
[0 00:02:01.177] [RU] PID: 0 TASK: ffffffff81a8d020 CPU: 0 COMMAND: "swapper"
[0 00:02:01.409] [RU] PID: 0 TASK: ffff880192d81540 CPU: 1 COMMAND: "swapper"
[0 00:02:01.408] [RU] PID: 0 TASK: ffff880192d8a040 CPU: 2 COMMAND: "swapper"
[0 00:02:01.408] [RU] PID: 0 TASK: ffff880192dc2aa0 CPU: 3 COMMAND: "swapper"
How to check run queue of each CPU ?
"runq" command displays the tasks on a CFS run queue:
crash> runq
CPU 0 RUNQUEUE: ffff880028216840
CURRENT: PID: 0 TASK: ffffffff81a8d020 COMMAND: "swapper"
RT PRIO_ARRAY: ffff8800282169c8
[no tasks queued]
CFS RB_ROOT: ffff8800282168d8
[no tasks queued]
CPU 1 RUNQUEUE: ffff880028256840
CURRENT: PID: 0 TASK: ffff880192d81540 COMMAND: "swapper"
RT PRIO_ARRAY: ffff8800282569c8
[no tasks queued]
CFS RB_ROOT: ffff8800282568d8
[no tasks queued]
CPU 2 RUNQUEUE: ffff880028296840
CURRENT: PID: 2187 TASK: ffff88018d4e8ae0 COMMAND: "bash"
RT PRIO_ARRAY: ffff8800282969c8
[no tasks queued]
CFS RB_ROOT: ffff8800282968d8
[no tasks queued]
CPU 3 RUNQUEUE: ffff8800282d6840
CURRENT: PID: 0 TASK: ffff880192dc2aa0 COMMAND: "swapper"
RT PRIO_ARRAY: ffff8800282d69c8
[no tasks queued]
CFS RB_ROOT: ffff8800282d68d8
[no tasks queued]](https://image.slidesharecdn.com/a32c3dd7-4584-46e9-a1d2-28f0f7272794-160202112118/75/Kernel_Crash_Dump_Analysis-22-2048.jpg)

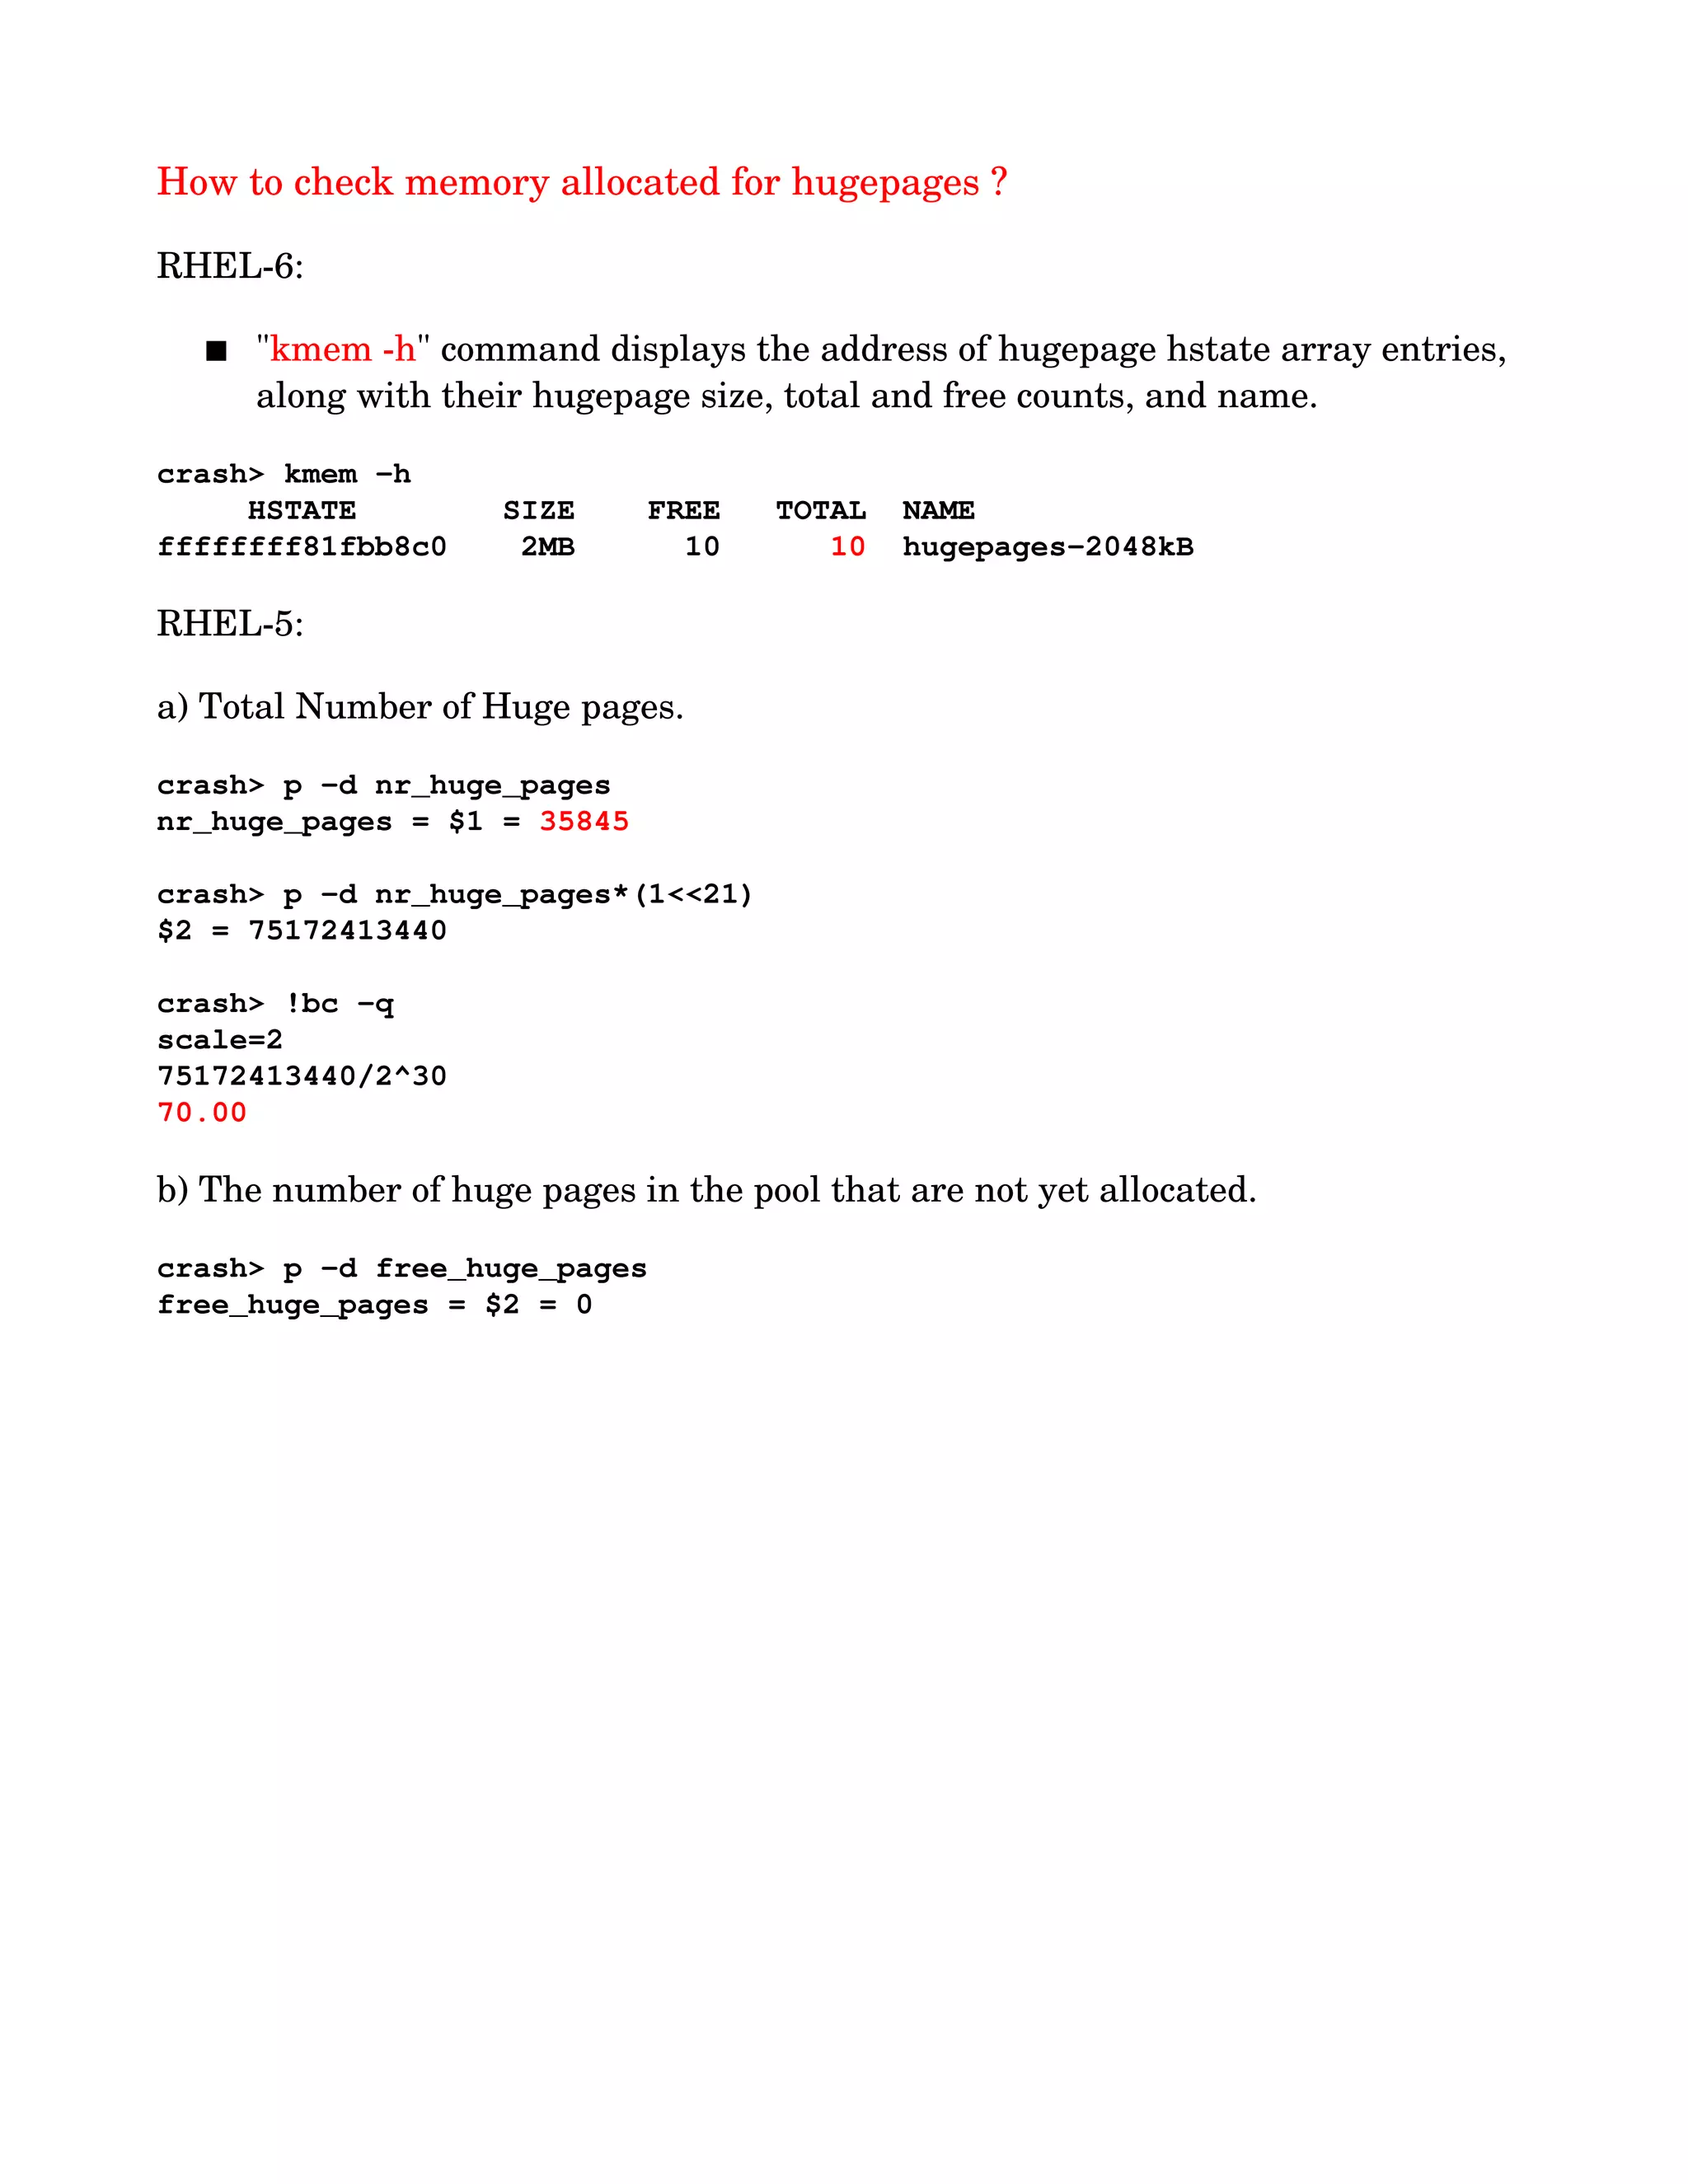
![How to check memory allocated to VMware ballooning driver (RHEL 6+) ?
Determine the address of symbol balloon.
crash> sym balloon
ffffffffa002b600 (b) balloon [vmware_balloon]
Determine the value of "size" variable using the address of symbol balloon.
crash> struct vmballoon.size 0xffffffffa002b600
$4 = 2721049
crash> !bc q
scale=2
2721049*4/2^20
10.37
2721049 pages = 2721049 x 4 = 10884196 KiB = 10.37 GiB
Note: The value of size variable is the amount of memory allocated by VMware
Ballooning driver in pages.
Determine the value of "target" variable using the address of symbol balloon.
crash> vmballoon.target 0xffffffffa002b600
$5 = 3177311
crash> !bc q
scale=2
3177311*4/2^20
12.12
3177311 pages = 3177311 x 4 = 12709244 KiB = 12.12 GiB
Note: The value of target variable is the amount of memory needed by VMware
Ballooning driver in pages.](https://image.slidesharecdn.com/a32c3dd7-4584-46e9-a1d2-28f0f7272794-160202112118/75/Kernel_Crash_Dump_Analysis-30-2048.jpg)

![How to check the status of disks ( online/offline ) ?
Method: 1
Determine struct gendisk * using "dev d" command.
crash> dev d
MAJOR GENDISK NAME REQUEST_QUEUE TOTAL ASYNC SYNC DRV
8 ffff88404ee6b400 sda ffff88204c212338 0 0 0 0
struct gendisk * for /dev/sda is 0xffff88404ee6b400
Determine "private_data" from struct gendisk *
crash> gendisk.private_data ox
struct gendisk {
[0x2c8] void *private_data;
}
crash> gendisk.private_data ffff88404ee6b400
private_data = 0xffff88404ee6b000
Determine struct scsi_device * from struct scsi_disk *
crash> scsi_disk.device ox
struct scsi_disk {
[0x8] struct scsi_device *device;
}
crash> scsi_disk.device 0xffff88404ee6b000
device = 0xffff88204c090800
Determine sdev_state from struct scsi_device *
crash> scsi_device.sdev_state ox
struct scsi_device {
[0x5a0] enum scsi_device_state sdev_state;
}
crash> scsi_device.sdev_state 0xffff88204c090800
sdev_state = SDEV_RUNNING
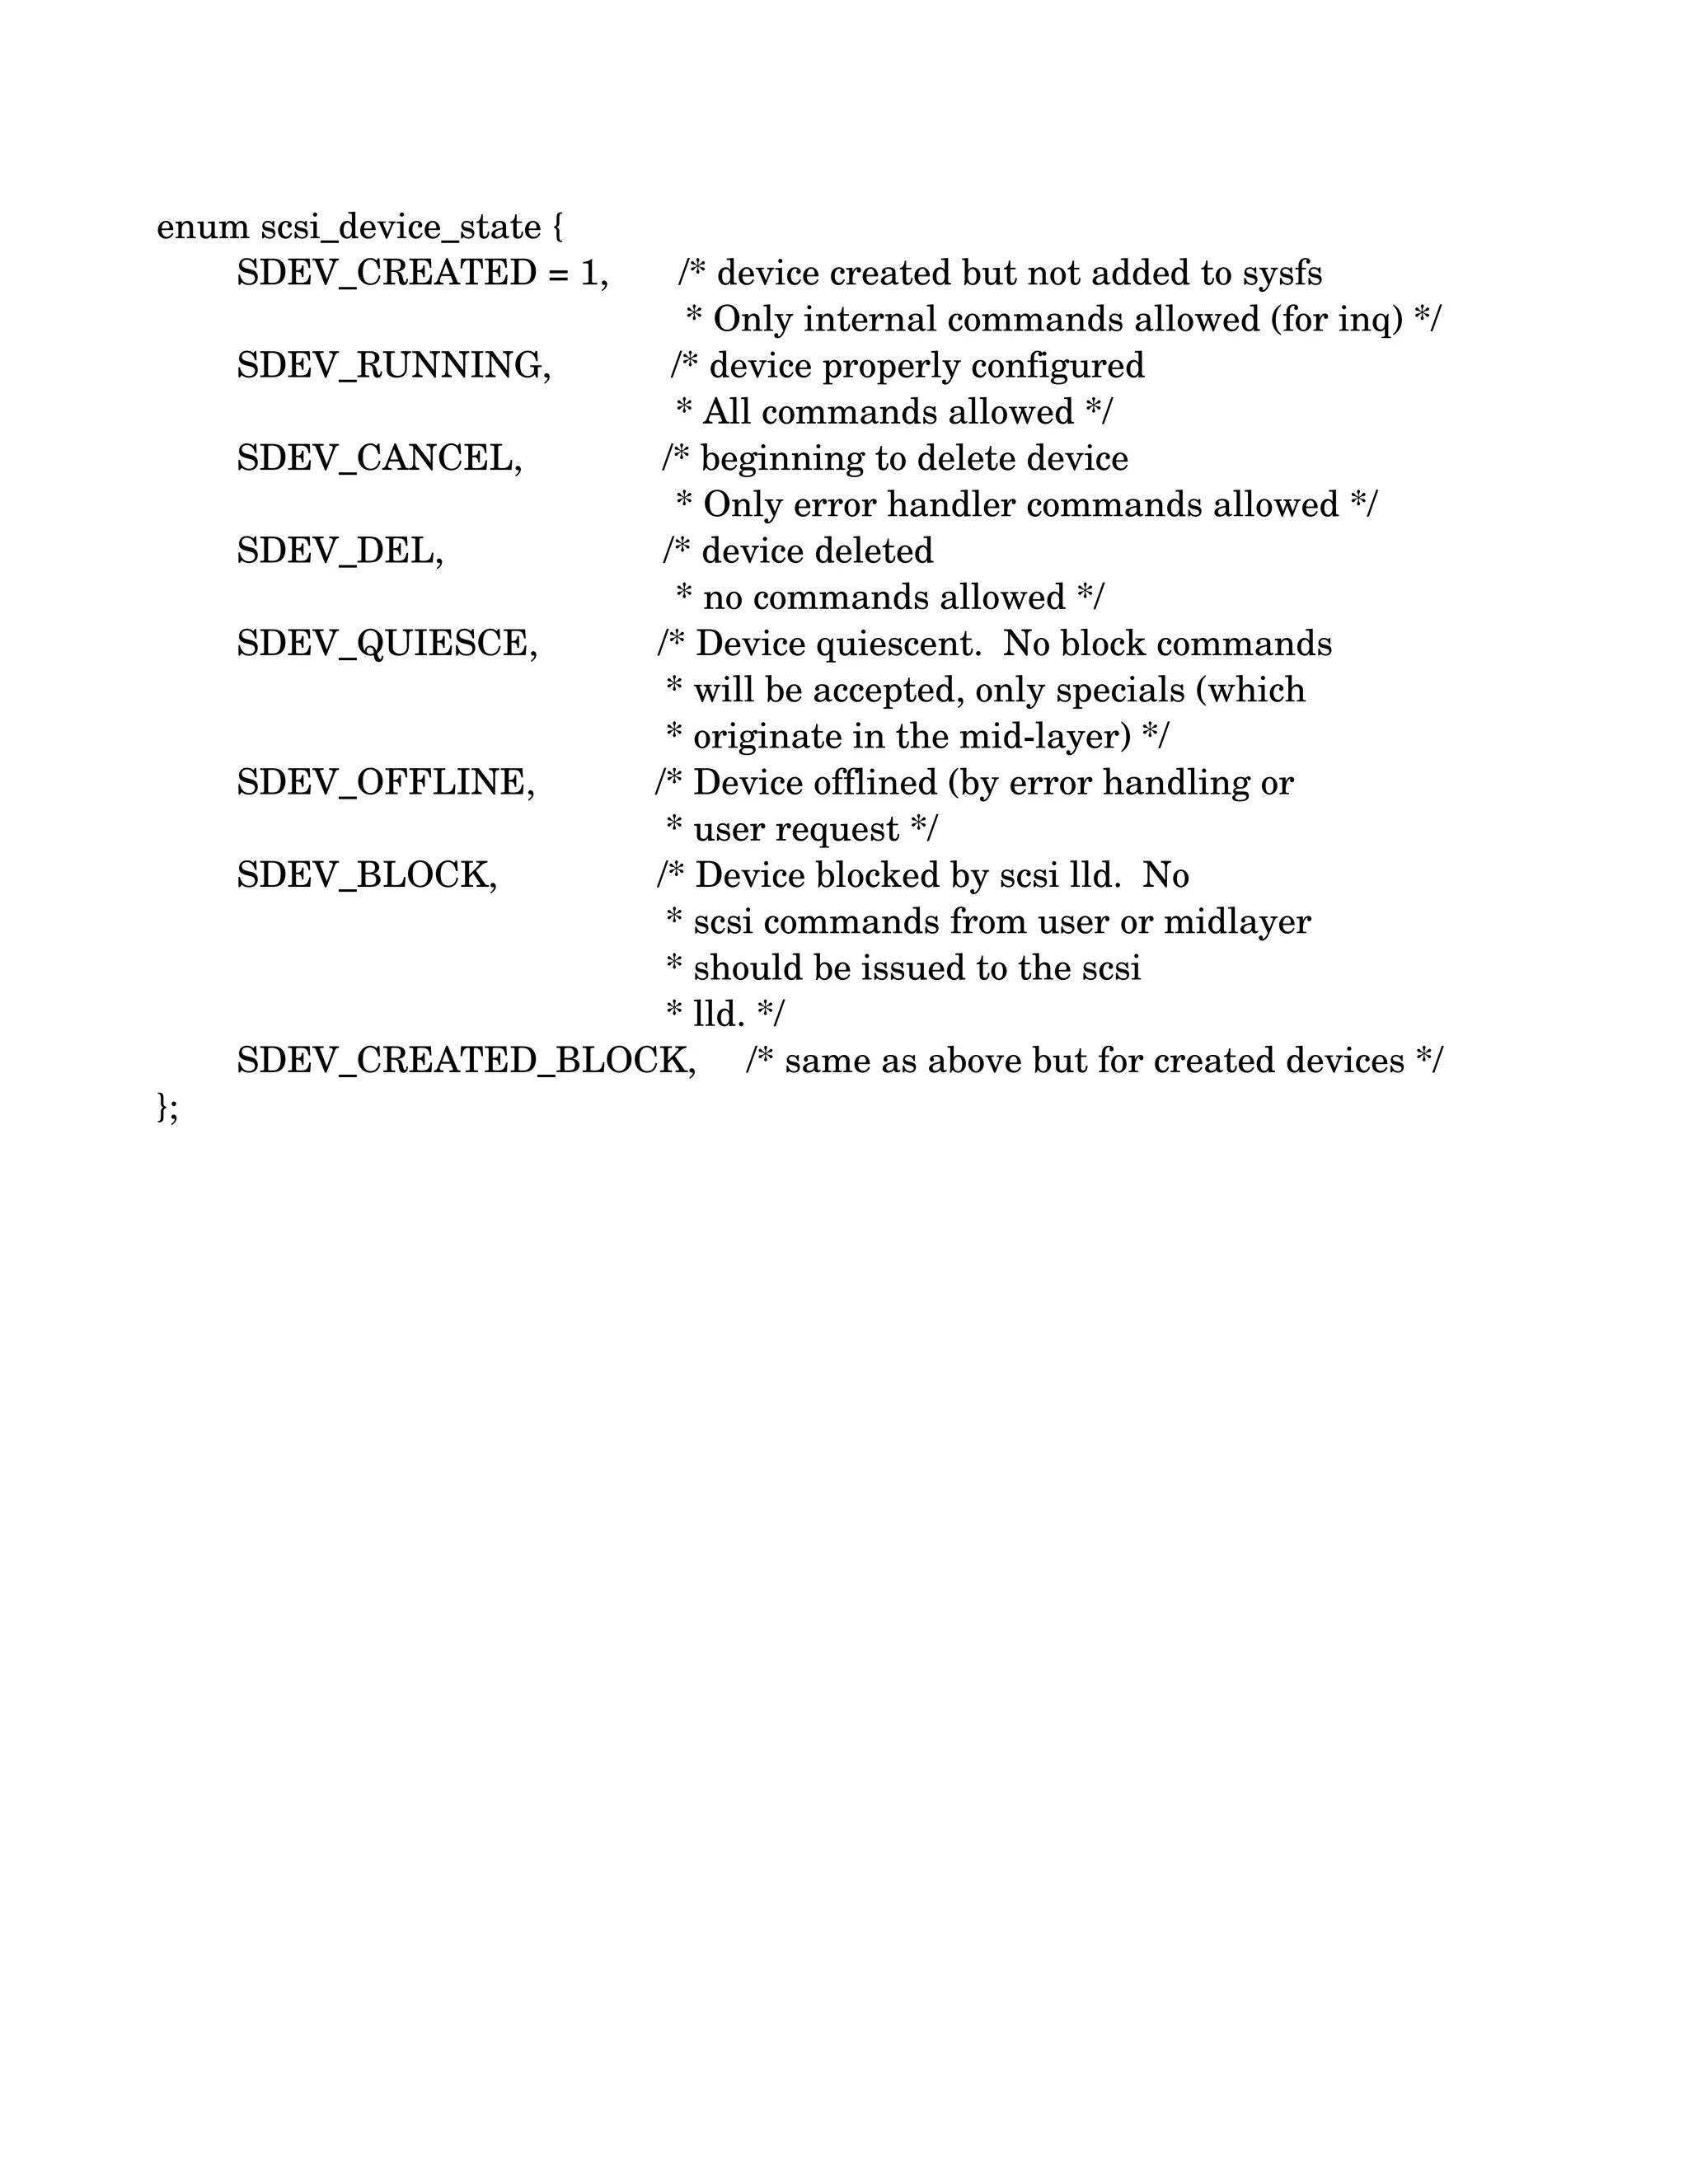
The sdev state are defined in include/scsi/scsi_device.h file.](https://image.slidesharecdn.com/a32c3dd7-4584-46e9-a1d2-28f0f7272794-160202112118/75/Kernel_Crash_Dump_Analysis-33-2048.jpg)
![Method: 2
Determine struct request_queue * using "dev d" command.
crash> dev d
MAJOR GENDISK NAME REQUEST_QUEUE TOTAL ASYNC SYNC DRV
8 ffff88404ee6b400 sda ffff88204c212338 0 0 0 0
struct request_queue * for /dev/sda is 0xffff88204c212338
Determine "queuedata" from struct request_queue *
crash> request_queue.queuedata ox
struct request_queue {
[0x300] void *queuedata;
}
crash> request_queue.queuedata ffff88204c212338
queuedata = 0xffff88204c090800
Determine sdev_state from struct scsi_device *
crash> scsi_device.sdev_state ox
struct scsi_device {
[0x5a0] enum scsi_device_state sdev_state;
}
crash> scsi_device.sdev_state 0xffff88204c090800
sdev_state = SDEV_RUNNING](https://image.slidesharecdn.com/a32c3dd7-4584-46e9-a1d2-28f0f7272794-160202112118/75/Kernel_Crash_Dump_Analysis-35-2048.jpg)
![How to determine the default I/O scheduler set ?
Search keyword "scheduler" in kernel ring buffer.
Check the line which ends with "(default)".
crash> log | grep scheduler
io scheduler noop registered
io scheduler anticipatory registered
io scheduler deadline registered
io scheduler cfq registered (default)
How to determine the I/O scheduler set on a specific disk ?
Determine the struct request_queue * from "dev d" command output.
crash> dev d
MAJOR GENDISK NAME REQUEST_QUEUE TOTAL ASYNC SYNC DRV
252 ffff88018cc1ec00 vda ffff88018c460e68 0 0 0 0
struct request_queue * for /dev/sda is 0xffff88204c212338
Determine struct elevator_queue * from struct request_queue *
crash> request_queue.elevator ox
struct request_queue {
[0x18] struct elevator_queue *elevator;
}
crash> request_queue.elevator ffff88018c460e68
elevator = 0xffff88018d4b1e40
Determine struct elevator_type * from struct elevator_queue *
crash> elevator_queue.elevator_type ox
struct elevator_queue {
[0x50] struct elevator_type *elevator_type;
}
crash> elevator_queue.elevator_type 0xffff88018d4b1e40
elevator_type = 0xffffffff81af24e0 <iosched_cfq>
Determine elevator_name[16] from struct elevator_type *
crash> elevator_type.elevator_name ox
struct elevator_type {
[0xb0] char elevator_name[16];
}](https://image.slidesharecdn.com/a32c3dd7-4584-46e9-a1d2-28f0f7272794-160202112118/75/Kernel_Crash_Dump_Analysis-36-2048.jpg)


![What is pykdump (not supported by Red Hat Support) ?
pykdump is a python framework to access Linux dumps programmatically
from "crash".
pykdump can be downloaded from http://sourceforge.net/projects/pykdump
Filename: mpykdump0.8.2x86_64.tar.gz
It provide two files:
# tar xvf mpykdump0.8.2x86_64.tar.gz
README
usr/local/lib/mpykdump64.so
usr/local/bin/crash64
How to use pykdump ?
Load crash extension mpykdump64.so.
crash> extend /usr/local/lib/mpykdump64.so
Setting scroll off while initializing PyKdump
/usr/local/lib/mpykdump64.so: shared object loaded
crash extension mpykdump64.so provides two very useful commands.
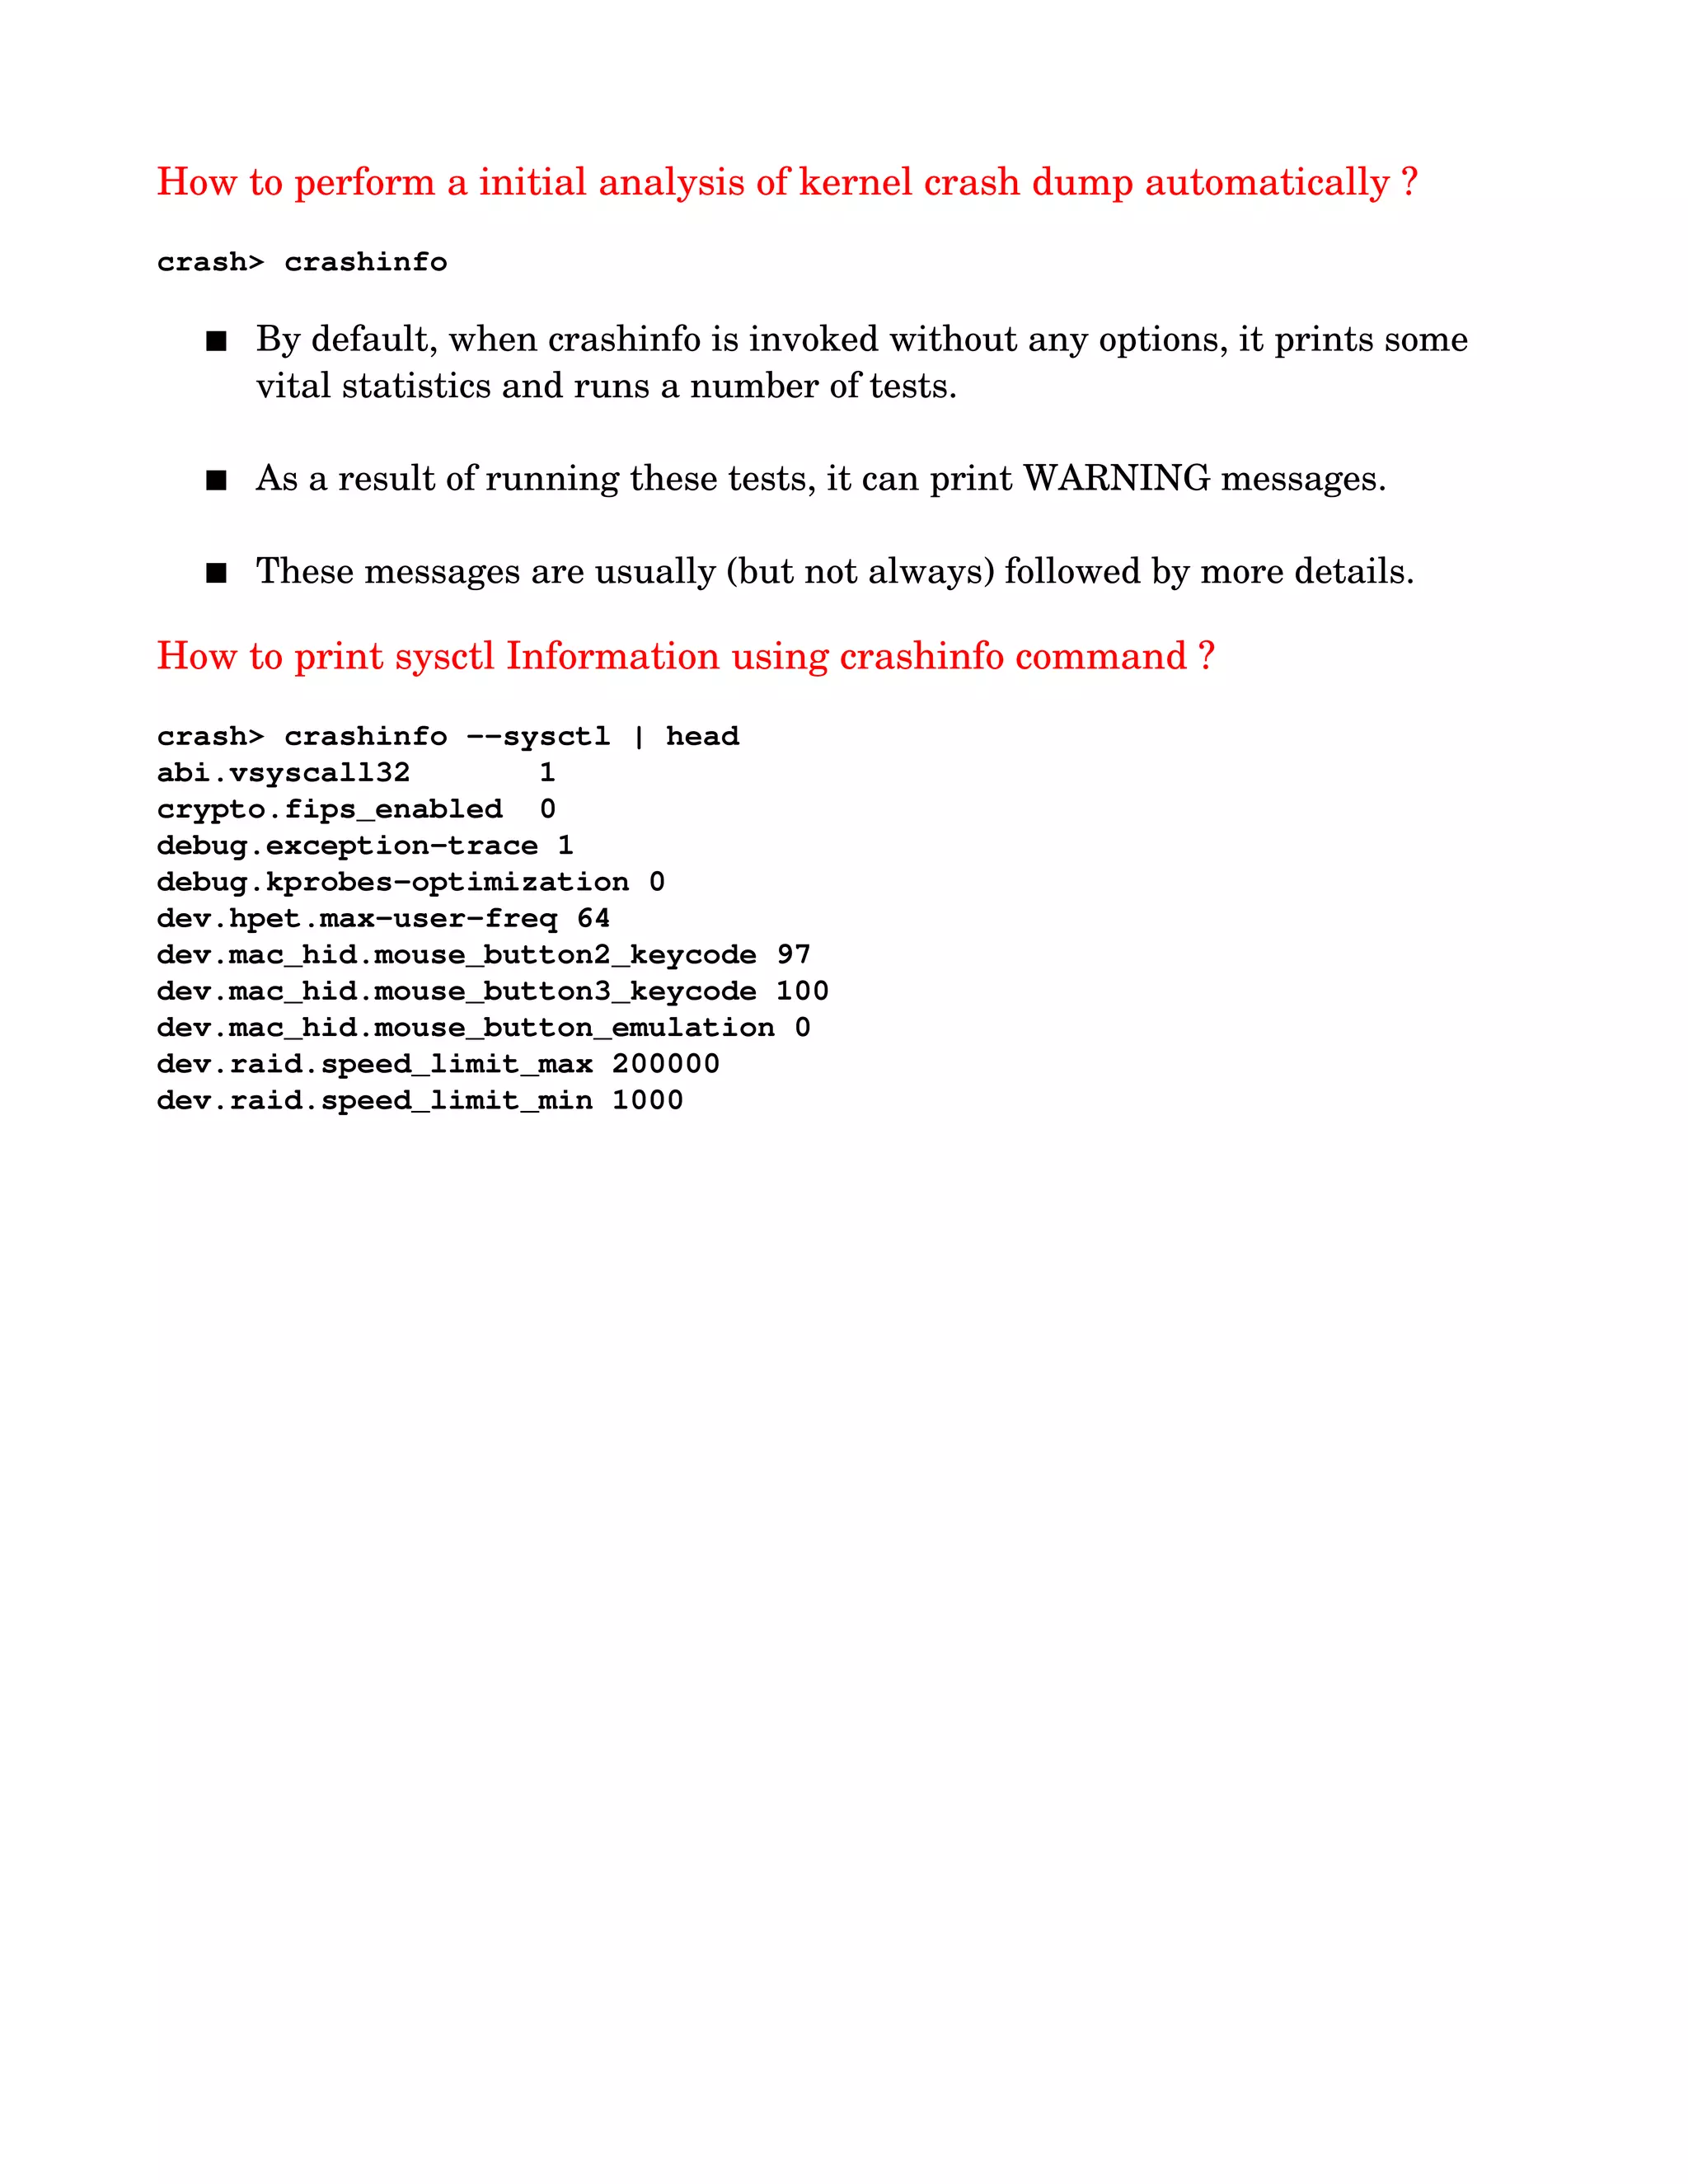
o crashinfo
o xportshow
[ crashinfo ]
crashinfo is a tool gather information directly on host machine.
It do some simple automated firstpass analysis.
It useful for hangs or performance problems.
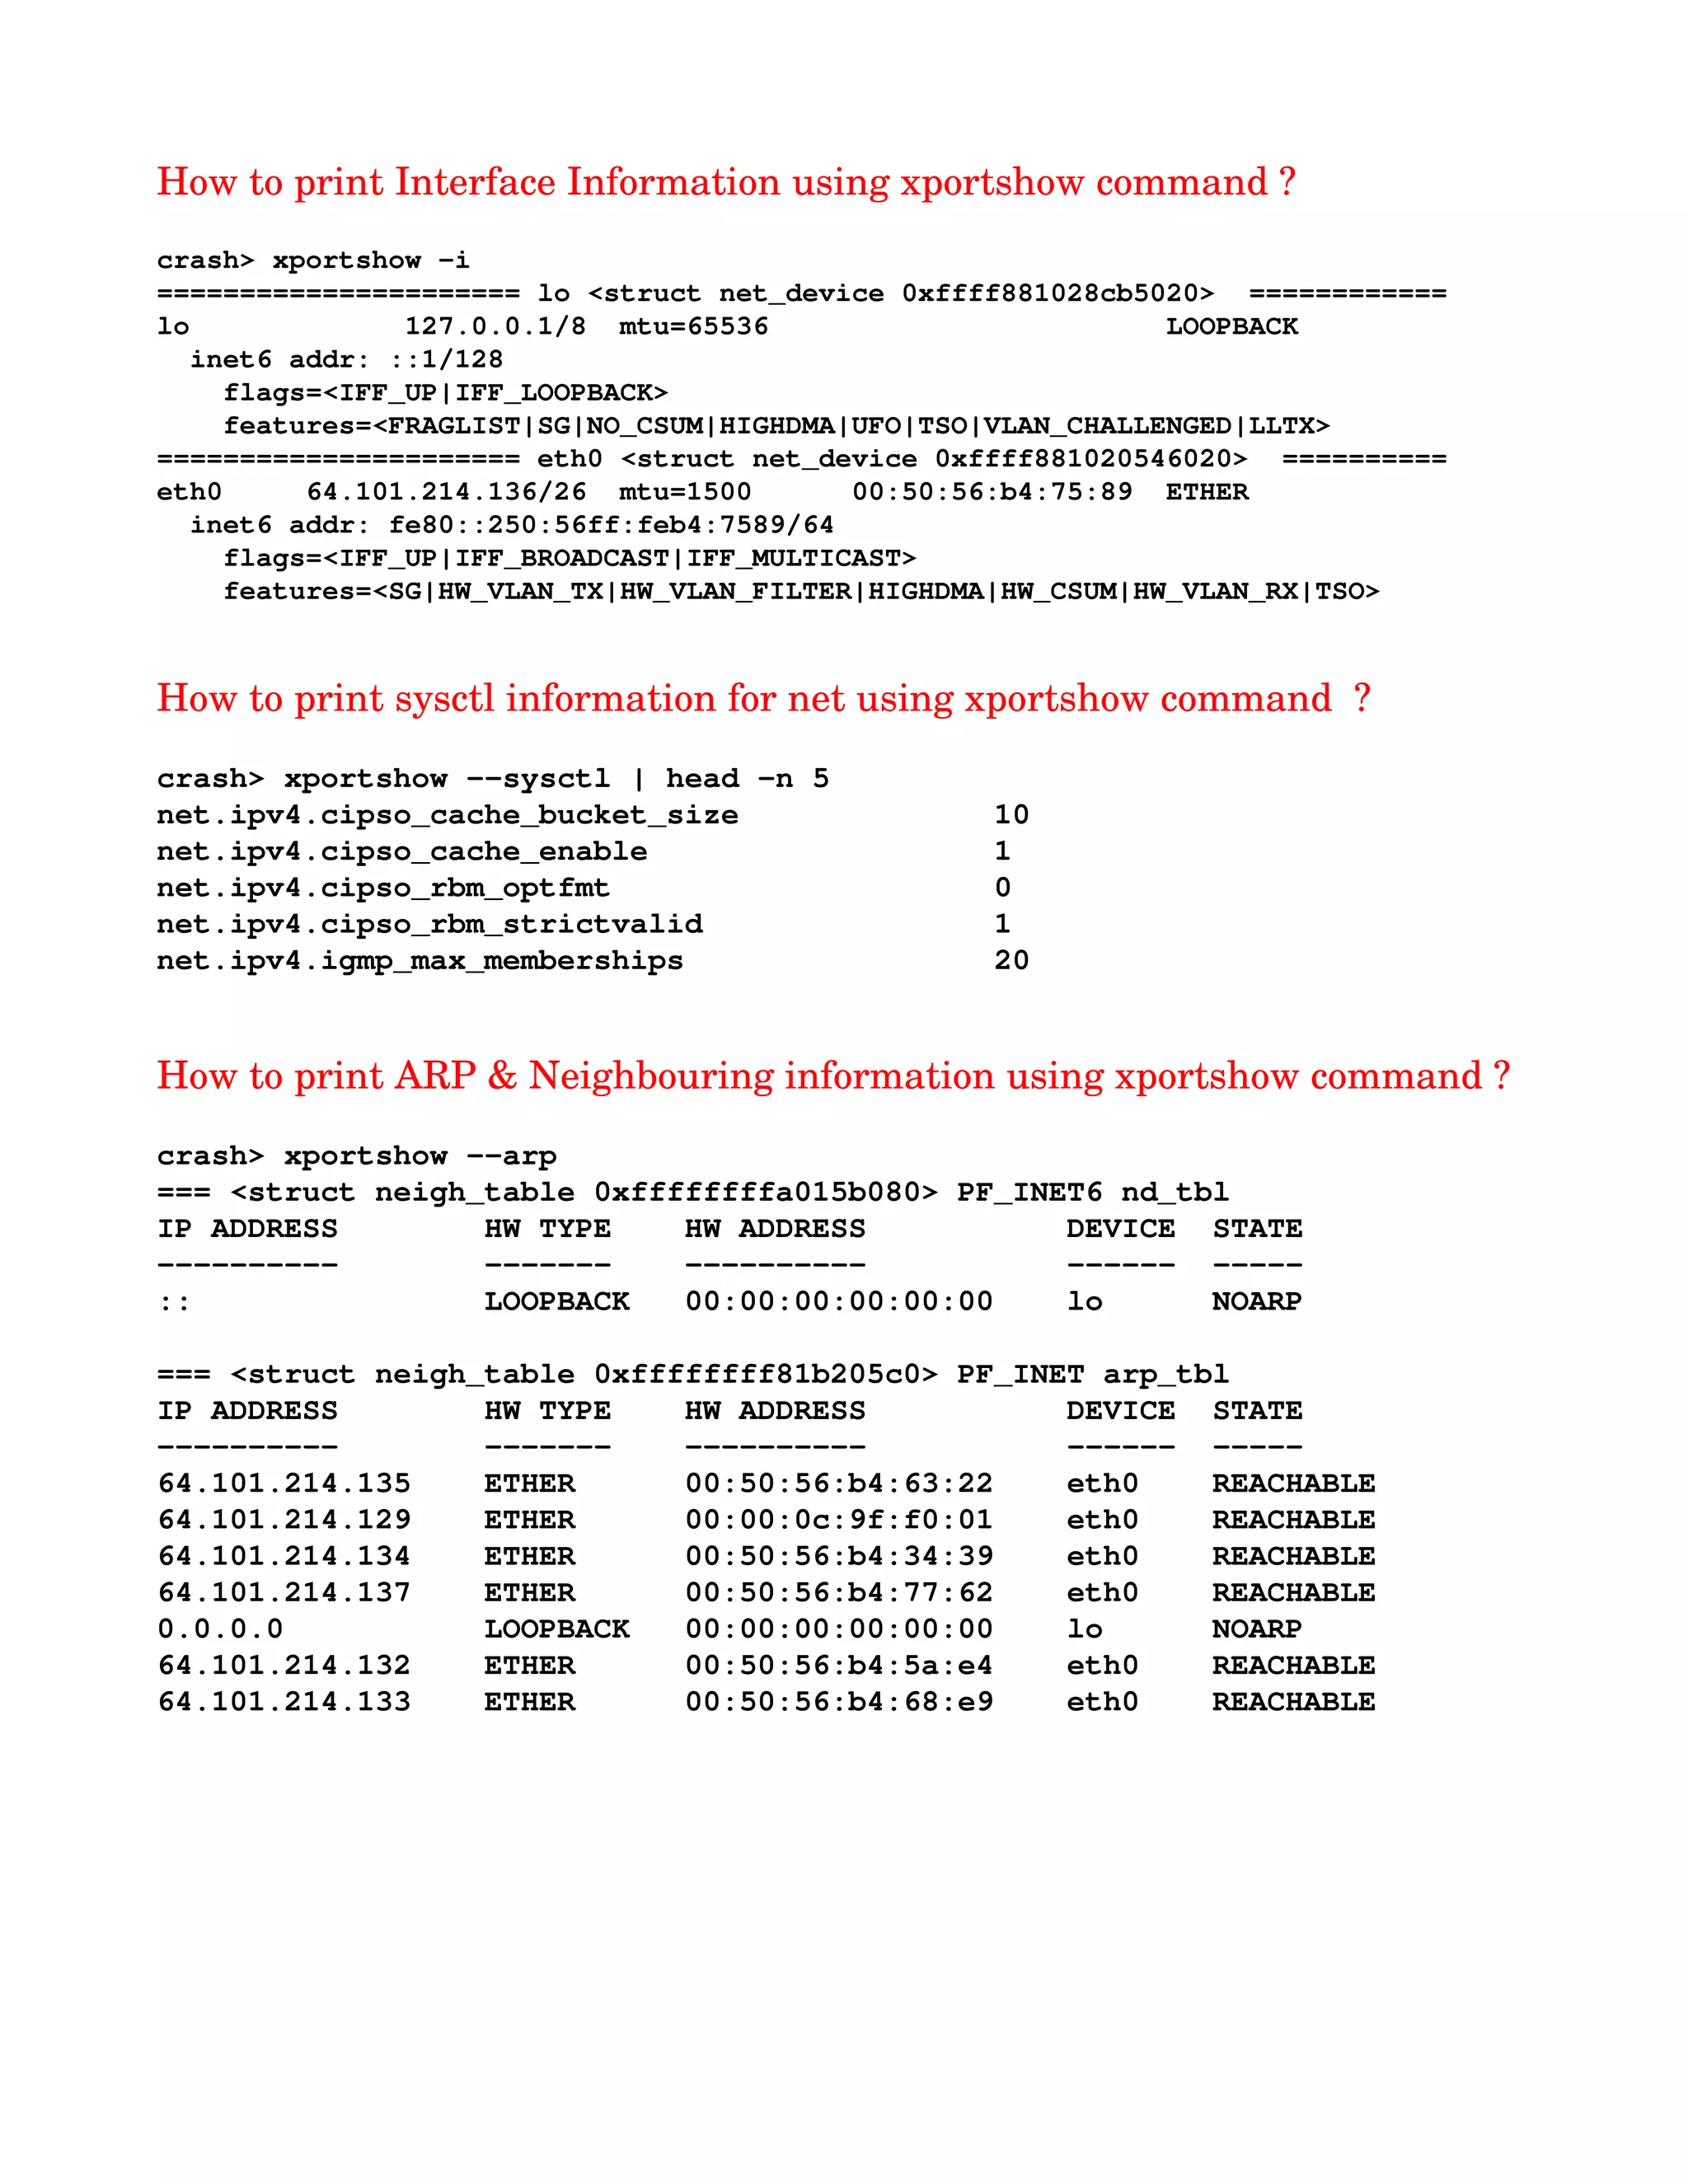
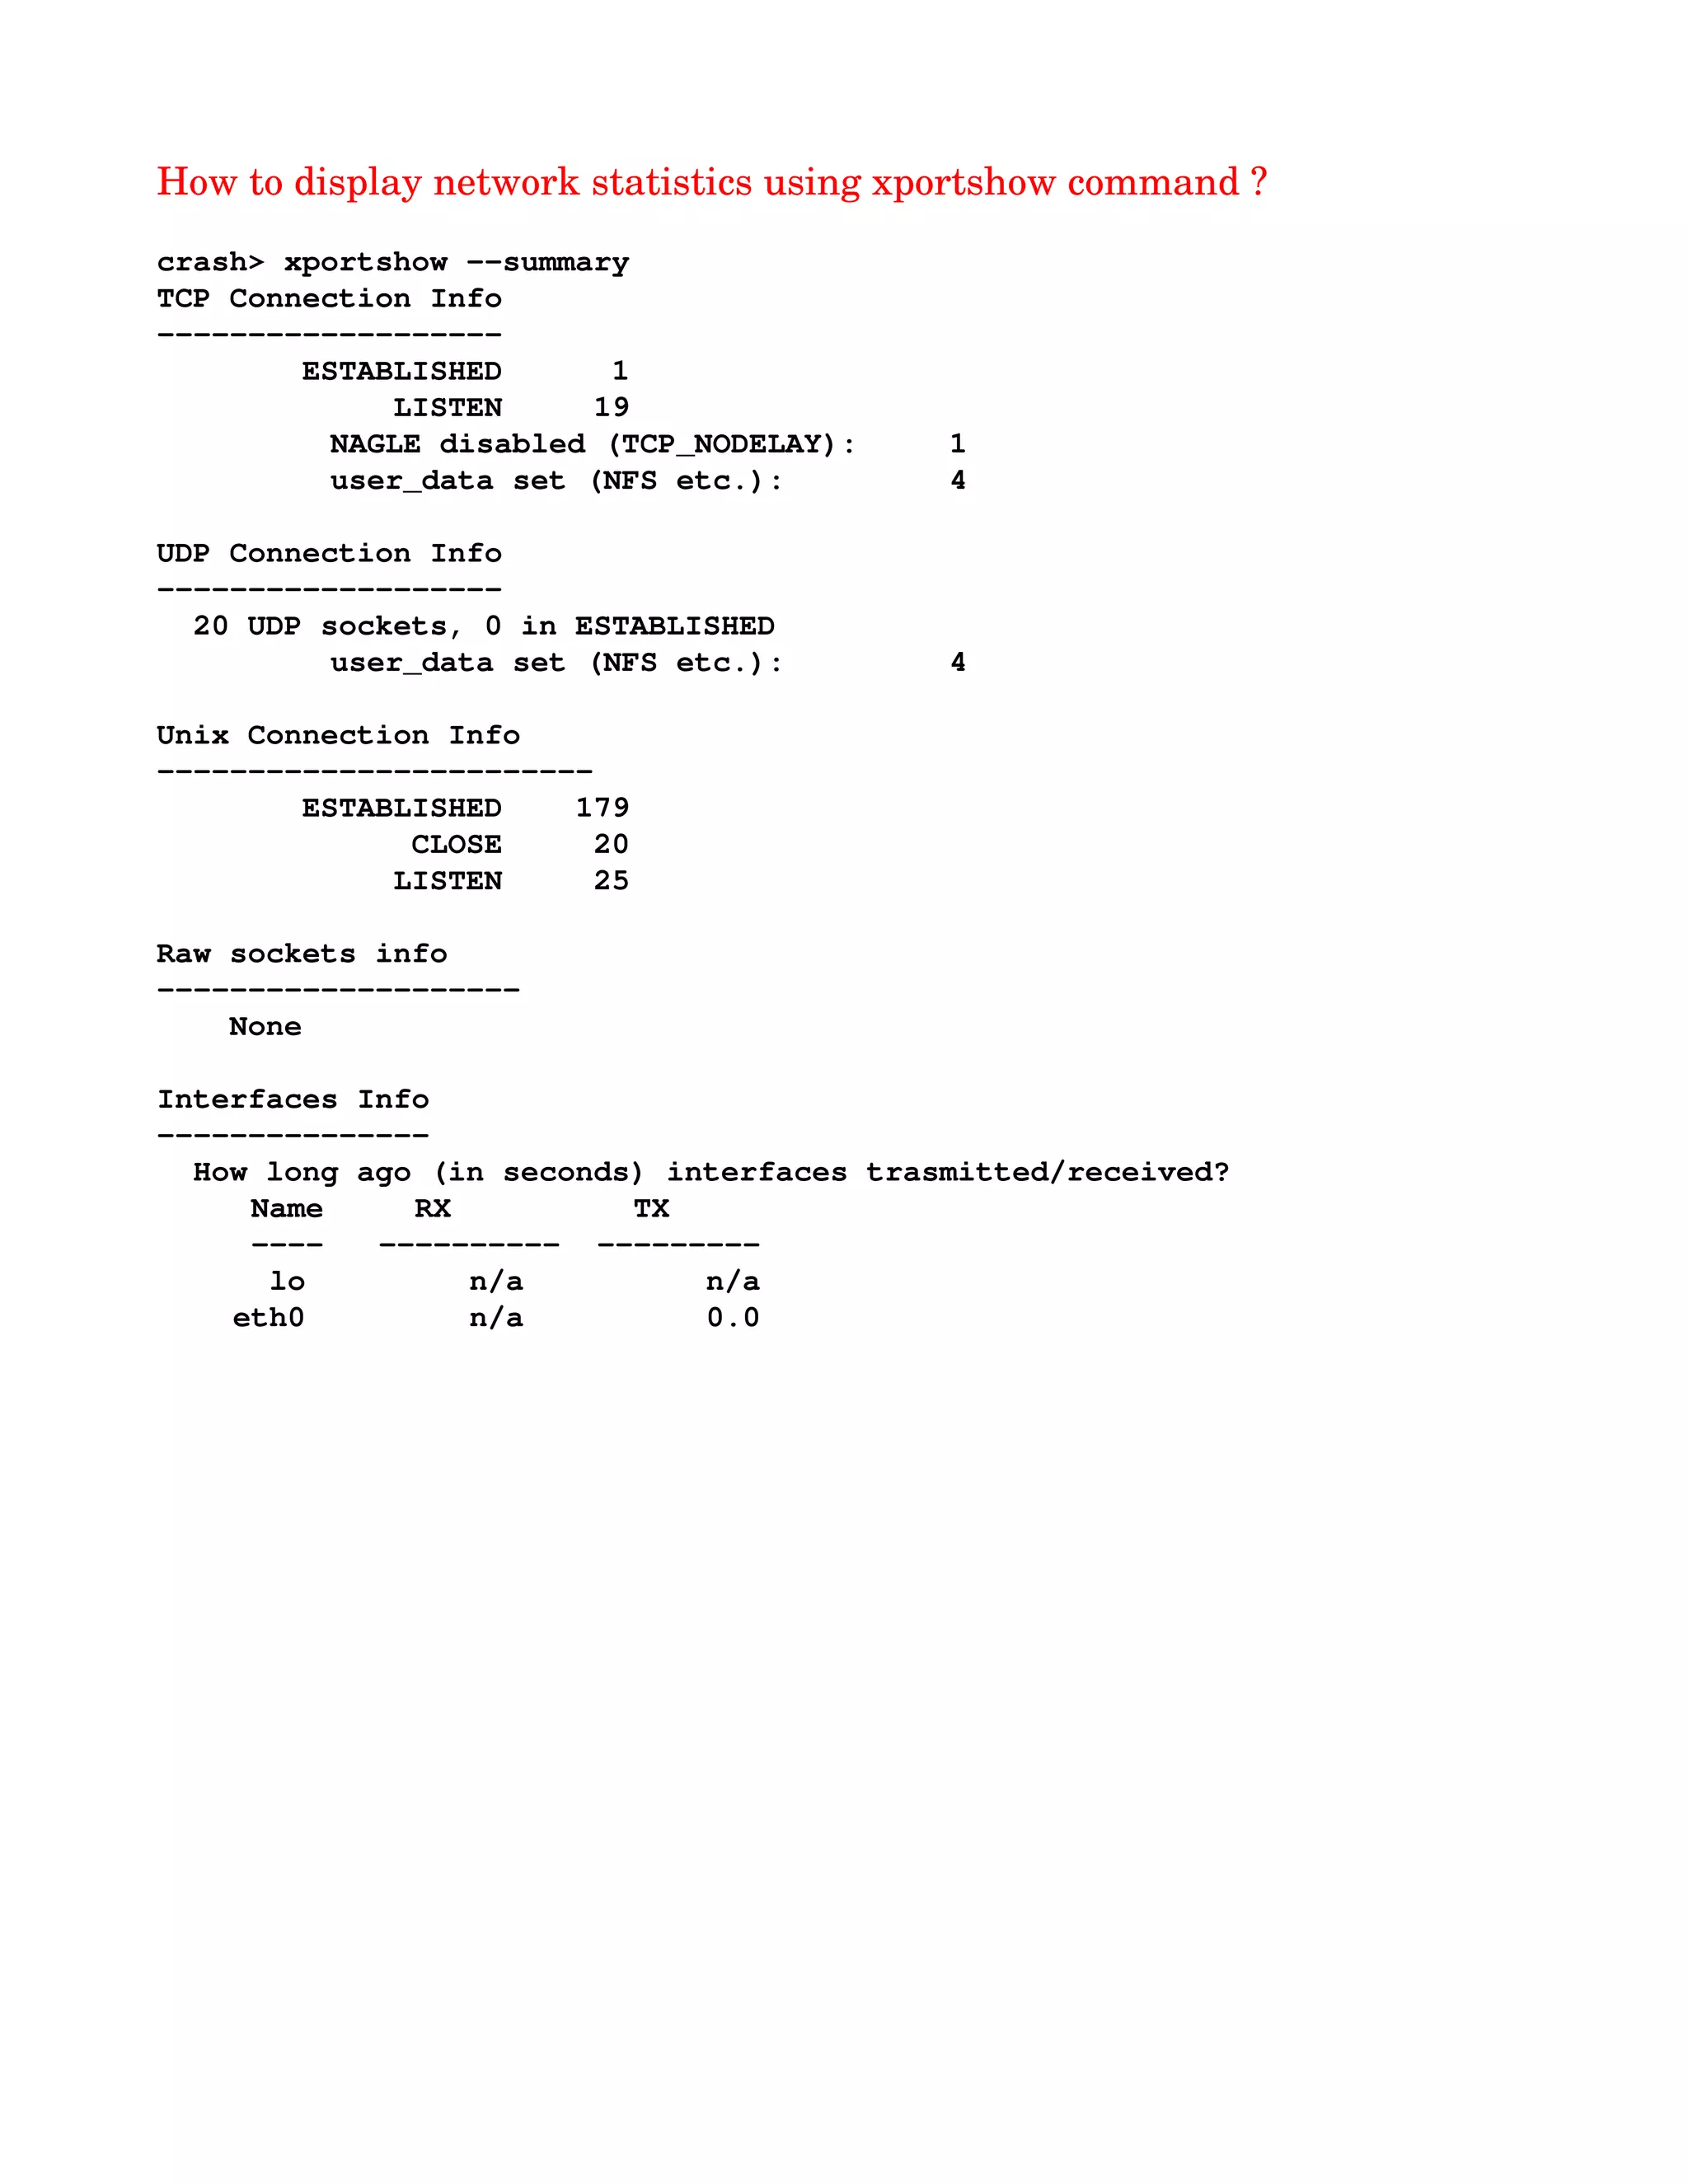
[ xportshow ]
xportshow is a tool to extract and print the networking transport related
information from Linux kernel dumps.](https://image.slidesharecdn.com/a32c3dd7-4584-46e9-a1d2-28f0f7272794-160202112118/75/Kernel_Crash_Dump_Analysis-41-2048.jpg)


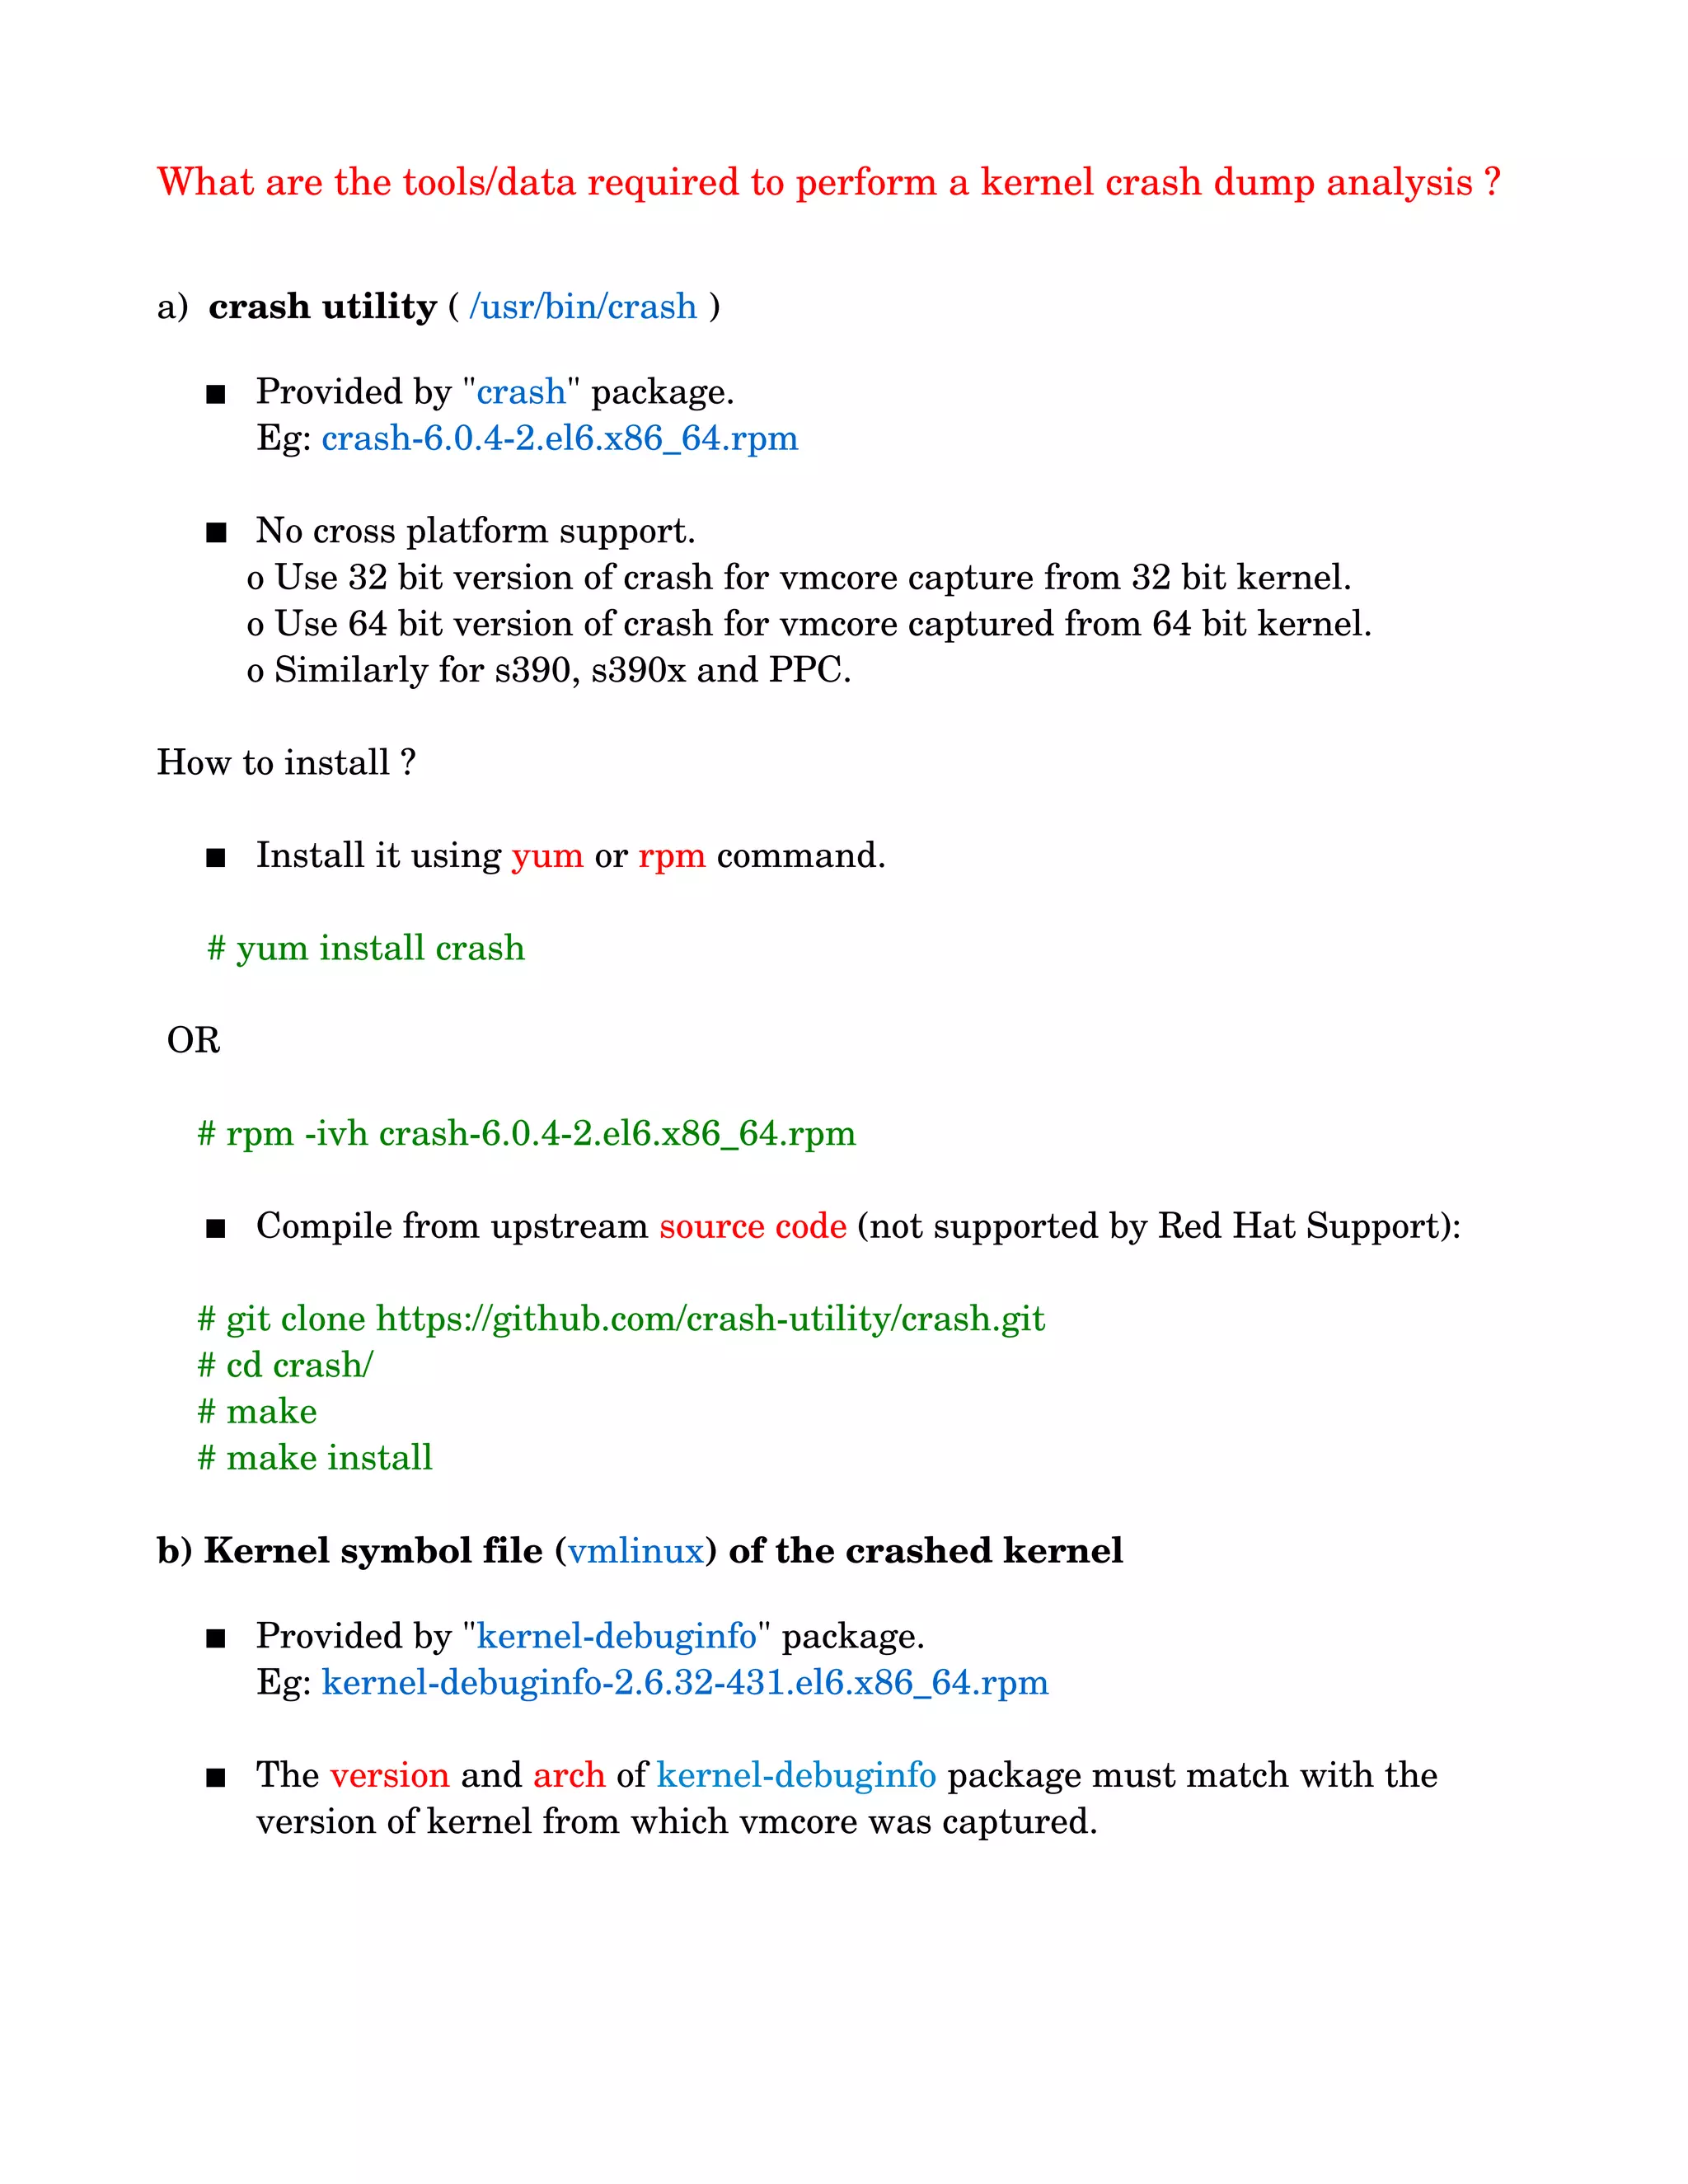
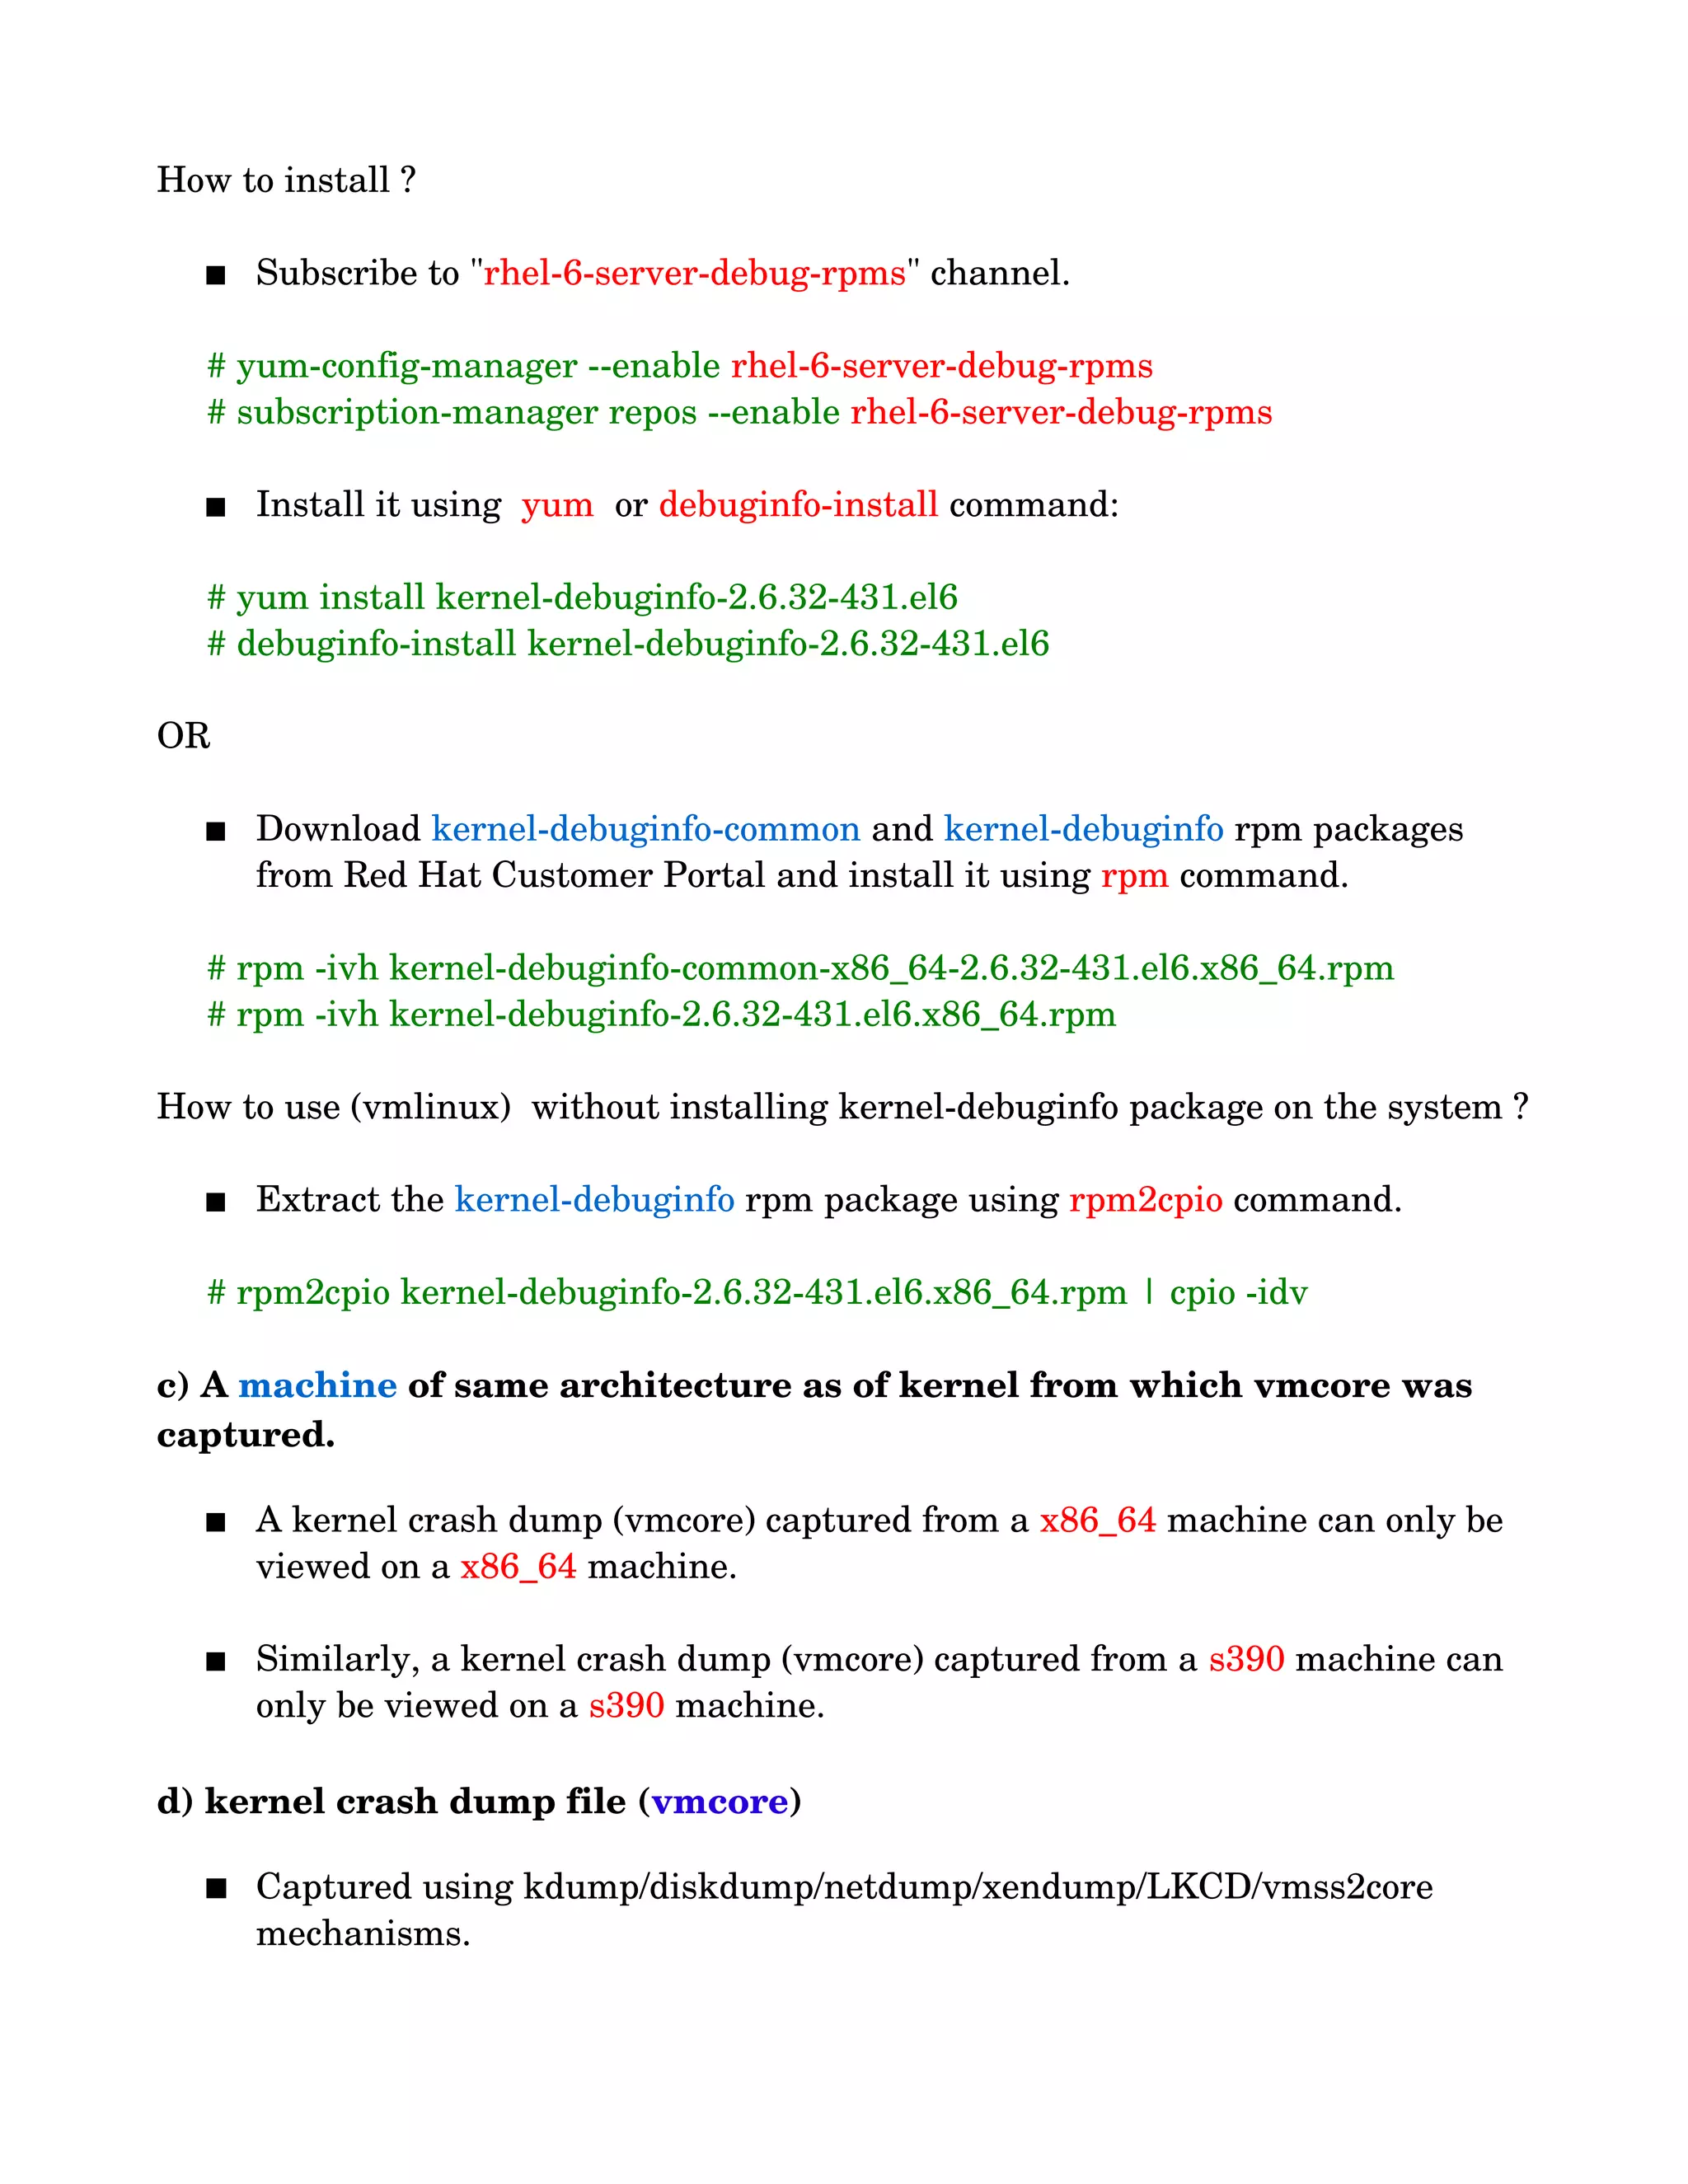
The document provides an overview of kernel crash dump analysis including: - The tools and data required such as the crash utility, kernel symbol files, vmcore files - How to install and use these components - Basic crash commands to analyze system, memory, storage, and network subsystems - How to dynamically load crash extension modules to add custom commands
Overview of kernel crash dump analysis presented by Buland Singh from Red Hat, outlining agenda topics.
Introduction to tools needed for kernel crash dump analysis including crash utility, vmlinux, and vmcore requirements.
Methods for opening and analyzing kernel crash dumps using commands like 'crash', along with basic commands of the crash utility.
Discussion on creating and loading crash extension modules for enhanced crash analysis.
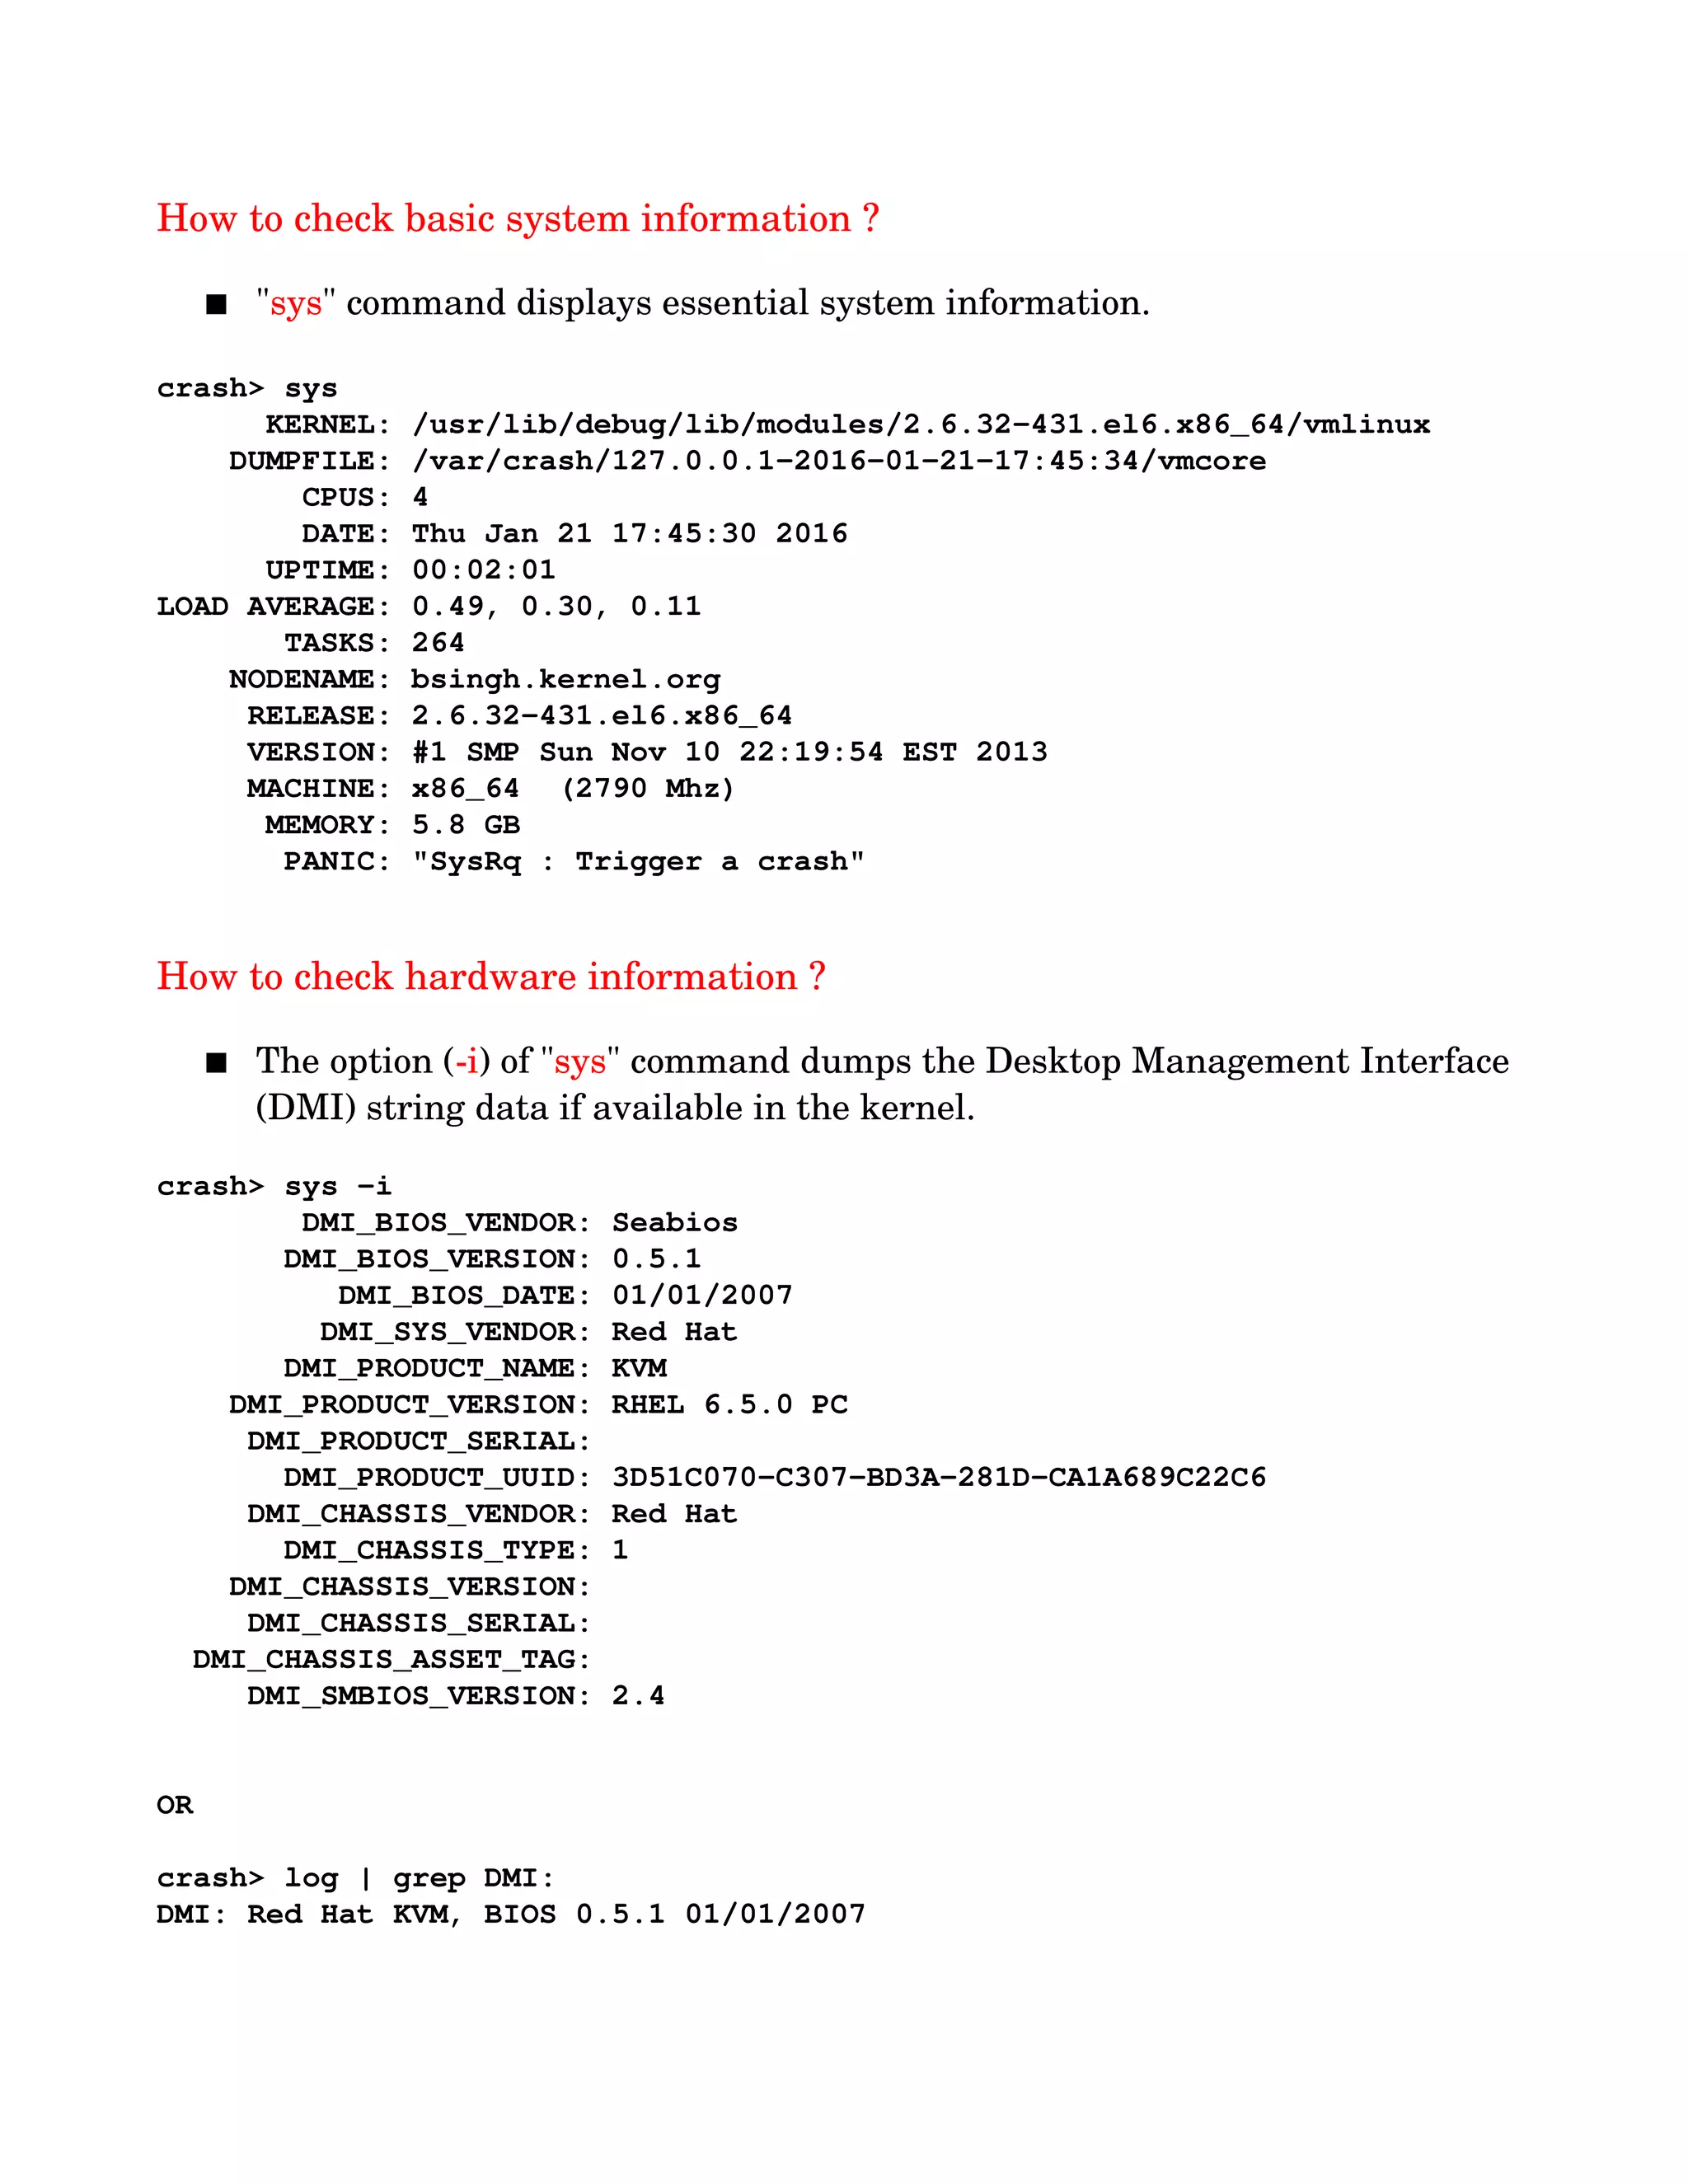
Steps to check system information, hardware details, and ring buffer log using crash commands.
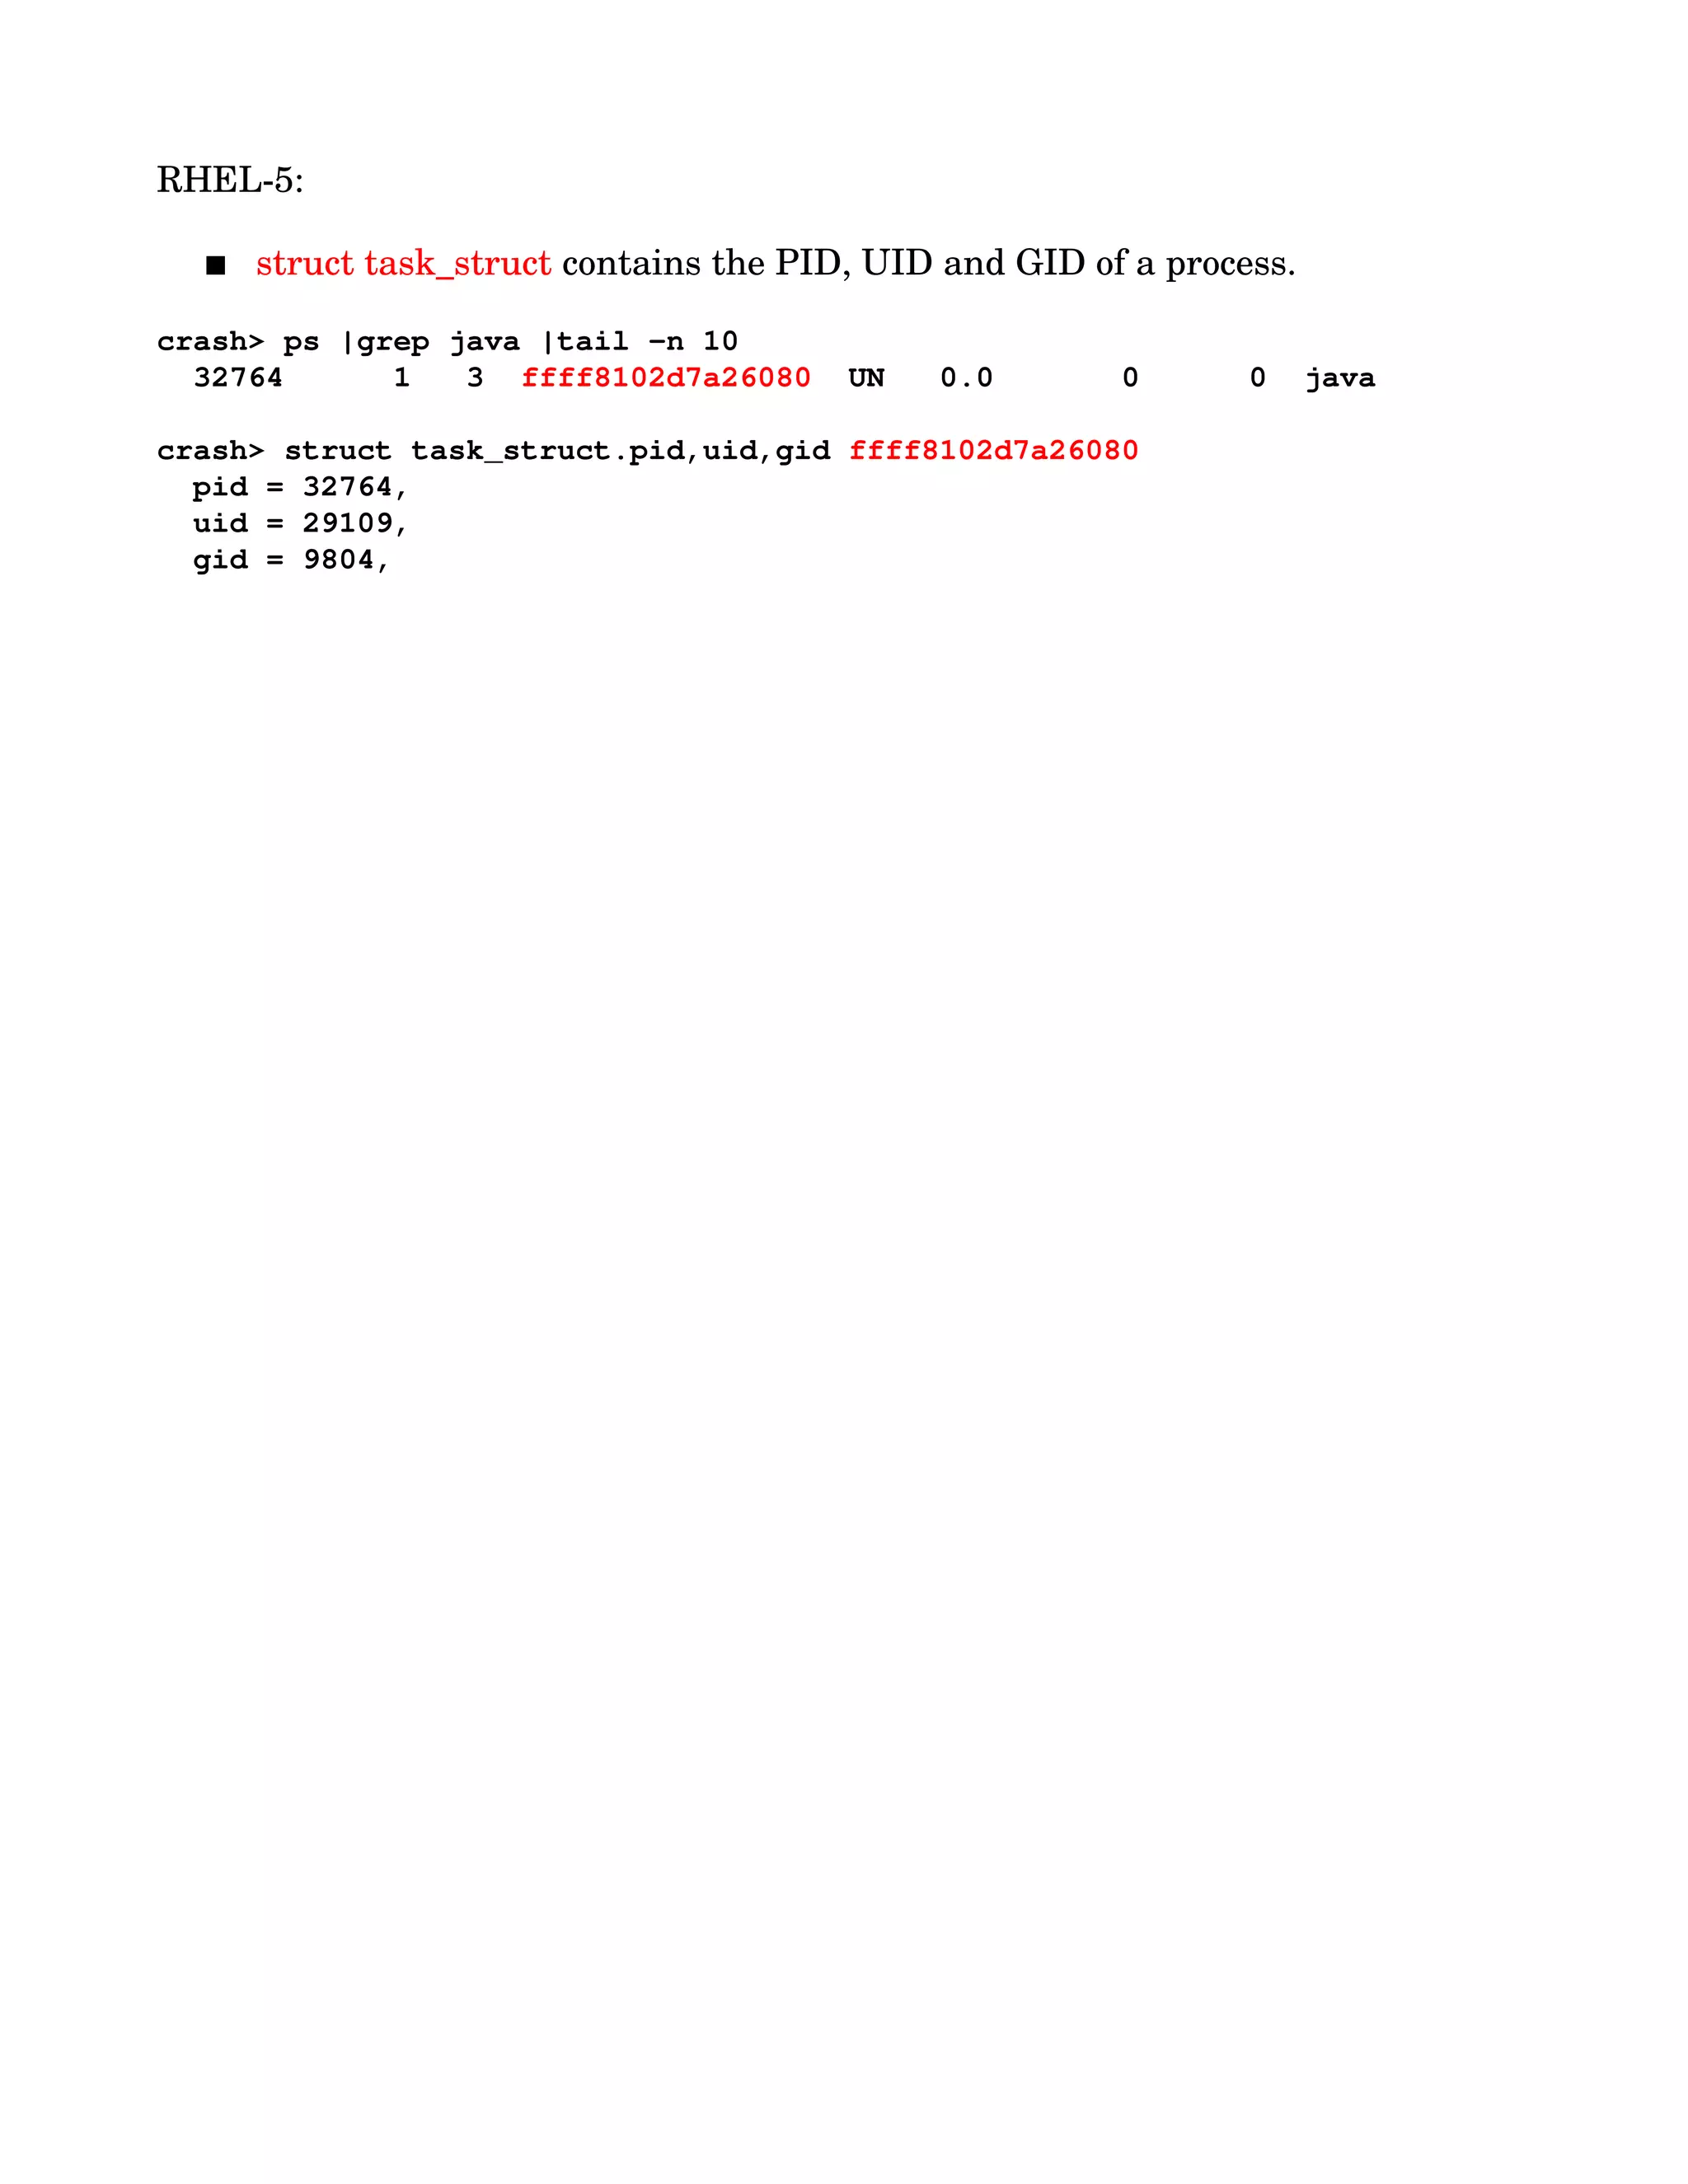
Methods for identifying panic tasks, backtrace analysis, and extracting UID and GID details for processes.
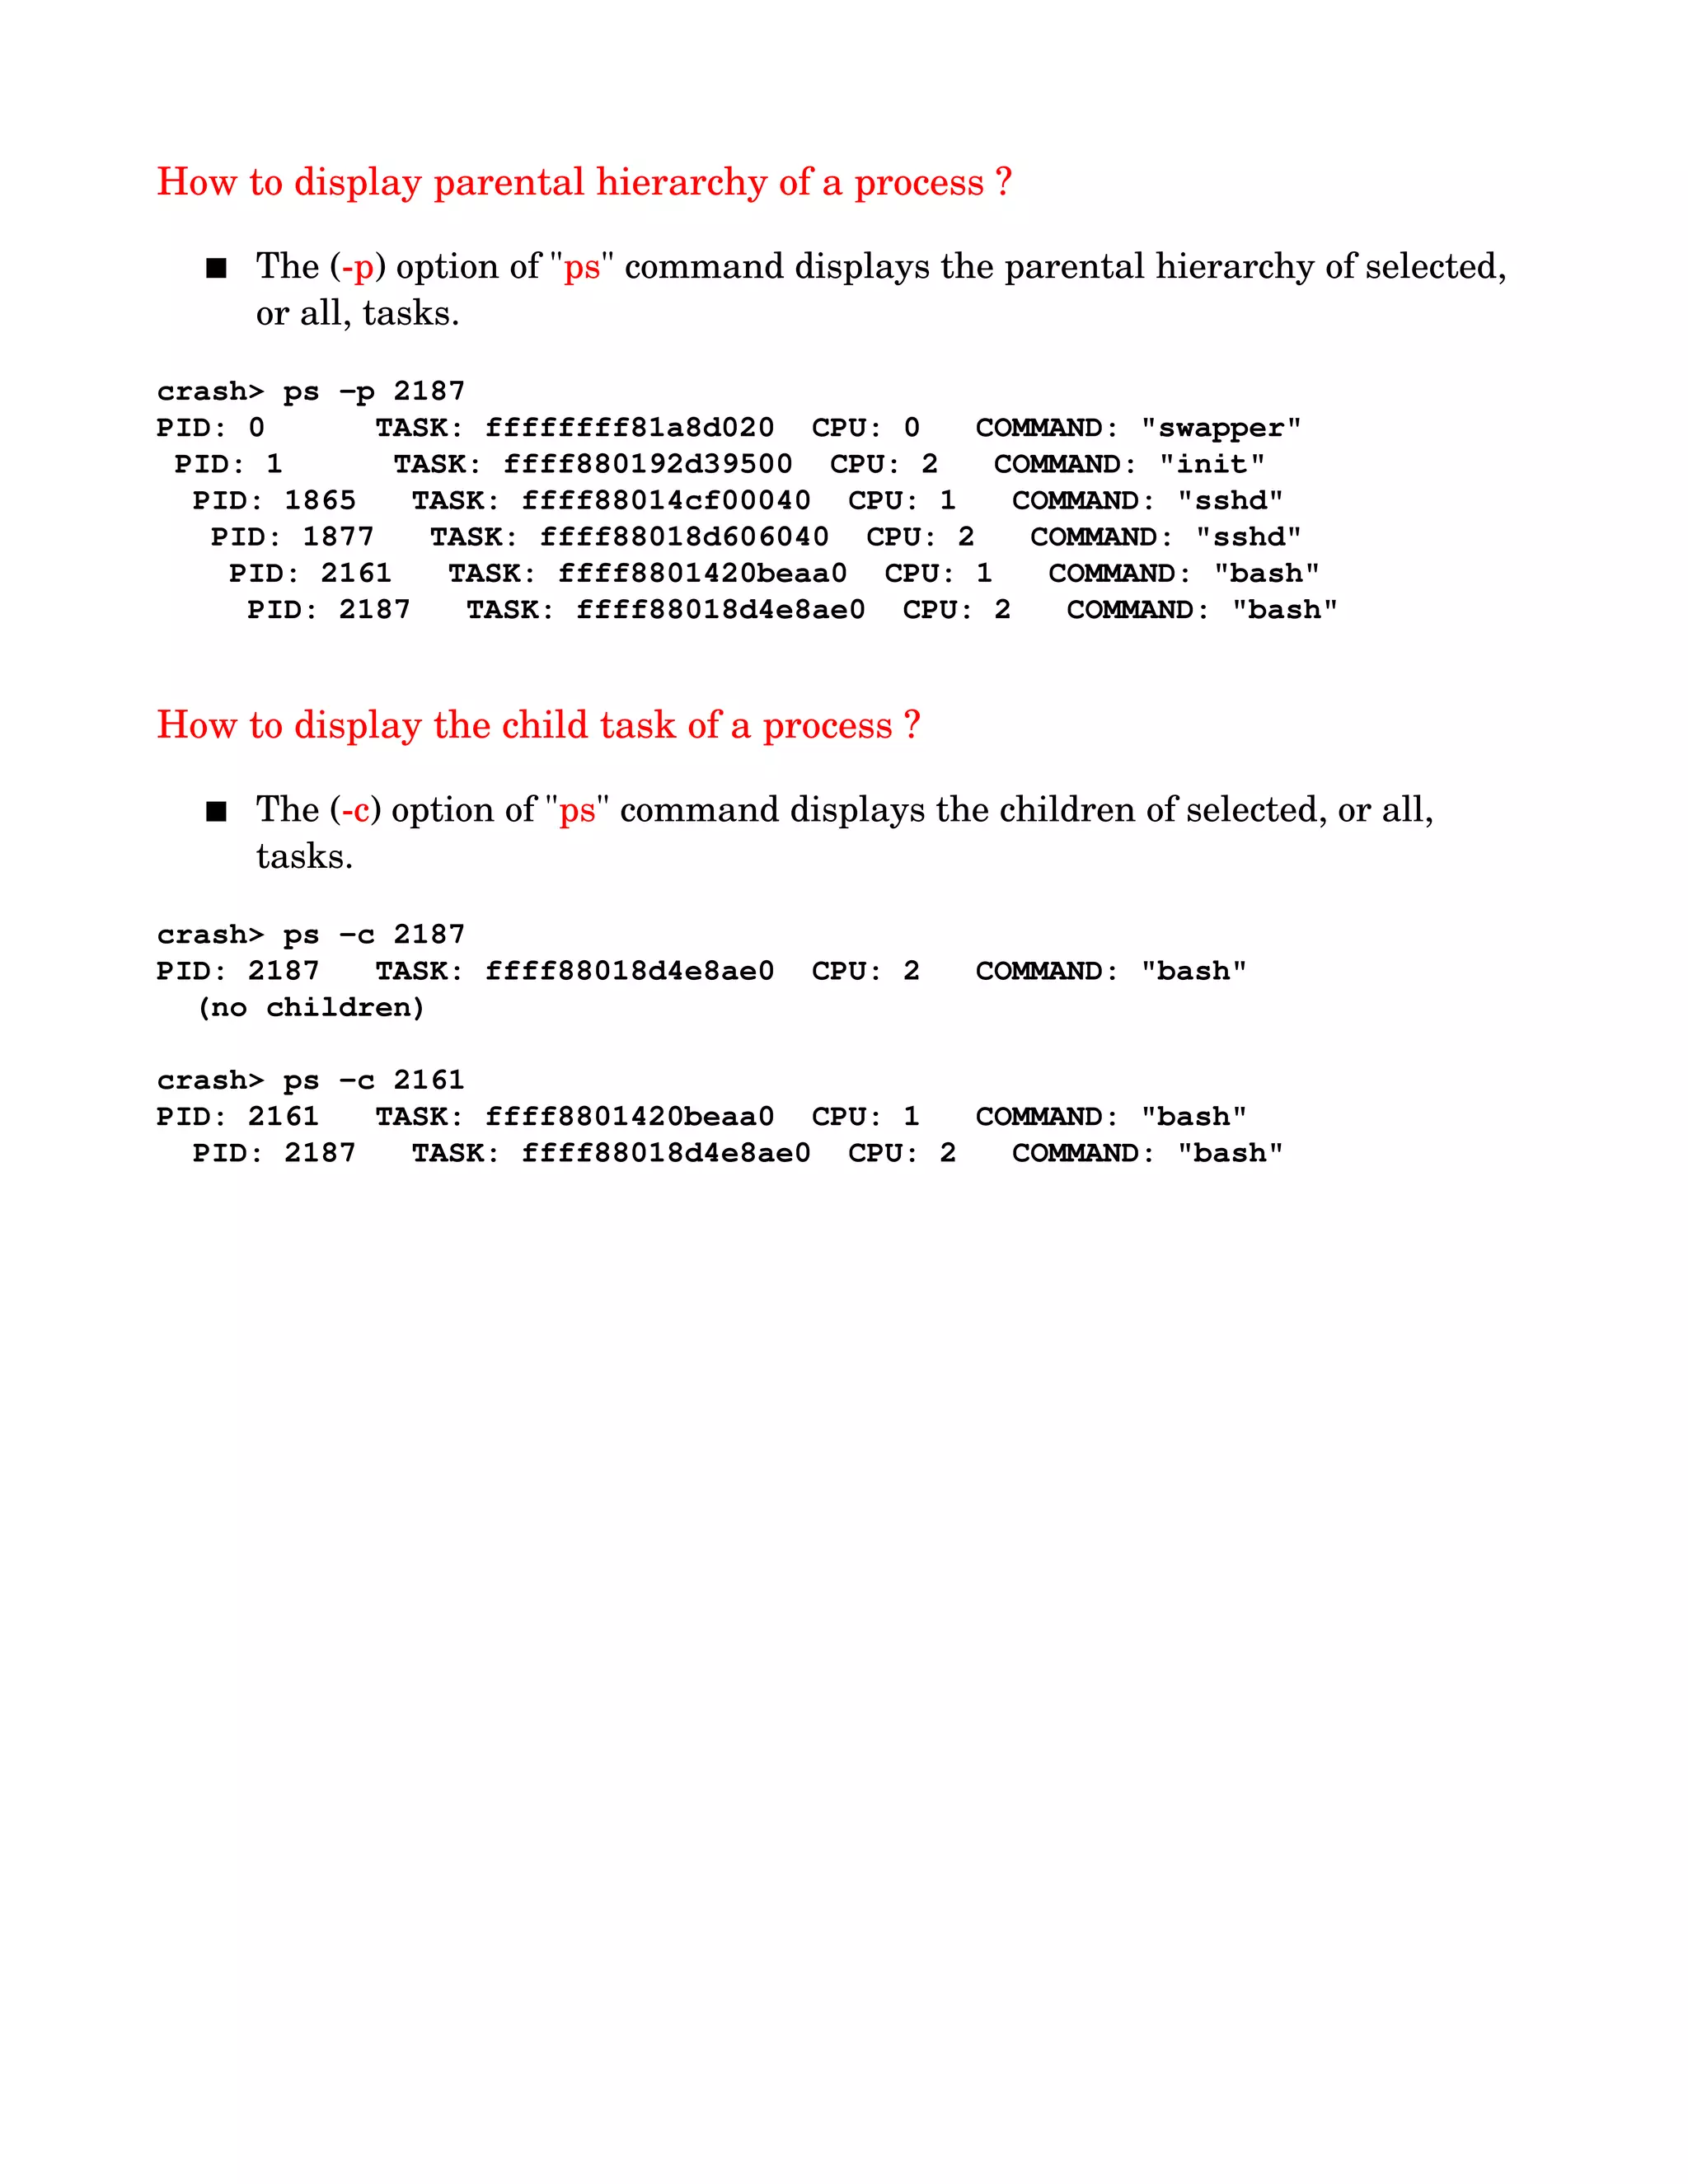
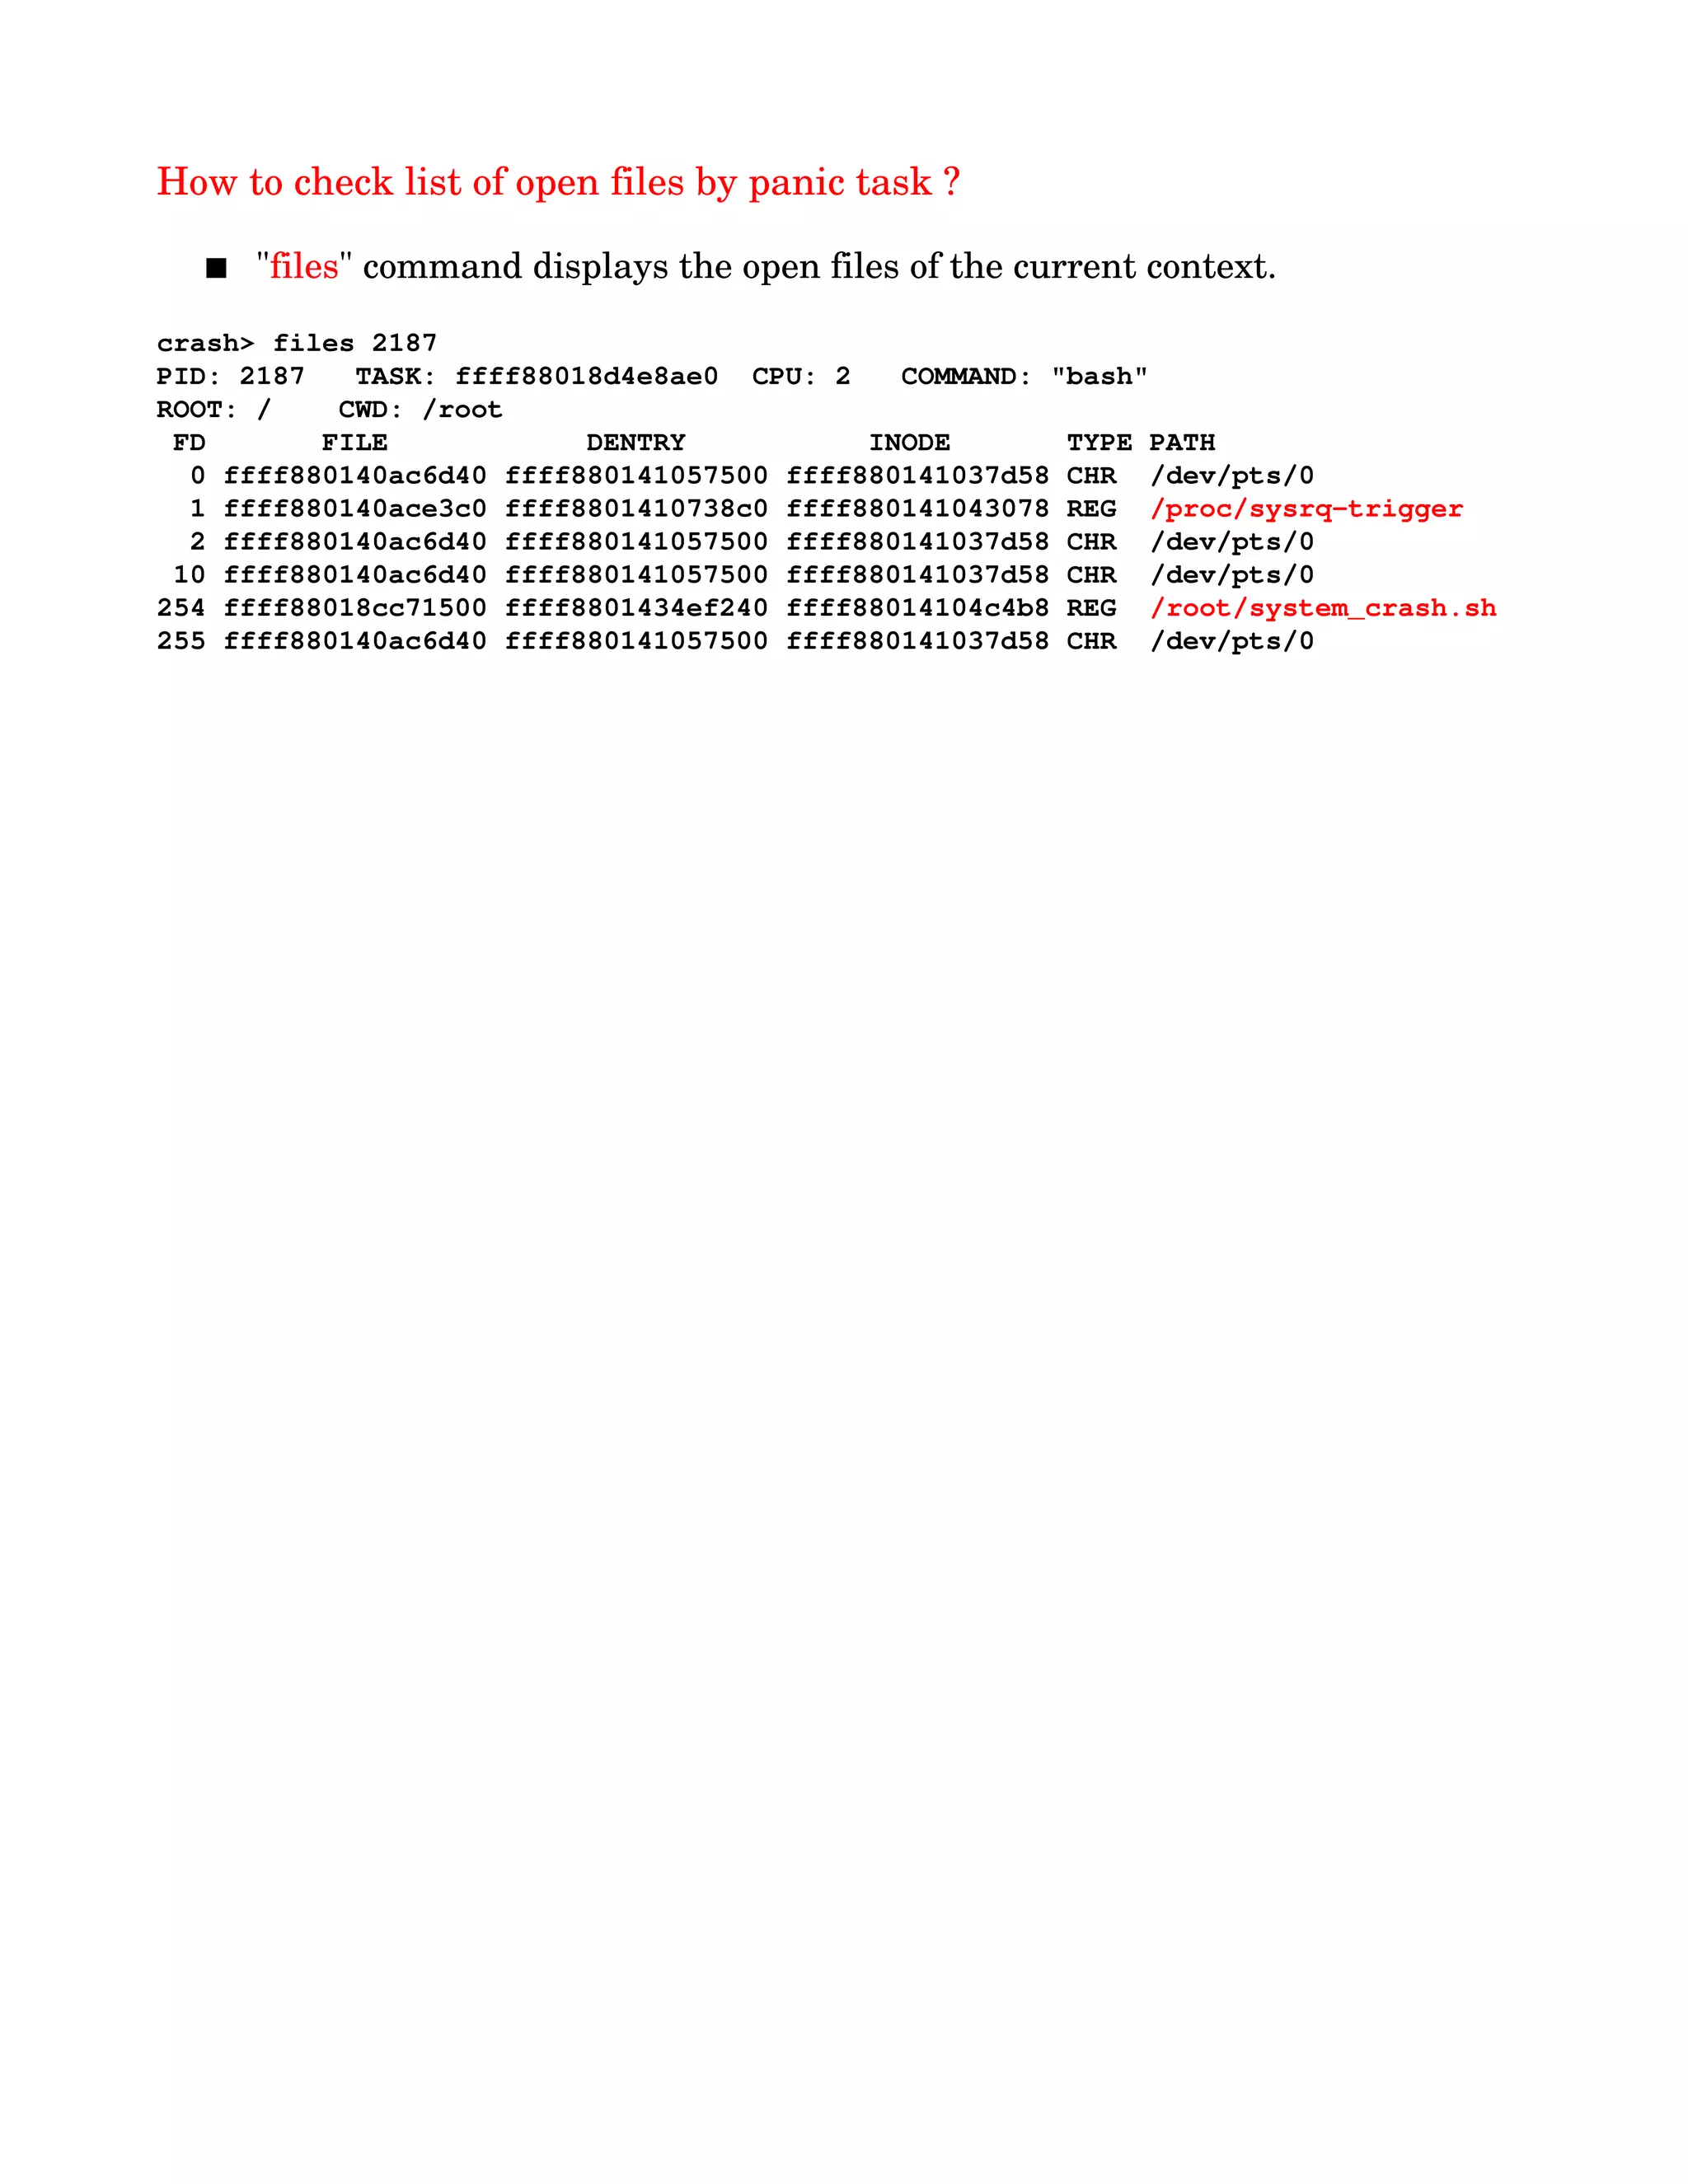
Commands to display process parental hierarchy, child tasks, open files, task priorities, and resource limits.
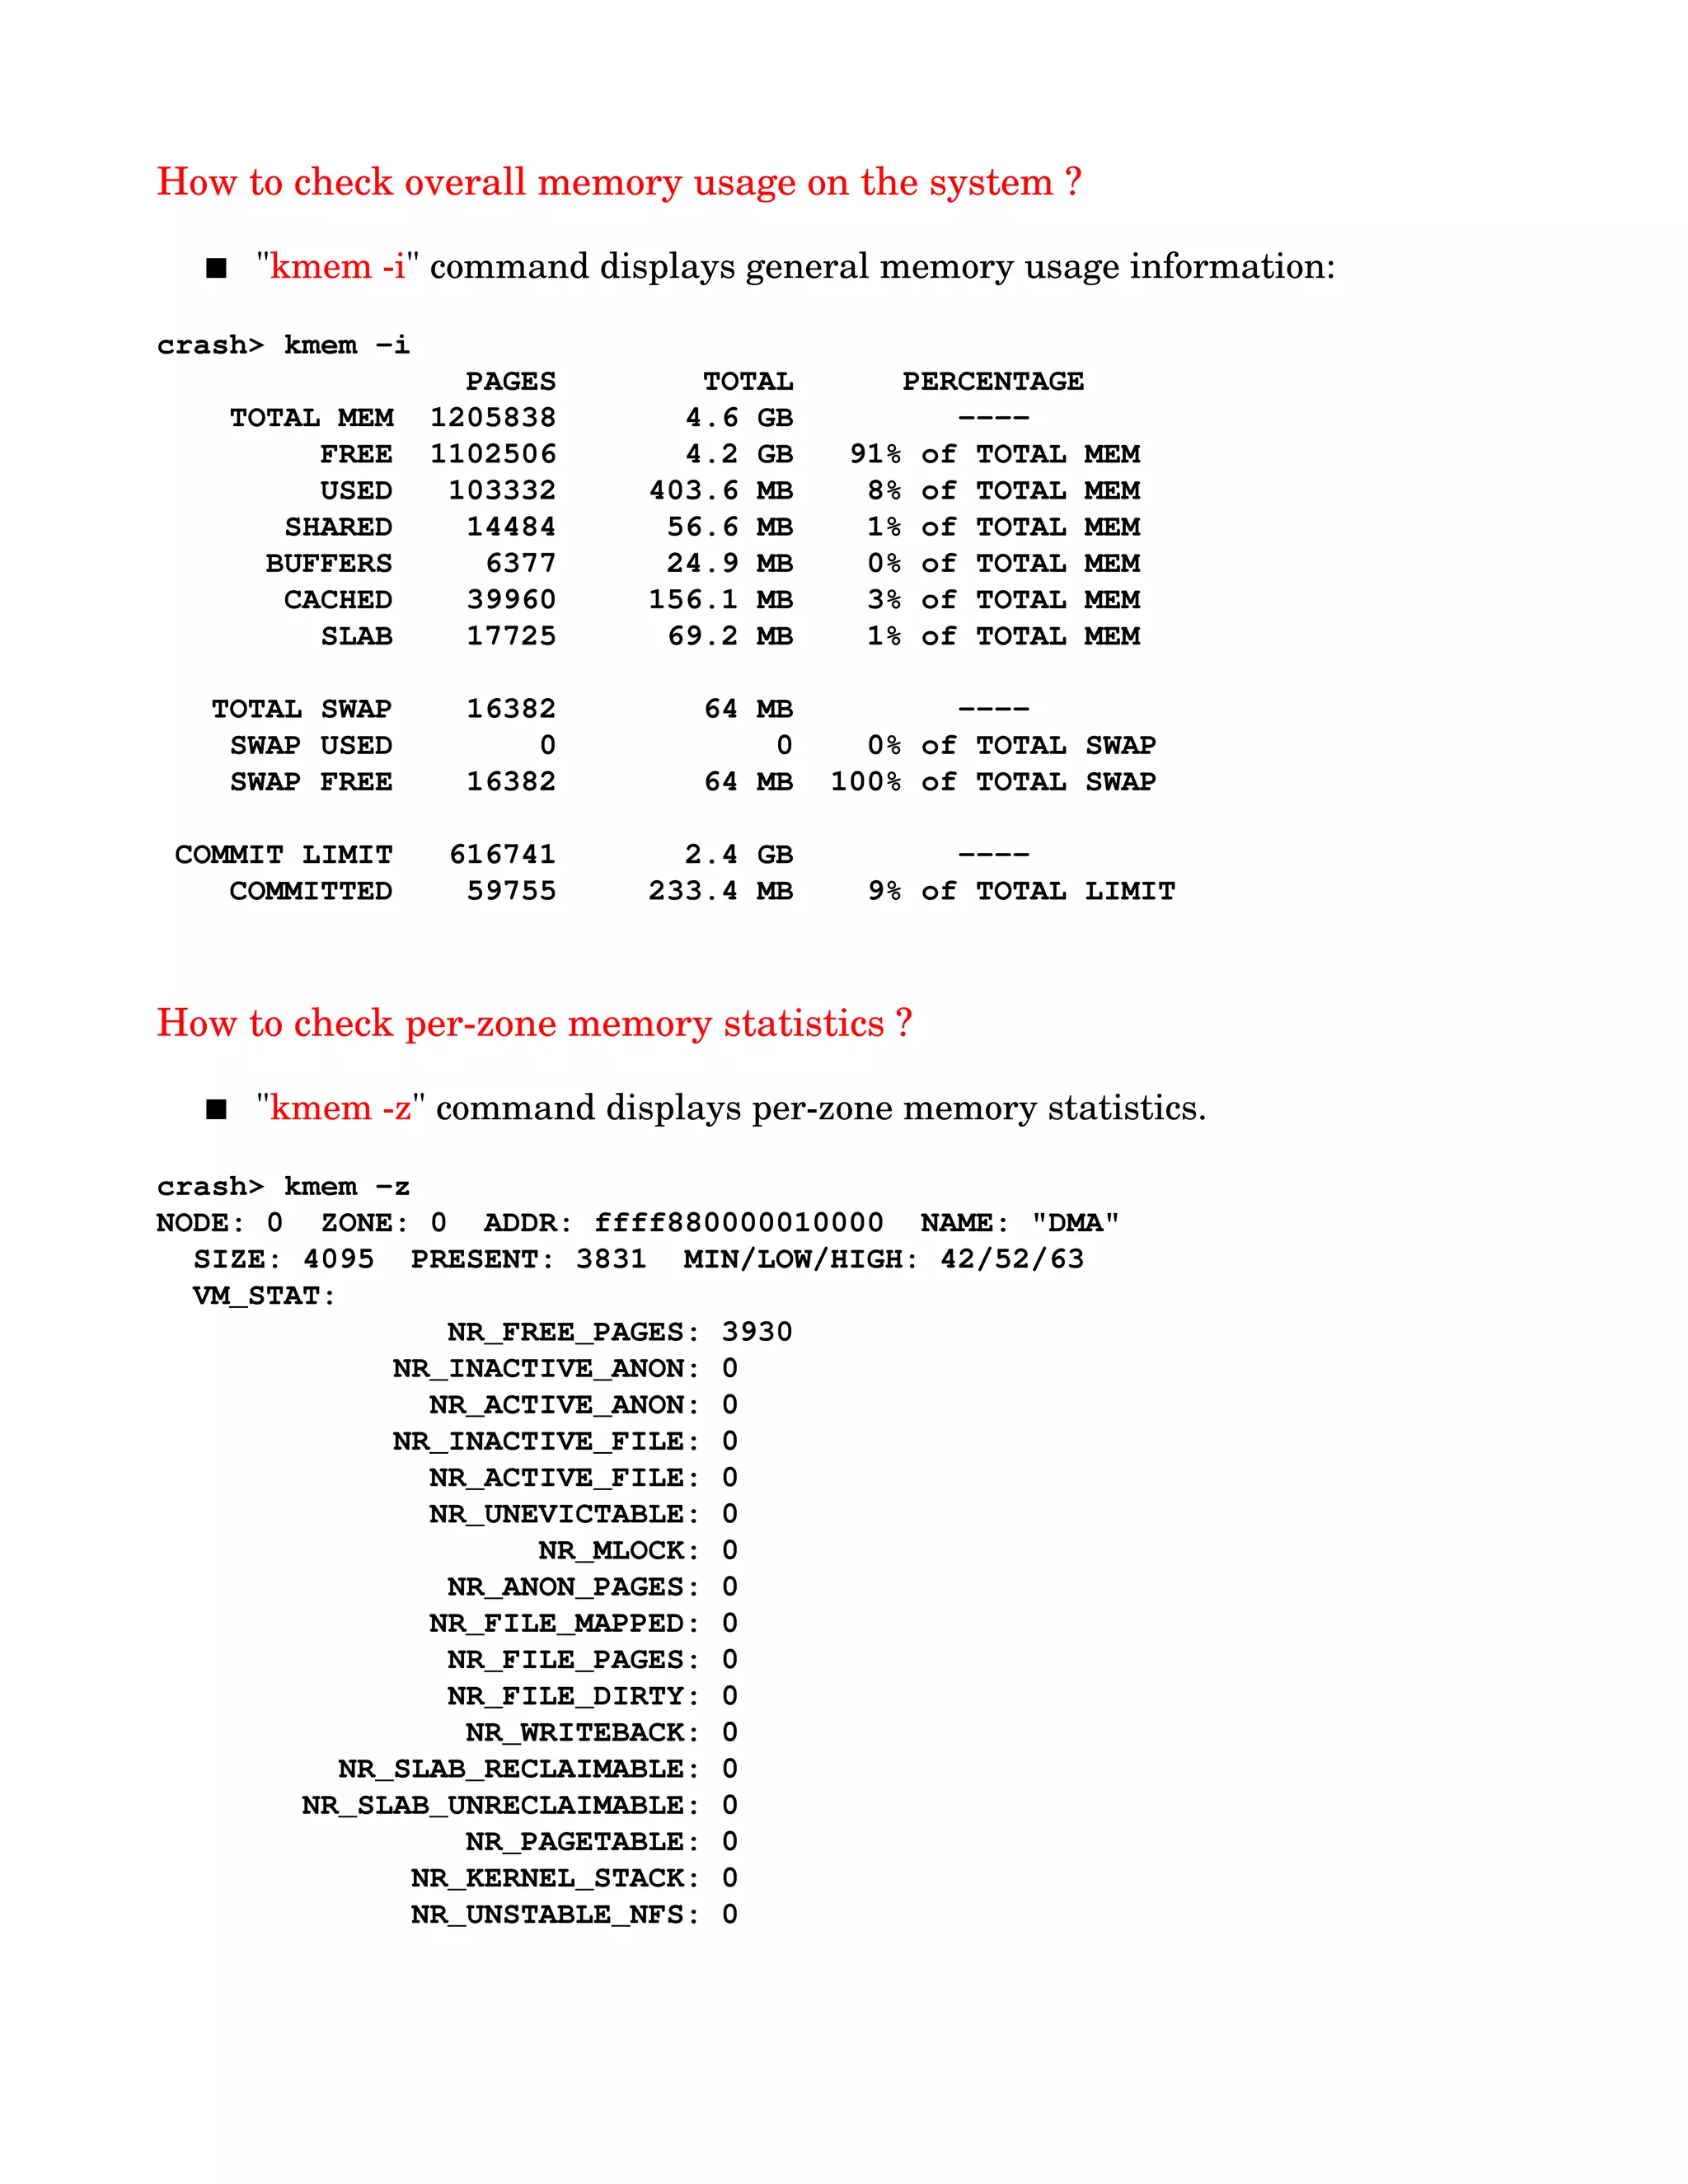
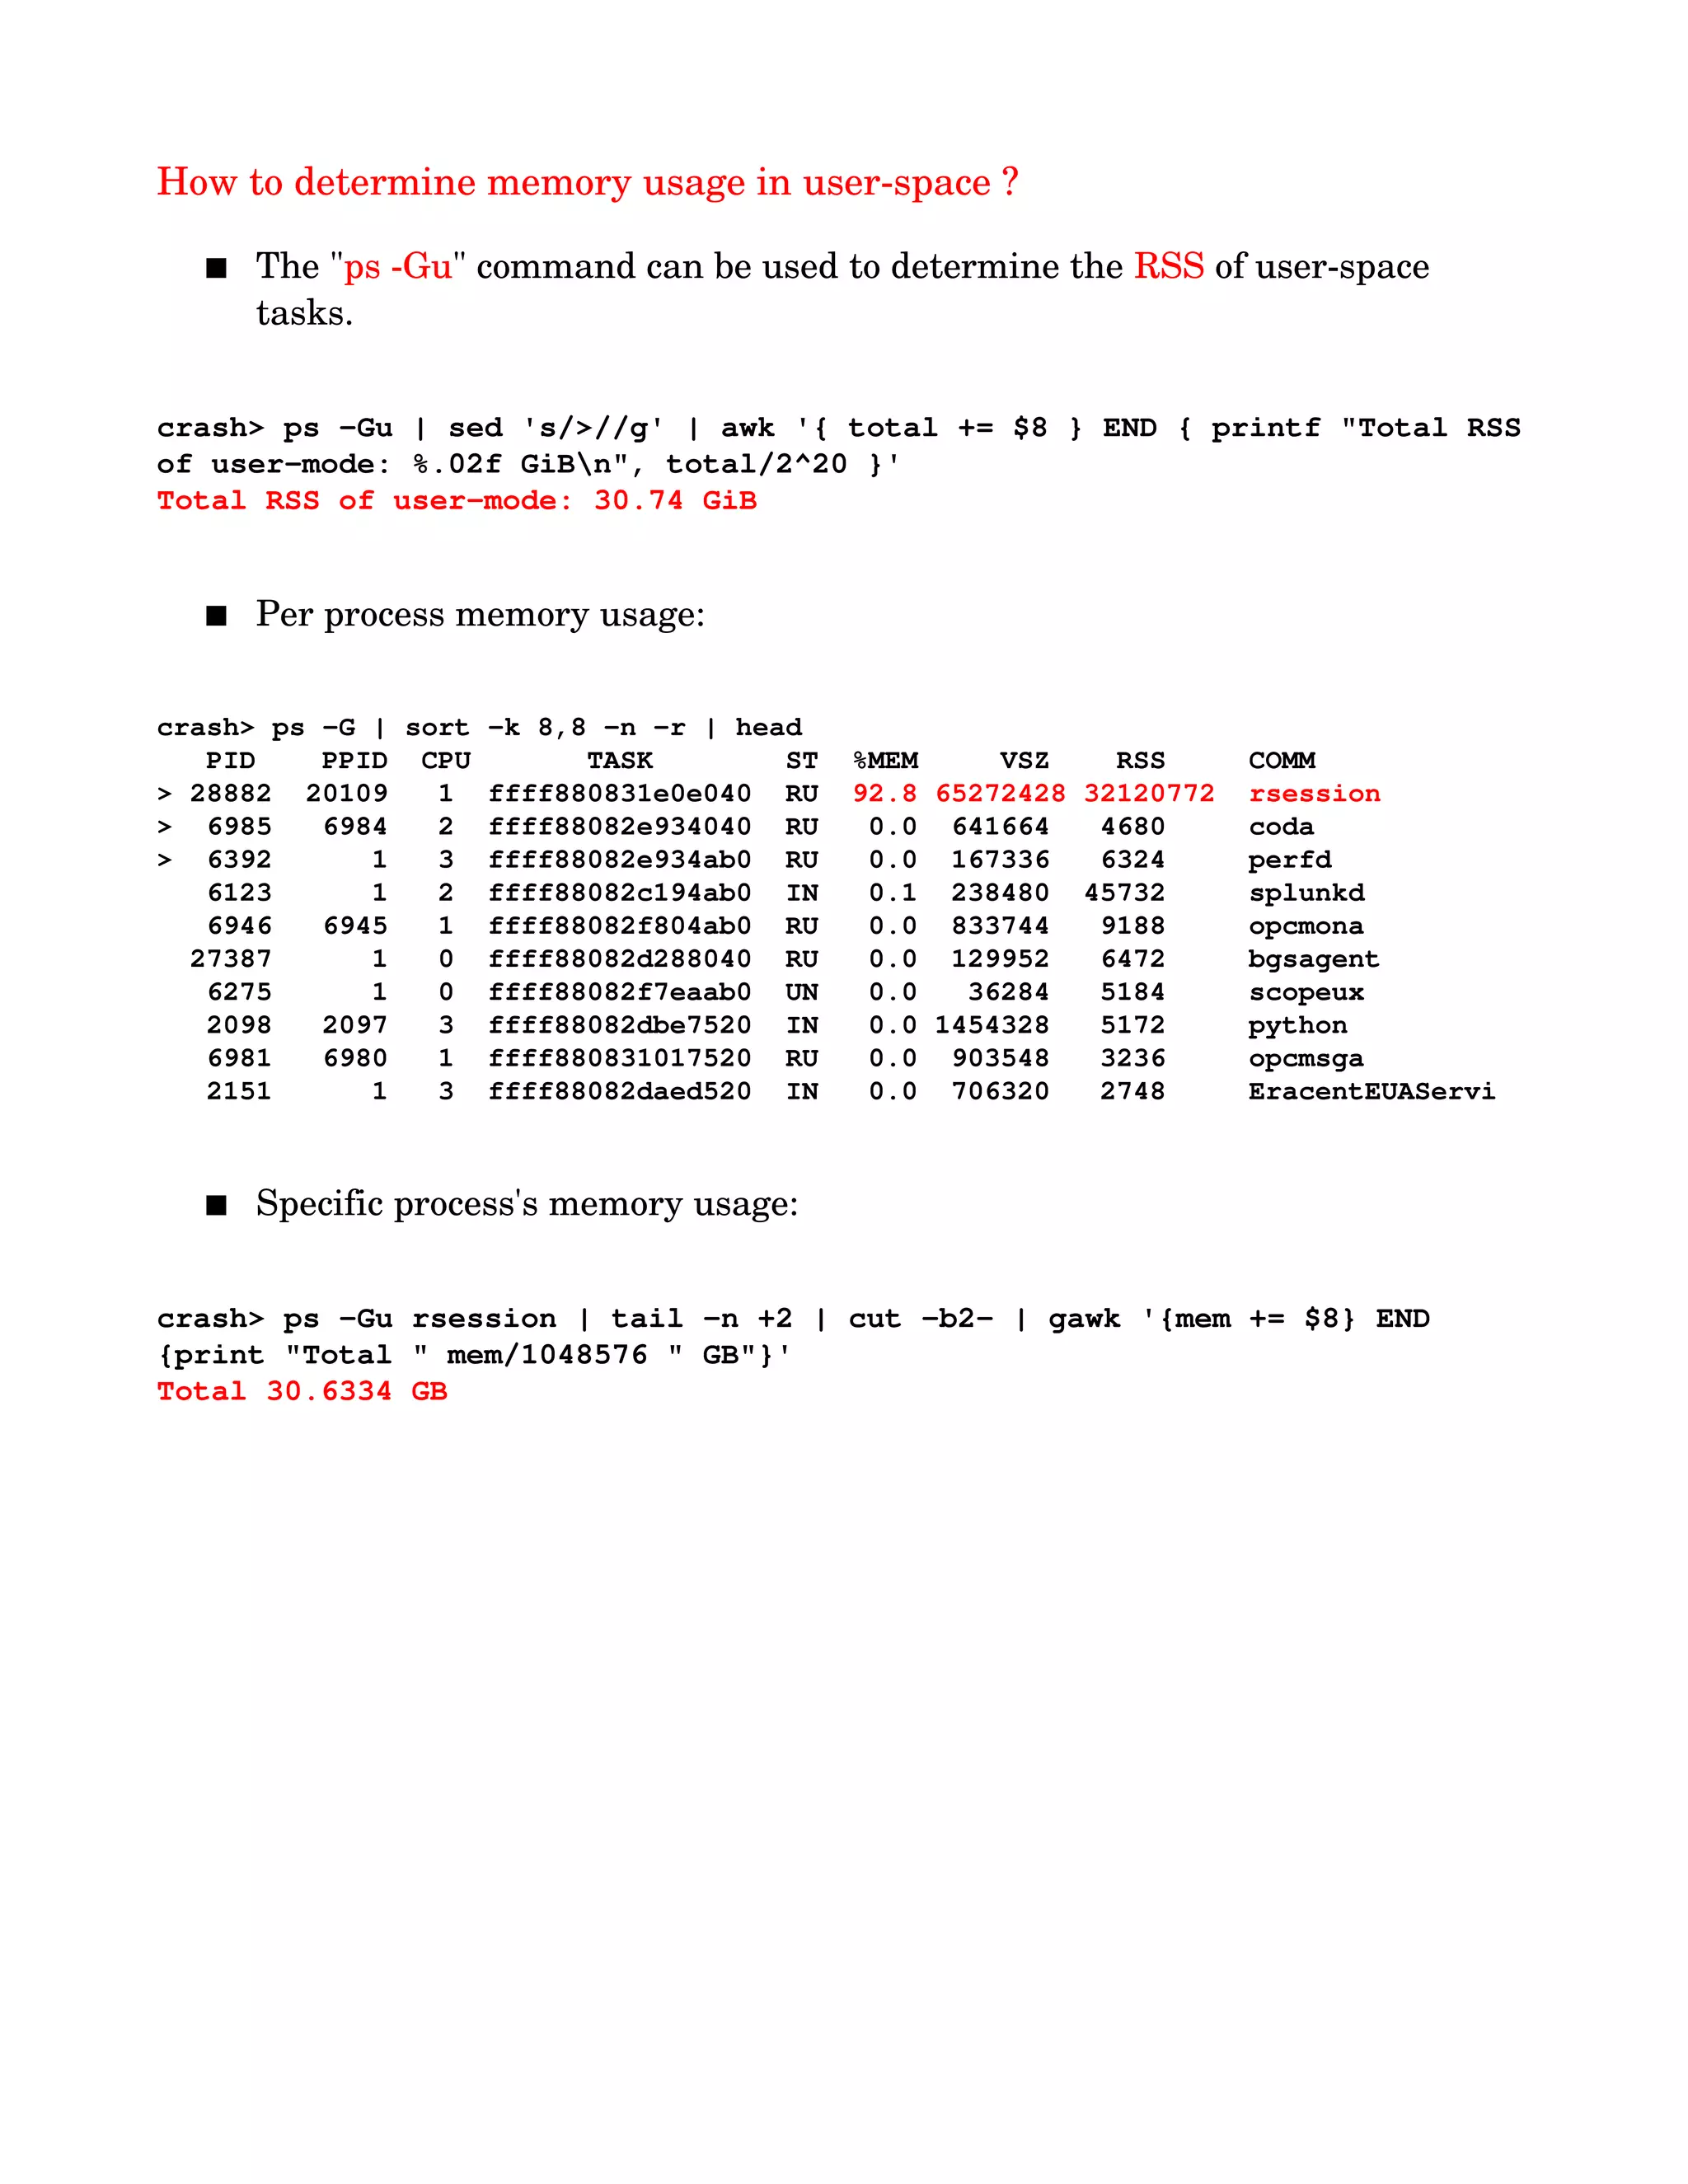
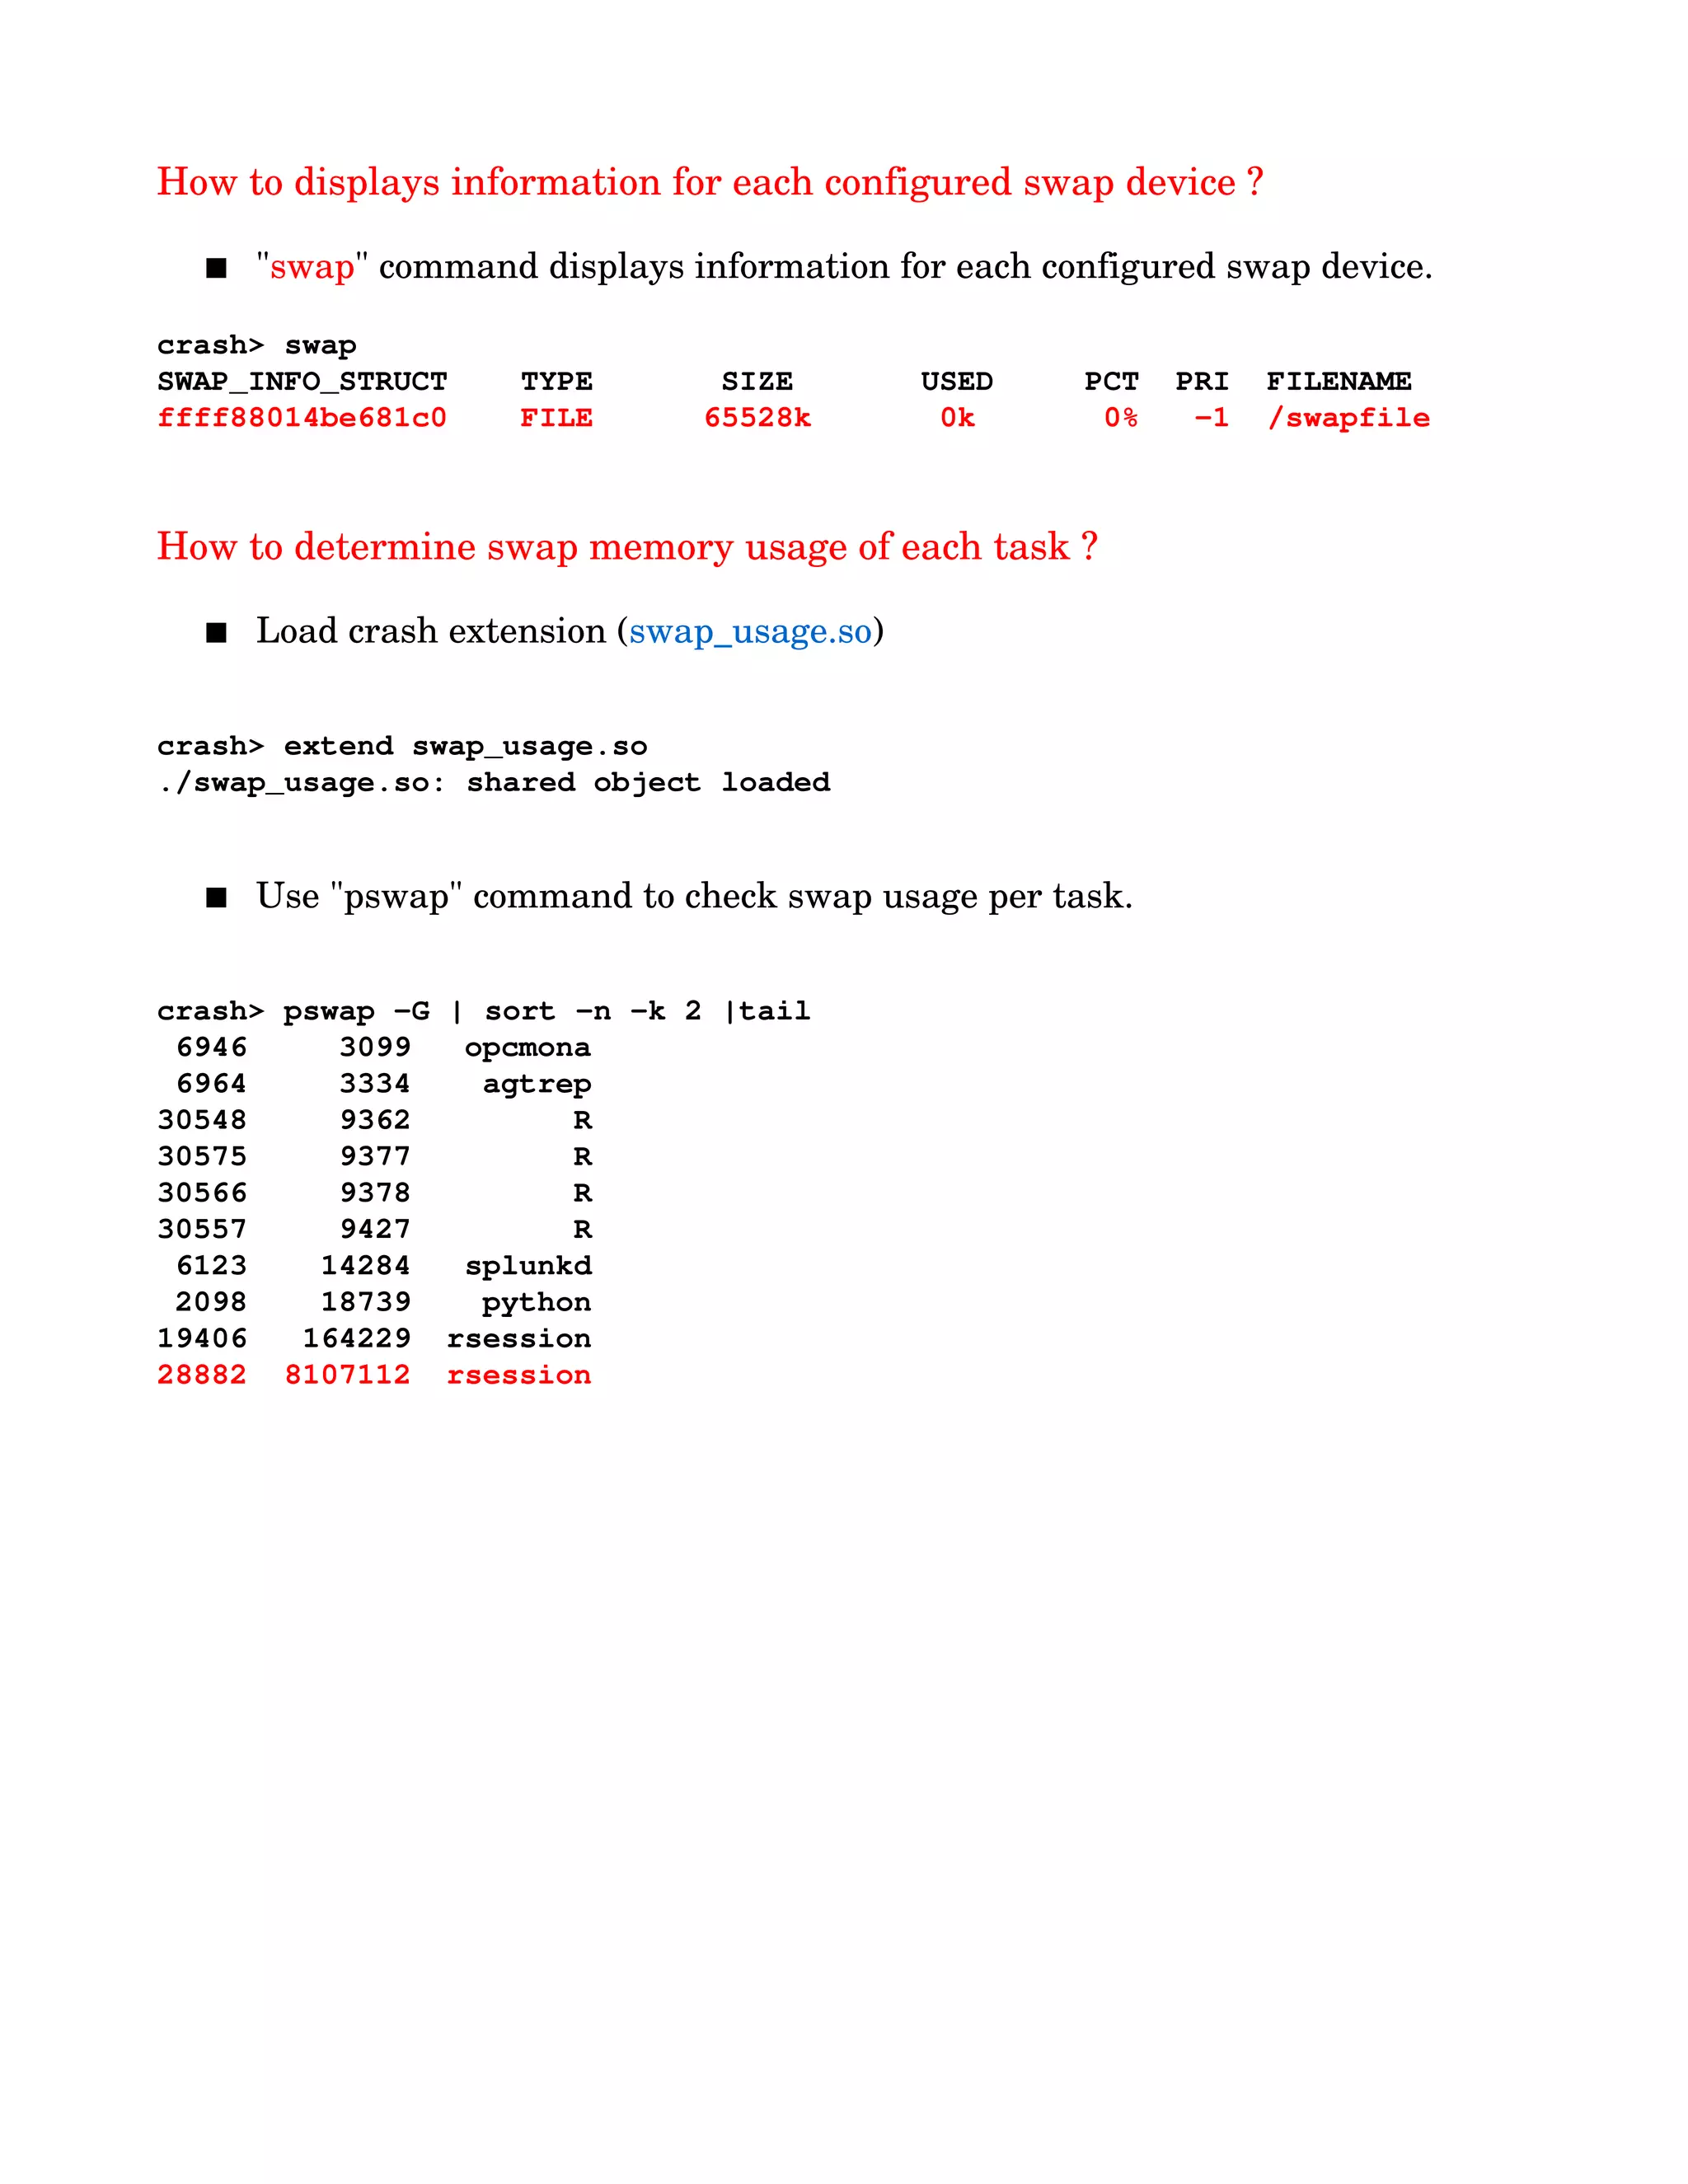
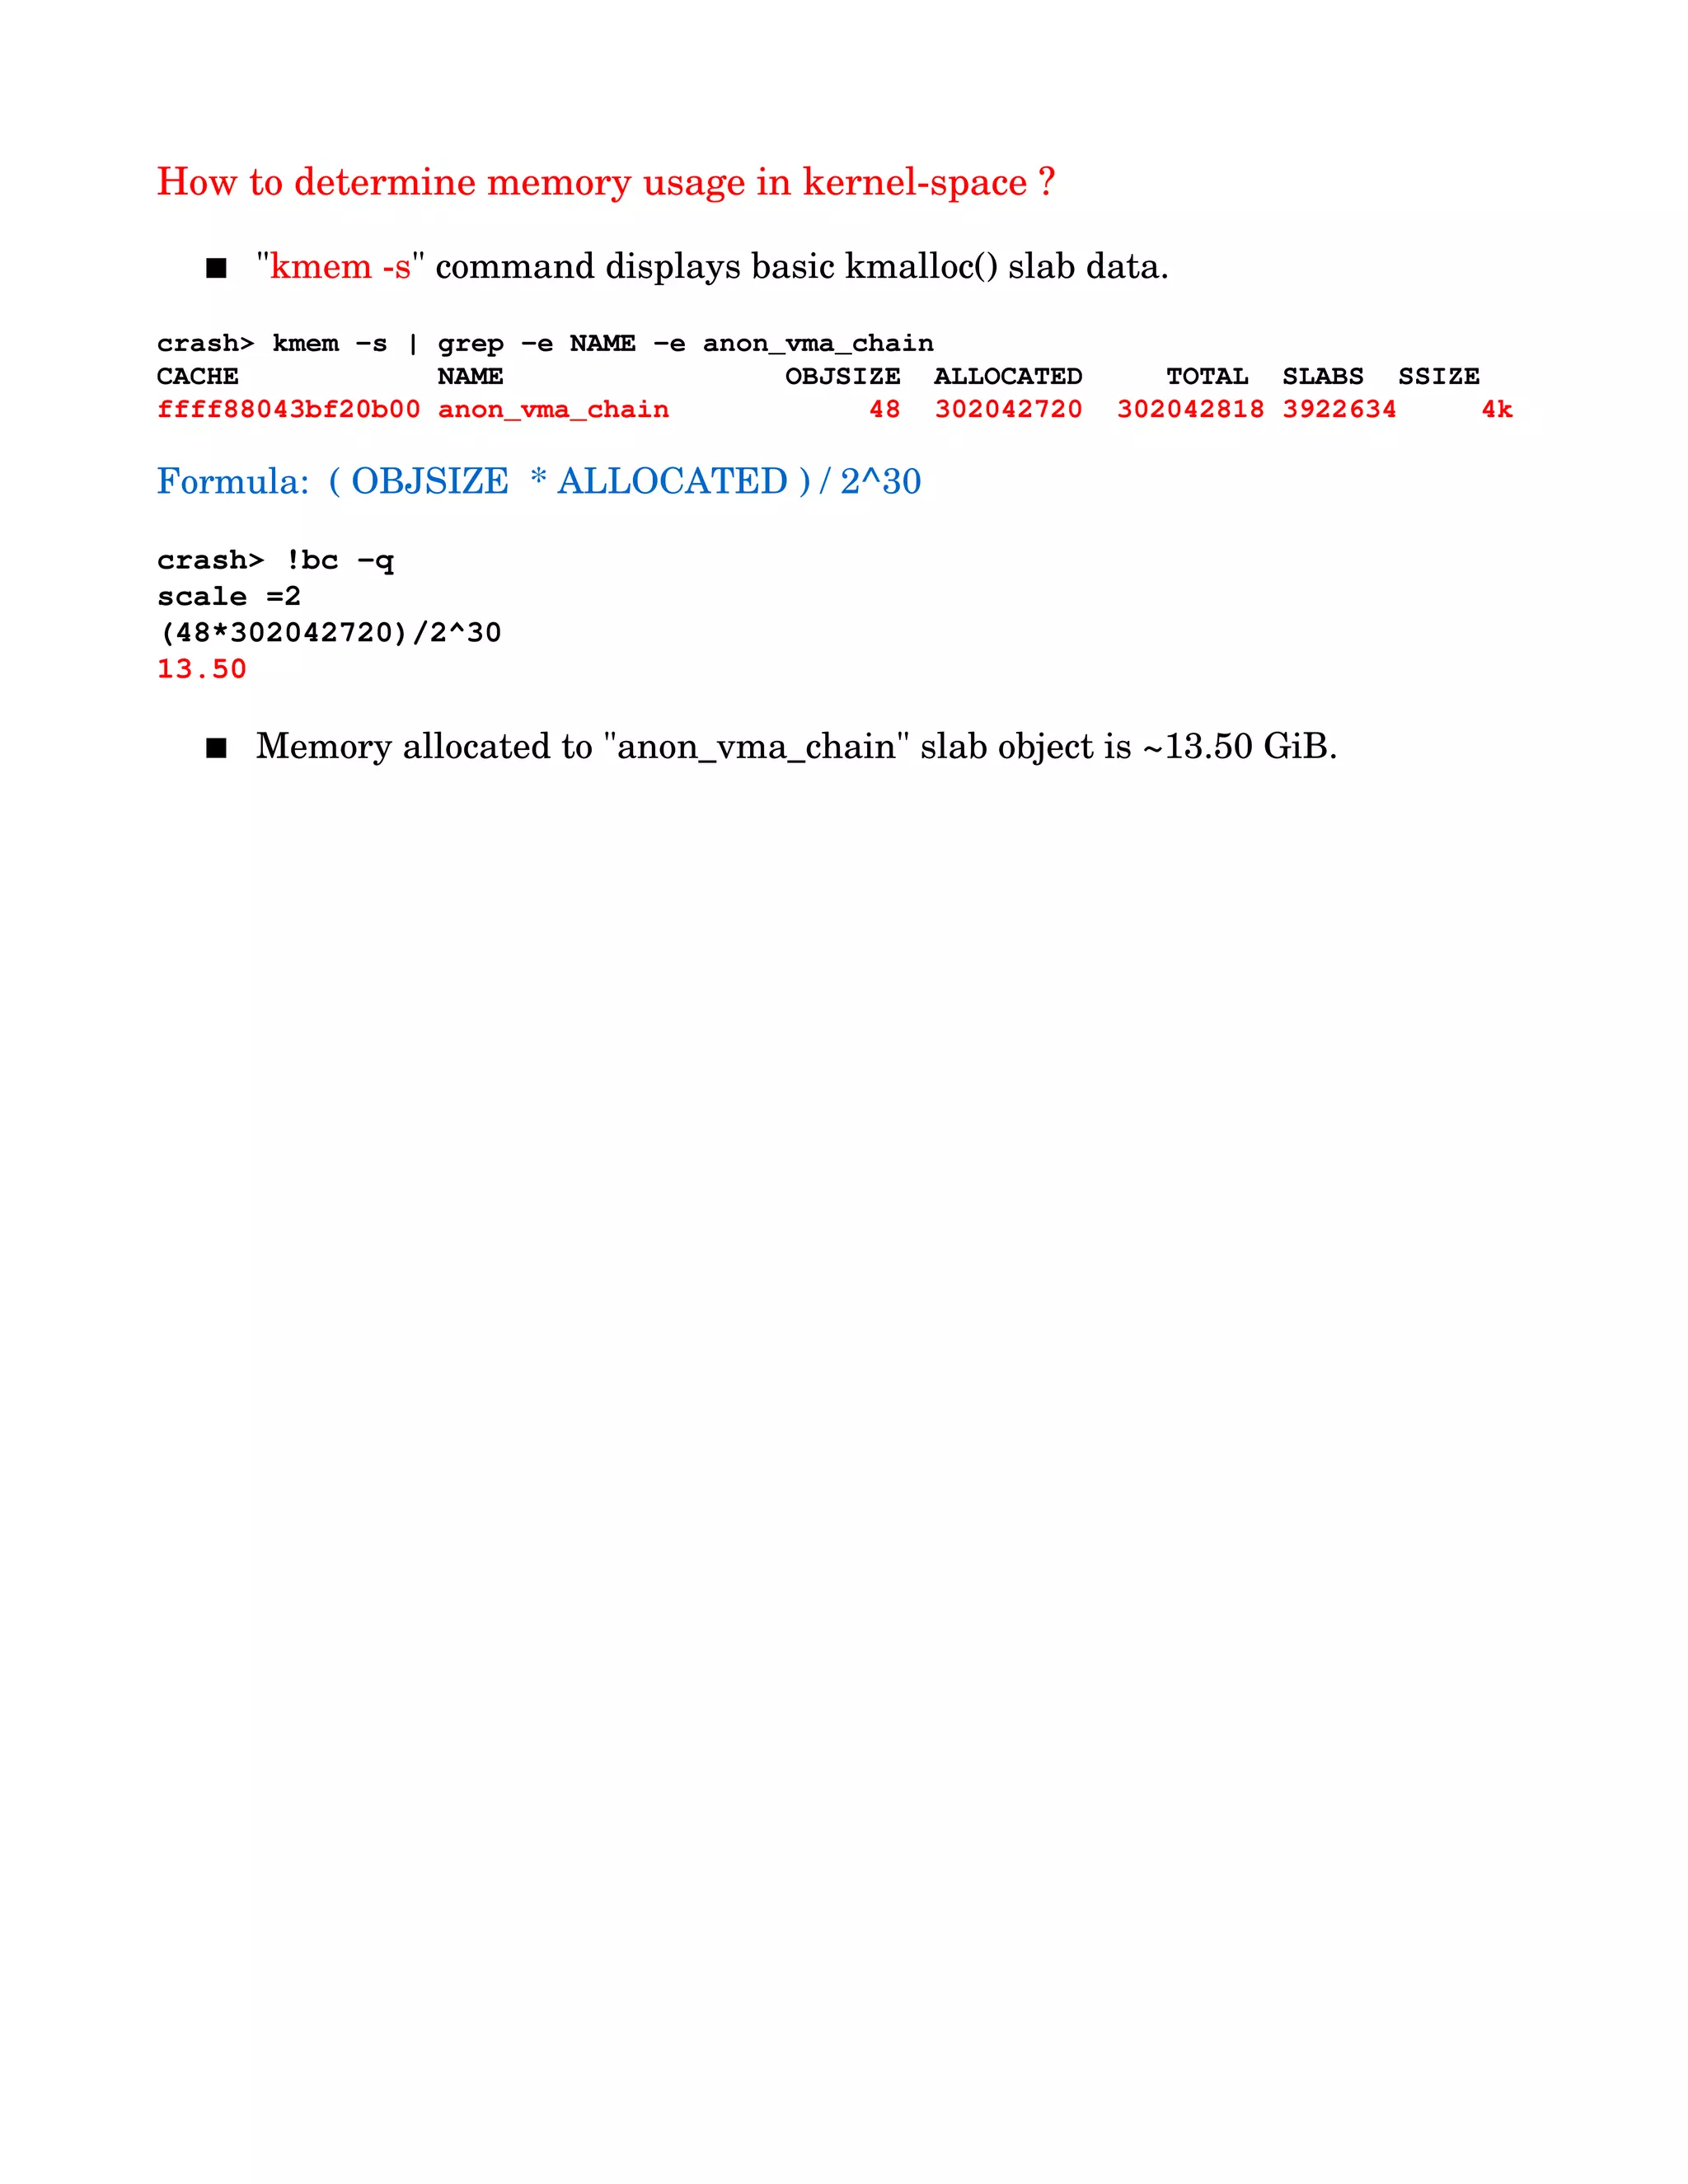
Techniques for assessing memory usage in kernel and user space, including checks for total tasks, memory allocated, and swap device usage.
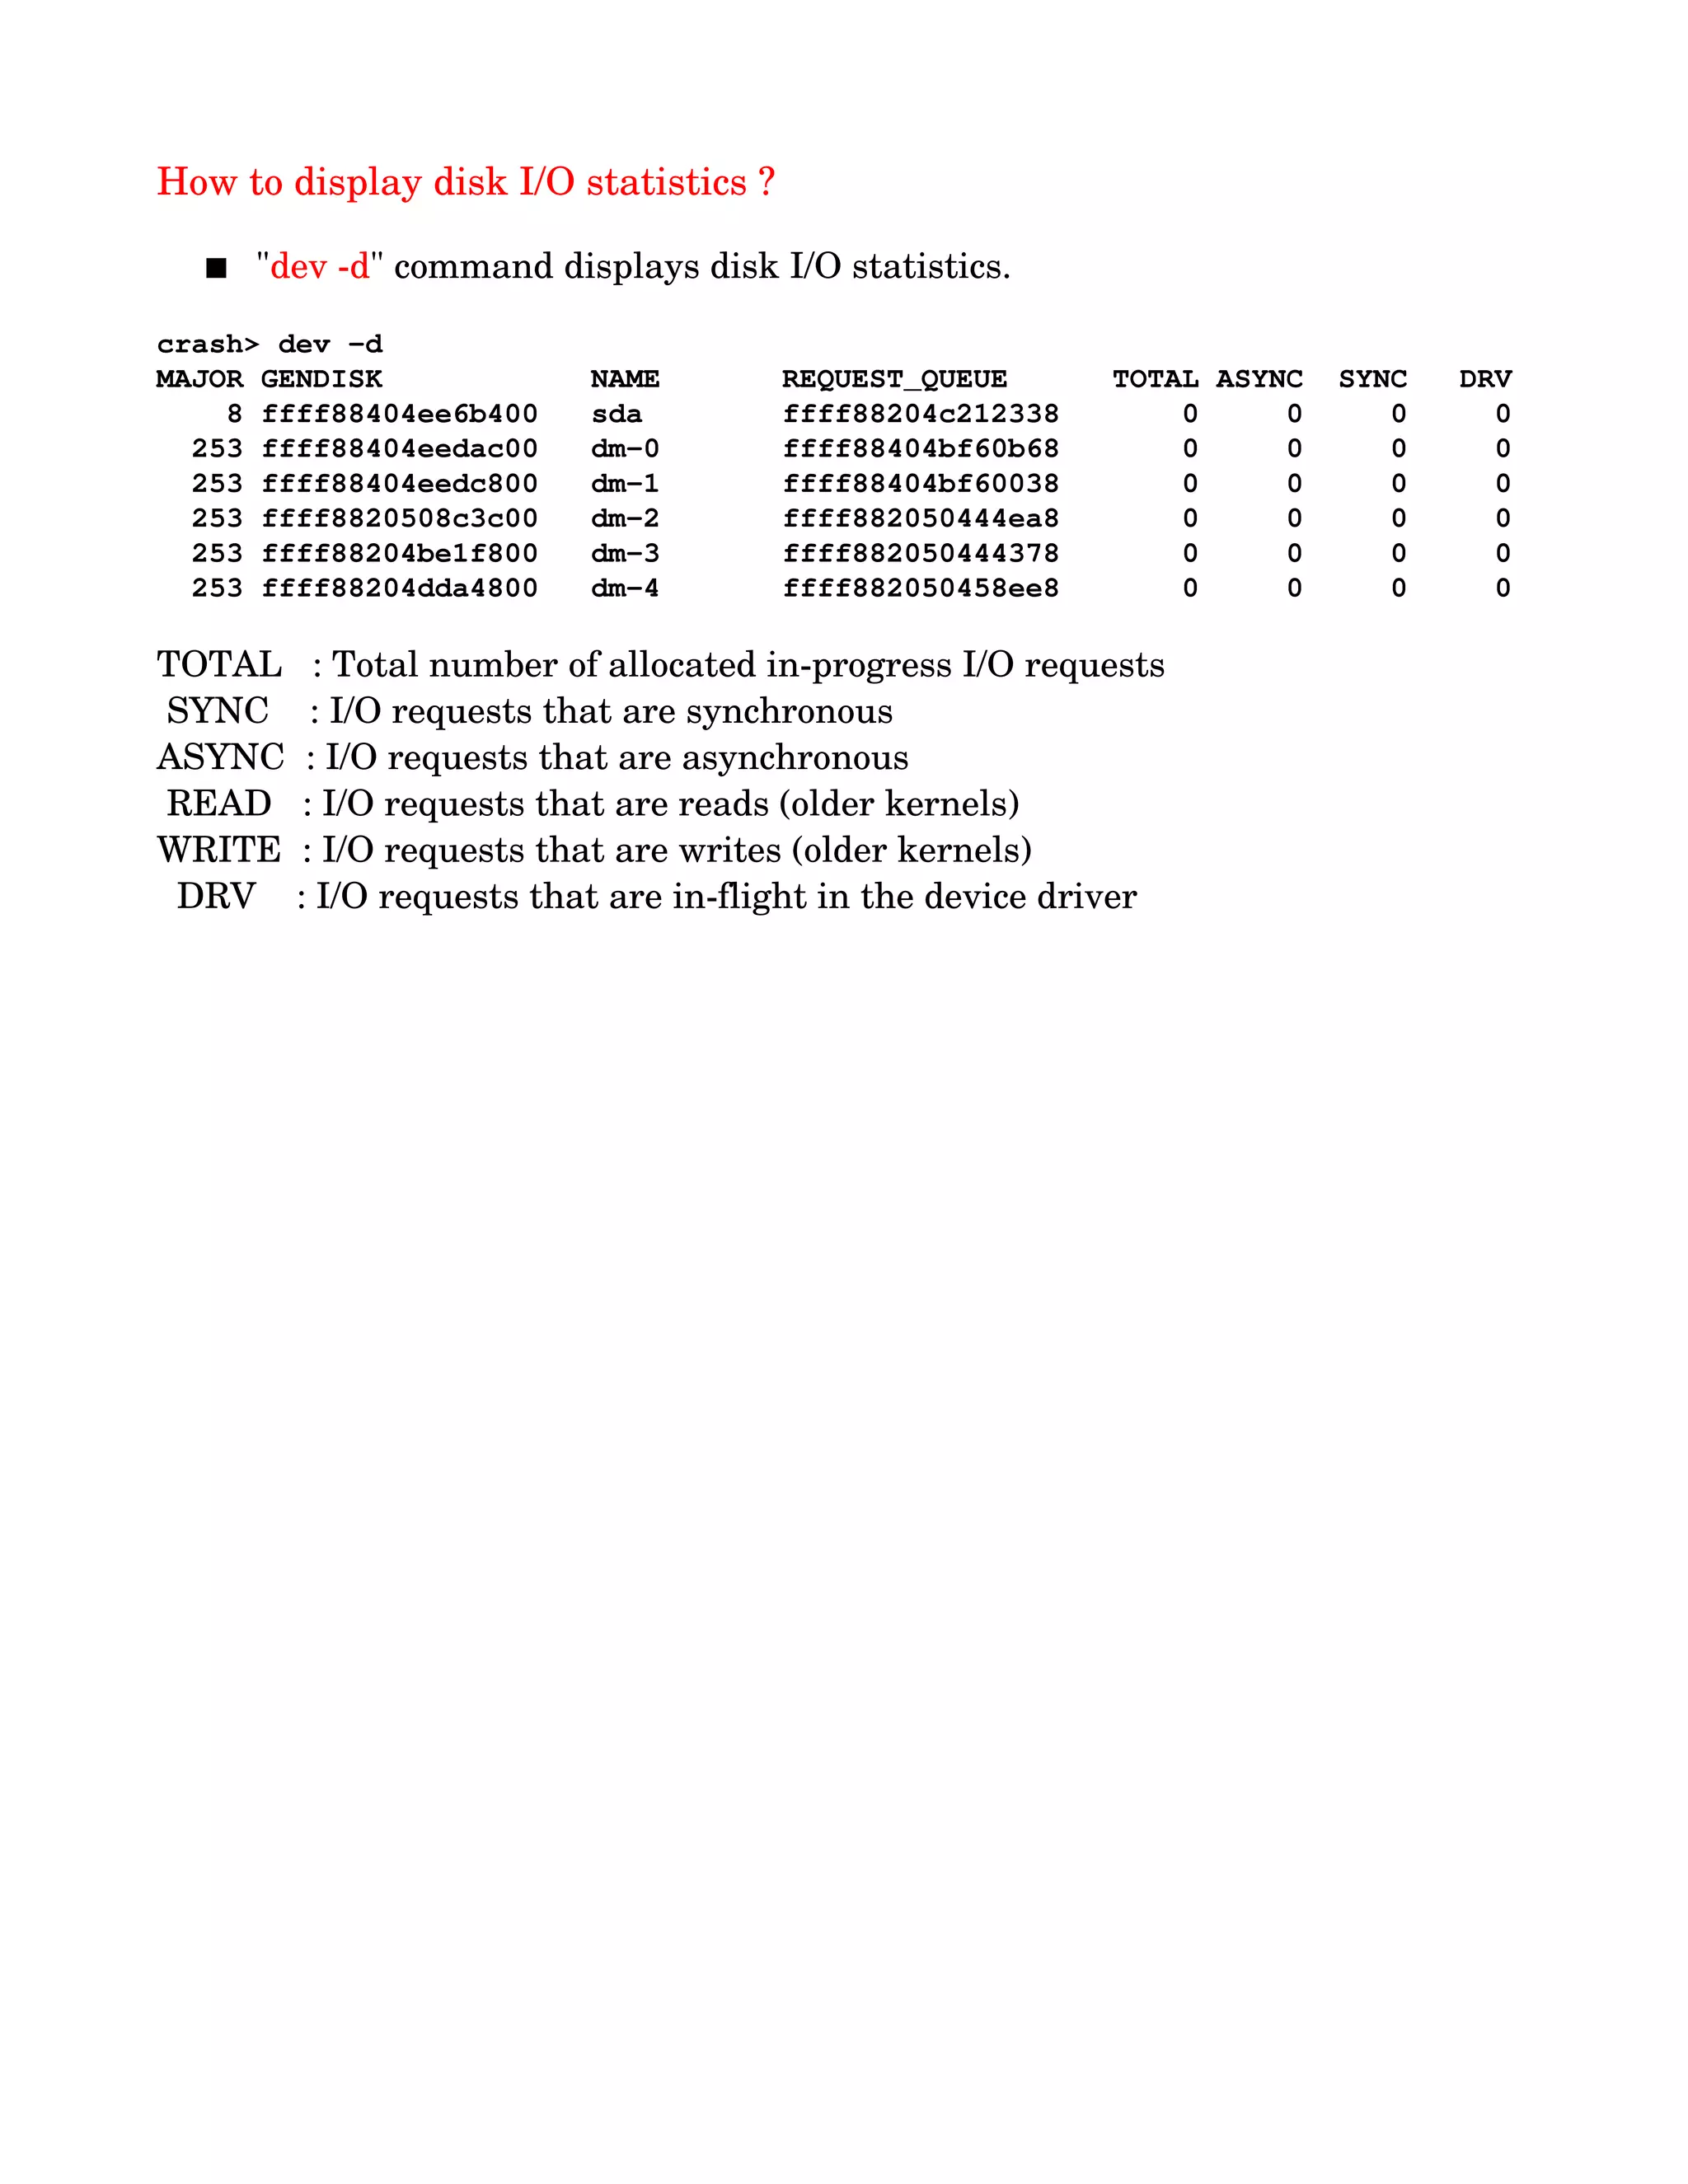
Display disk I/O statistics, check disk status and determine I/O scheduler settings relevant to storage.
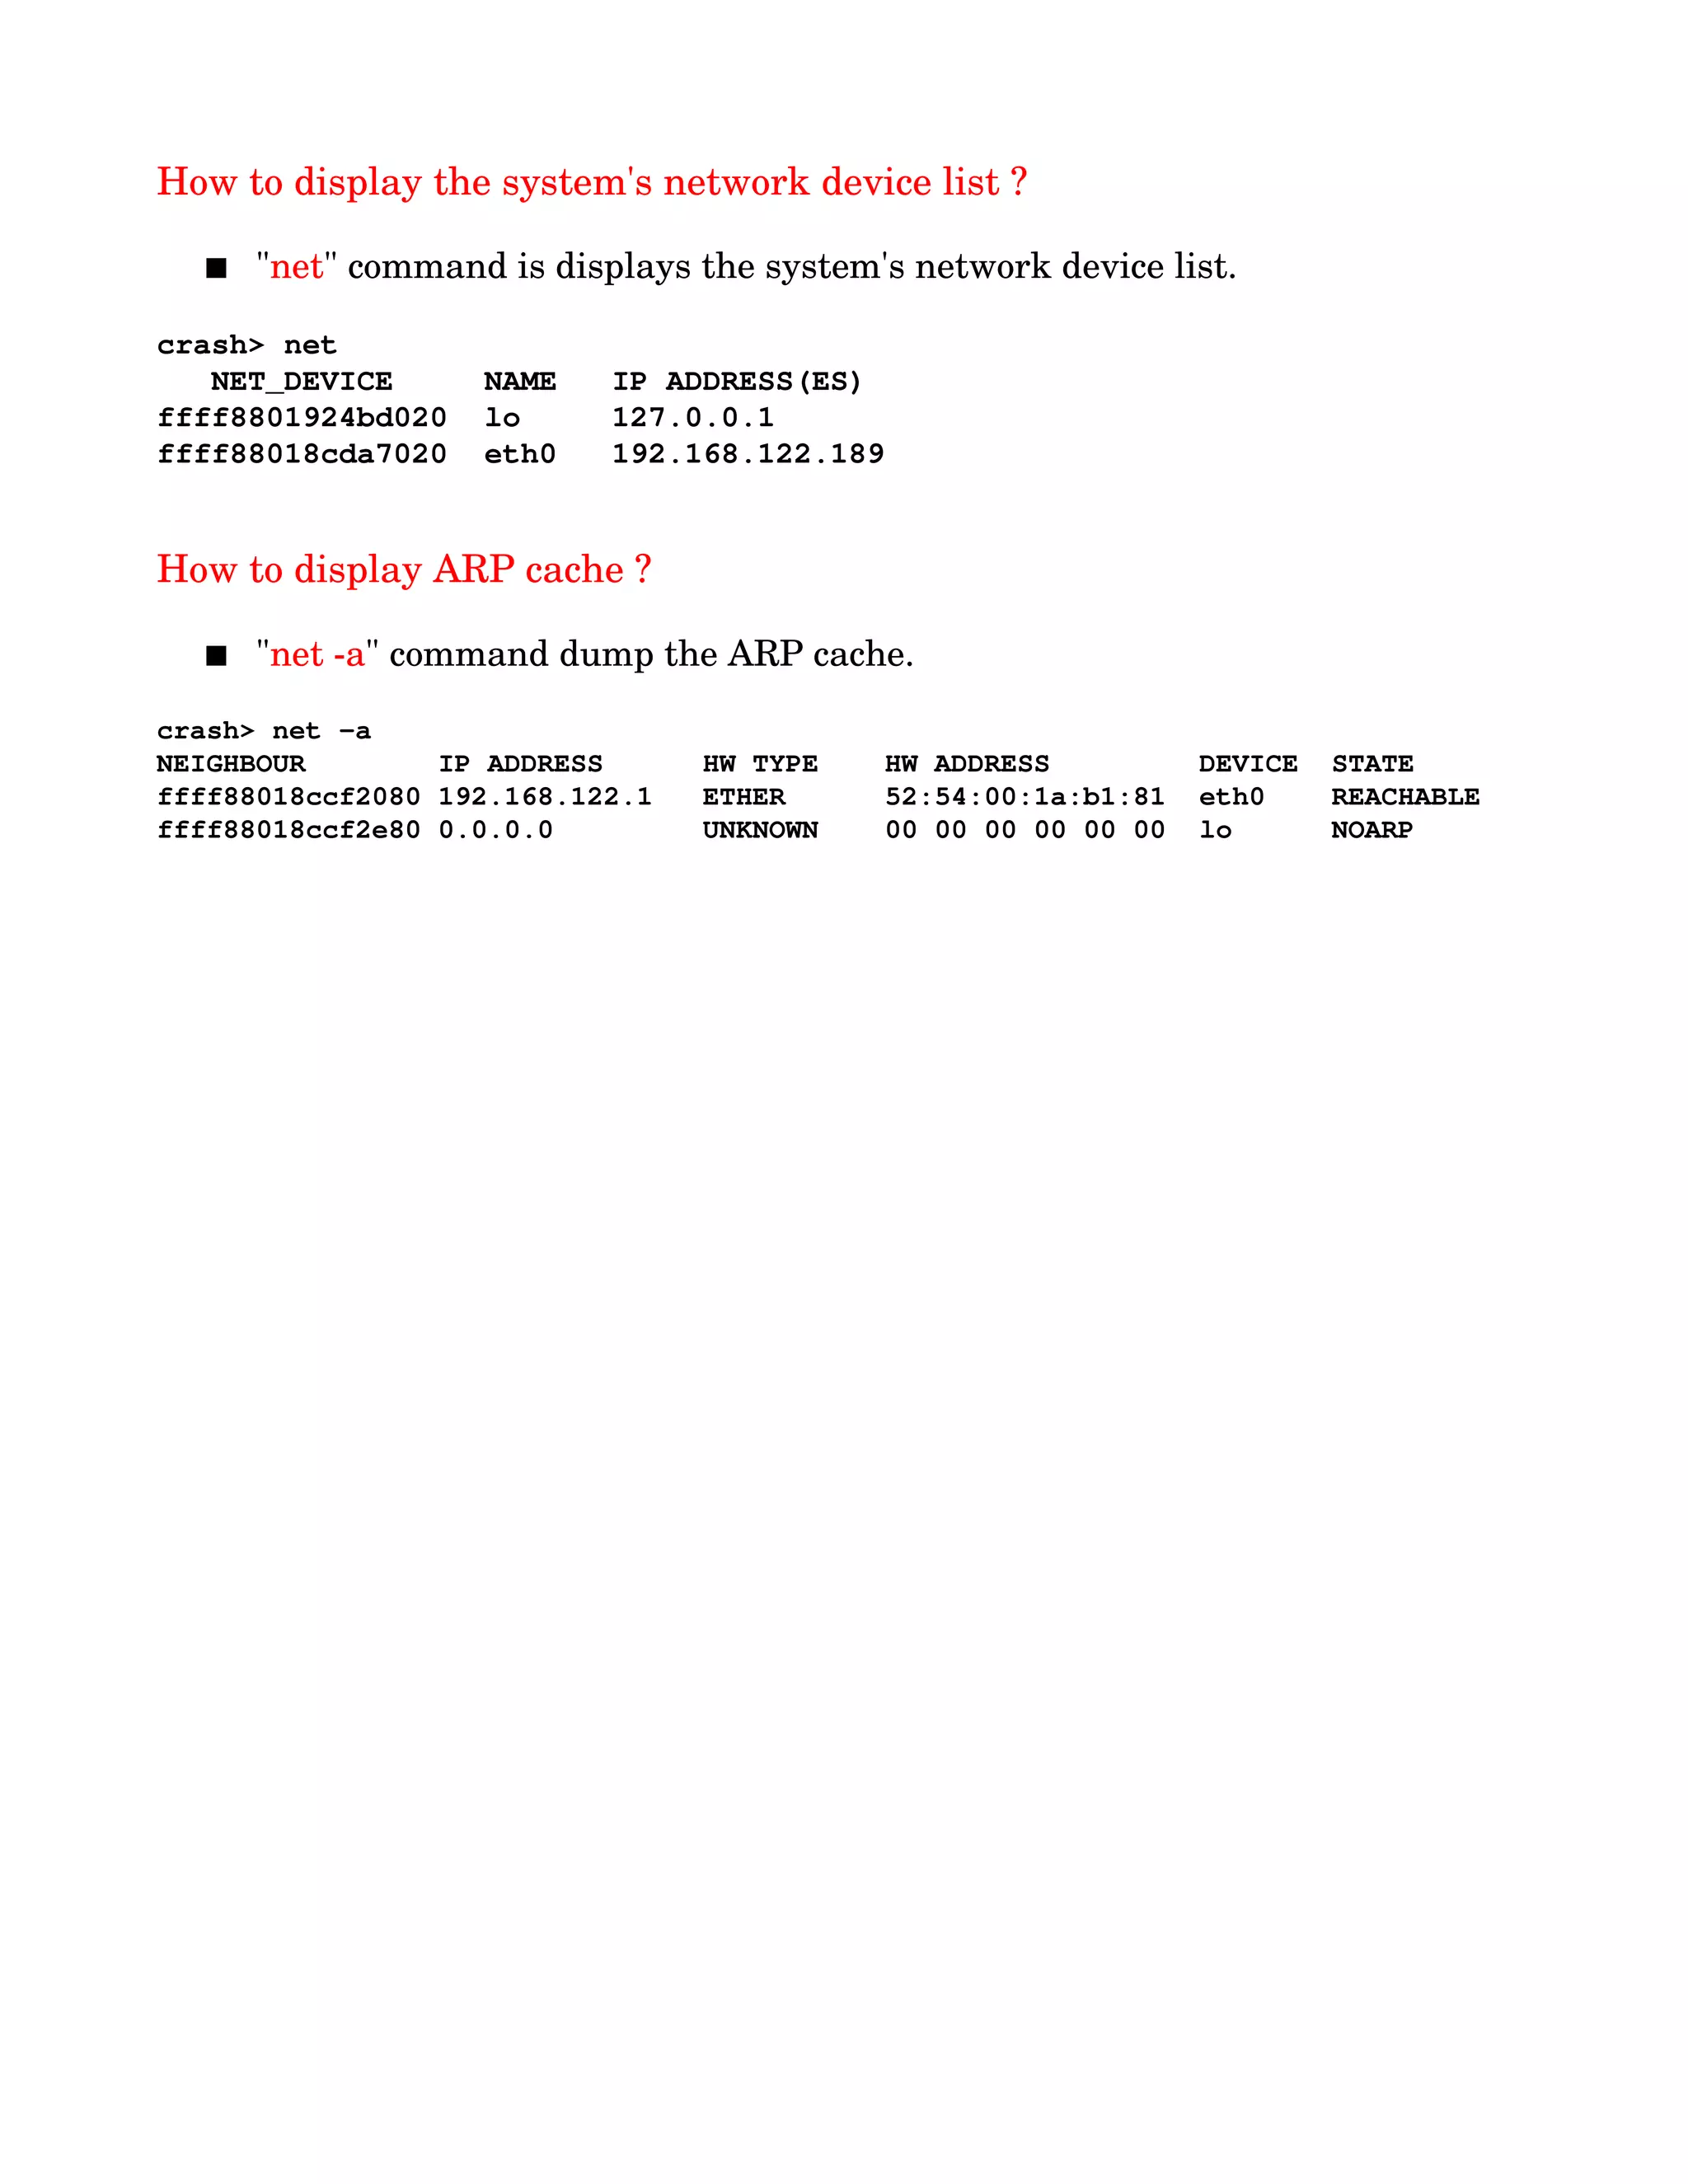
Analyzing network devices, ARP cache, using commands to extract network statistics and connection info.
Final slide opening the floor for questions about kernel crash dump analysis.