Download as PDF, PPTX


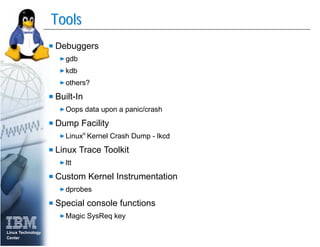

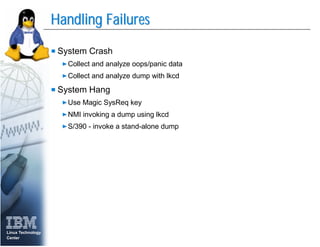
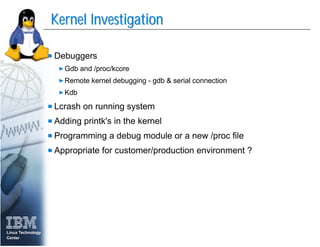
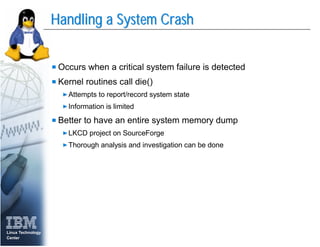
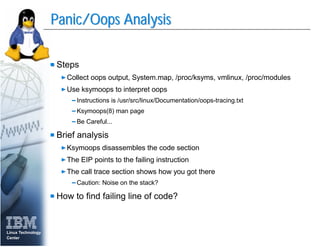
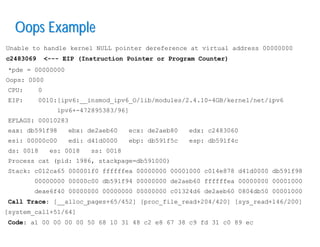
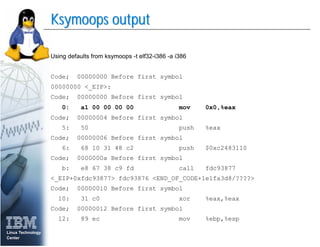
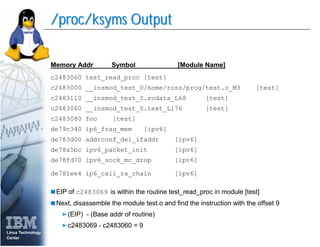
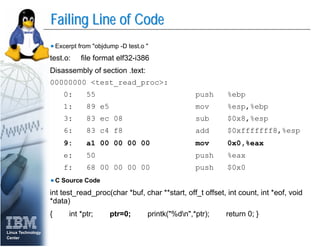
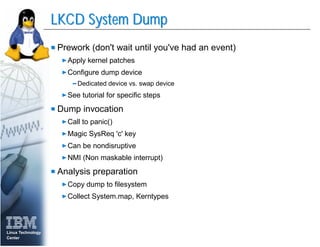
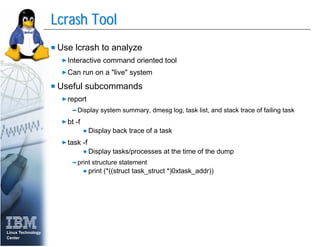
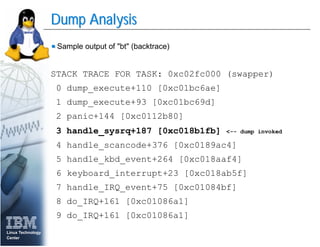
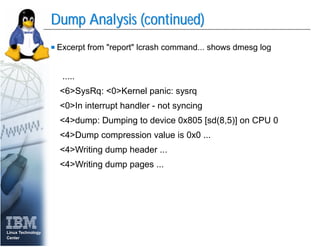
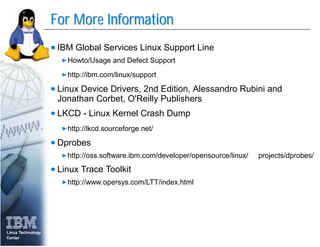
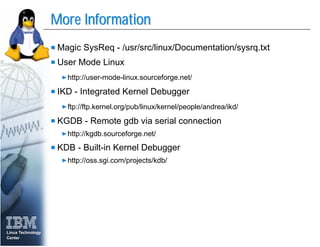

This document discusses tools and techniques for debugging the Linux kernel, including debuggers like gdb, built-in debugging facilities, system logs, and crash dump analysis tools like LKCD. It outlines common issues like kernel crashes and hangs, and provides an example of analyzing an "oops" crash dump to identify the failing line of code through tools like ksymoops. It also covers generating a full system memory dump using LKCD for thorough crash investigation.


![[CCC-28c3] Post Memory Corruption Memory Analysis](https://cdn.slidesharecdn.com/ss_thumbnails/28c3-120107122834-phpapp02-thumbnail.jpg?width=640&height=640&fit=bounds)

![[Ruxcon 2011] Post Memory Corruption Memory Analysis](https://cdn.slidesharecdn.com/ss_thumbnails/ruxcon-111127233040-phpapp02-thumbnail.jpg?width=640&height=640&fit=bounds)


![[Kiwicon 2011] Post Memory Corruption Memory Analysis](https://cdn.slidesharecdn.com/ss_thumbnails/kiwiconbrossard-111127232850-phpapp01-thumbnail.jpg?width=640&height=640&fit=bounds)


![Getting Started with Apache Spark: Big Data Made Simple [Free Meetup]](https://cdn.slidesharecdn.com/ss_thumbnails/apachesparkgettingstarted-260203175547-8361bcc3-thumbnail.jpg?width=640&height=640&fit=bounds)


