Download as ODP, PPTX


![Pstore
# cat dmesg-efi-4
cat /sys/fs/pstore/dmesg-efi-4
Panic#2 Part4
<1>[ 306.271891] IP: [<ffffffff813ba3e6>] sysrq_handle_crash+0x16/0x20
<4>[ 306.271917] PGD 80a98c067 PUD 807e8e067 PMD 0
<4>[ 306.271937] Oops: 0002 [#1] SMP
<4>[ 306.271952] Modules linked in:
tcp_lp rfcomm fuse xt_CHECKSUM nf_conntrack_netbios_ns
nf_conntrack_broadcast ipt_MASQUERADE ........
function that triggered the crash](https://image.slidesharecdn.com/crashdumps-161106235855/85/Linux-Kernel-Crashdump-10-320.jpg)


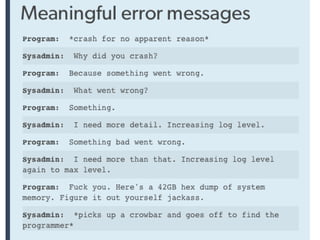
![Analyzing the crashed kernel
general protection fault: 0000 [#2] SMP
Modules linked in: module list here
CPU: 4 PID: 6839 Comm: iceweasel Tainted: G D 3.16-2-amd64 #1 Debian
3.16.3-2
Hardware name: Gigabyte 990FXA-UD5, BIOS FB 01/23/2013
task: ffff88009c063370 ti: ffff8801f7c94000 task.ti: ffff8801f7c94000
RIP: 0010:[<ffffffff811bcd08>] [<ffffffff811bcd08>]
__d_lookup_rcu+0xc8/0x160
RSP: 0018:ffff8801f7c97cb0 EFLAGS: 00010212
RAX: 0000000000000015 RBX: ffff8800984a2b60 RCX: 000000000000000c
RDX: ffff0800984a2b90 RSI: ffff8801f7c97e10 RDI: 6461657262757065
RBP: ffff8800984a2cd8 R08: ffff88009c19308c R09: ffff88009c19308c
R10: 0000000000000015 R11: ffffffffffffffff R12: ffff8800984a2b58
R13: 00000015067b0bda R14: ffff8801f7c97e10 R15: ffff8801f7c97d0c
FS: 00007f4f52f7d740(0000) GS:ffff88023fd00000(0000)
knlGS:00000000f55ffb40
CS: 0010 DS: 0000 ES: 0000 CR0: 0000000080050033
CR2: 00007f4f37200018 CR3: 0000000206380000 CR4: 00000000000007e0](https://image.slidesharecdn.com/crashdumps-161106235855/85/Linux-Kernel-Crashdump-16-320.jpg)
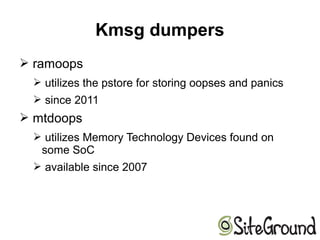
![Analyzing the crashed kernelStack:
ffff88009c063370 ffff8801f4e60c10 ffff88009c063370 ffff8801f7c97d78
ffff8801f7c97d68 0000000000000041 ffff8802356b80a0 ffff8800984a2cd8
ffff8801f7c97e00 ffffffff811aedde 02ffff8000000000 0000000200000000
Call Trace:
[<ffffffff811aedde>] ? lookup_fast+0x3e/0x2b0
[<ffffffff811b0865>] ? path_lookupat+0x155/0x780
[<ffffffffa0536c8a>] ? jfs_readdir+0x1ba/0xf90 [jfs]
[<ffffffff811b0eb6>] ? filename_lookup+0x26/0xc0
[<ffffffff811b4fa4>] ? user_path_at_empty+0x54/0x90
[<ffffffff810e908e>] ? from_kgid_munged+0xe/0x20
[<ffffffff811a9f0a>] ? cp_new_stat+0x13a/0x160
[<ffffffff811a9ab6>] ? vfs_fstatat+0x46/0x90
[<ffffffff811a9f4a>] ? SYSC_newstat+0x1a/0x40
[<ffffffff8150c26d>] ? system_call_fast_compare_end+0x10/0x15
Code: 6b 18 75 cf 41 89 07 4d 89 c8 48 8b 53 20 44 89 d0 eb 12 48 39 fe 75 bb 48 83
c2 08 49 83 c0 08 83 e8 08 74 26 49 8b 38 83 f8 07 <48> 8b 32 77 e3 8d 0c c5 00 00
00 00 4c 89 d8 48 31 fe 48 d3 e0
RIP [<ffffffff811bcd08>] __d_lookup_rcu+0xc8/0x160
RSP <ffff8801f7c97cb0>
---[ end trace d7e9304af4a09ee6 ]---](https://image.slidesharecdn.com/crashdumps-161106235855/85/Linux-Kernel-Crashdump-17-320.jpg)


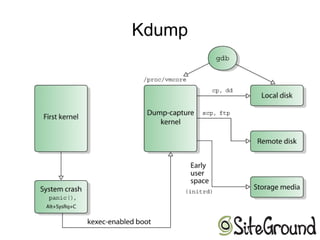
![Analyzing the crashed kernel
RIP: 0010:[<ffffffff9bd376d0>] [<ffffffff9bd376d0>] __list_del_entry+0x0/0xb0
RSP: 0018:ffff88002a4e3d20 EFLAGS: 00010006
RAX: dead000000000100 RBX: dead000000000100 RCX: 0000000000000001
RDX: 0000000000000101 RSI: 0000000000000001 RDI: dead000000000100
RBP: ffff88006a6e6028 R08: 0000000000000101 R09: 0000000000000000
R10: 0000000000000000 R11: 0000000000000000 R12: ffff88006a6e6008
R13: 0000000000000246 R14: deacffffffffff18 R15: ffff880036a22098
FS: 00007f2970ff9700(0000) GS:ffff88006fa00000(0000) knlGS:0000000000000000
CS: 0010 DS: 0000 ES: 0000 CR0: 0000000080050033
CR2: 00007efdc457c000 CR3: 0000000069a27000 CR4: 00000000000006f0](https://image.slidesharecdn.com/crashdumps-161106235855/85/Linux-Kernel-Crashdump-25-320.jpg)

![Analyzing the crashed kernel
[4005105.249407] Kernel panic - not syncing: Hard LOCKUP
[4005105.249409] CPU: 16 PID: 18891 Comm: kworker/u96:0 Tainted: G O 4.4.14-clouder2 #1
[4005105.249411] Workqueue: ipoib_wq ipoib_mcast_join_task [ib_ipoib]
[4005105.249412] 0000000000000000 ffff883fff285b10 ffffffff812f4269 ffffffff81a05545
[4005105.249414] ffff883fff285ba0 ffff883fff285b90 ffffffff8112738d ffffffff00000008
[4005105.249416] ffff883fff285ba0 ffff883fff285b38 0000000000000000 0000000000000046
[4005105.249417] Call Trace:
[4005105.249418] <NMI> [<ffffffff812f4269>] dump_stack+0x67/0x9e
[4005105.249422] [<ffffffff8112738d>] panic+0xc5/0x20b
[4005105.249424] [<ffffffff810e1dcd>] watchdog_overflow_callback+0xdd/0xe0
[4005105.249426] [<ffffffff8111f5f8>] __perf_event_overflow+0x88/0x250
[4005105.249427] [<ffffffff81120174>] perf_event_overflow+0x14/0x20
[4005105.249429] [<ffffffff8101e228>] intel_pmu_handle_irq+0x1c8/0x430
[4005105.249432] [<ffffffff81165bc6>] ? vunmap_page_range+0x1a6/0x310
[4005105.249434] [<ffffffff81165d41>] ? unmap_kernel_range_noflush+0x11/0x20
[4005105.249436] [<ffffffff81382ab8>] ? ghes_copy_tofrom_phys+0x118/0x1e0
[4005105.249437] [<ffffffff81034cff>] ? native_apic_wait_icr_idle+0x1f/0x30
[4005105.249439] [<ffffffff8100a275>] ? arch_irq_work_raise+0x35/0x40
[4005105.249441] [<ffffffff81016b48>] perf_event_nmi_handler+0x28/0x50
[4005105.249443] [<ffffffff81008efd>] nmi_handle+0x6d/0x140
[4005105.249445] [<ffffffff81009480>] default_do_nmi+0x40/0x100
[4005105.249446] [<ffffffff81009641>] do_nmi+0x101/0x150
[4005105.249447] [<ffffffff81616687>] end_repeat_nmi+0x1a/0x1e
[4005105.249450] [<ffffffffa02dd7fc>] ? ipoib_mcast_join_task+0x14c/0x330 [ib_ipoib]](https://image.slidesharecdn.com/crashdumps-161106235855/85/Linux-Kernel-Crashdump-27-320.jpg)
![Analyzing the crashed kernel
[4005105.249407] Kernel panic - not syncing: Hard LOCKUP
[4005105.249409] CPU: 16 PID: 18891 Comm: kworker/u96:0 Tainted: G O 4.4.14-clouder2 #1
[4005105.249411] Workqueue: ipoib_wq ipoib_mcast_join_task [ib_ipoib]
[4005105.249412] 0000000000000000 ffff883fff285b10 ffffffff812f4269 ffffffff81a05545
[4005105.249414] ffff883fff285ba0 ffff883fff285b90 ffffffff8112738d ffffffff00000008
[4005105.249416] ffff883fff285ba0 ffff883fff285b38 0000000000000000 0000000000000046
[4005105.249417] Call Trace:
[4005105.249418] <NMI> [<ffffffff812f4269>] dump_stack+0x67/0x9e
[4005105.249422] [<ffffffff8112738d>] panic+0xc5/0x20b
[4005105.249424] [<ffffffff810e1dcd>] watchdog_overflow_callback+0xdd/0xe0
[4005105.249426] [<ffffffff8111f5f8>] __perf_event_overflow+0x88/0x250
[4005105.249427] [<ffffffff81120174>] perf_event_overflow+0x14/0x20
[4005105.249429] [<ffffffff8101e228>] intel_pmu_handle_irq+0x1c8/0x430
[4005105.249432] [<ffffffff81165bc6>] ? vunmap_page_range+0x1a6/0x310
[4005105.249434] [<ffffffff81165d41>] ? unmap_kernel_range_noflush+0x11/0x20
[4005105.249436] [<ffffffff81382ab8>] ? ghes_copy_tofrom_phys+0x118/0x1e0
[4005105.249437] [<ffffffff81034cff>] ? native_apic_wait_icr_idle+0x1f/0x30
[4005105.249439] [<ffffffff8100a275>] ? arch_irq_work_raise+0x35/0x40
[4005105.249441] [<ffffffff81016b48>] perf_event_nmi_handler+0x28/0x50
[4005105.249443] [<ffffffff81008efd>] nmi_handle+0x6d/0x140
[4005105.249445] [<ffffffff81009480>] default_do_nmi+0x40/0x100
[4005105.249446] [<ffffffff81009641>] do_nmi+0x101/0x150
[4005105.249447] [<ffffffff81616687>] end_repeat_nmi+0x1a/0x1e
[4005105.249450] [<ffffffffa02dd7fc>] ? ipoib_mcast_join_task+0x14c/0x330 [ib_ipoib]](https://image.slidesharecdn.com/crashdumps-161106235855/85/Linux-Kernel-Crashdump-28-320.jpg)
![Analyzing the crashed kernel
[4005105.249417] Call Trace:
[4005105.249418] <NMI> [<ffffffff812f4269>] dump_stack+0x67/0x9e
[4005105.249422] [<ffffffff8112738d>] panic+0xc5/0x20b
[4005105.249424] [<ffffffff810e1dcd>] watchdog_overflow_callback+0xdd/0xe0
[4005105.249426] [<ffffffff8111f5f8>] __perf_event_overflow+0x88/0x250
[4005105.249427] [<ffffffff81120174>] perf_event_overflow+0x14/0x20
[4005105.249429] [<ffffffff8101e228>] intel_pmu_handle_irq+0x1c8/0x430
[4005105.249432] [<ffffffff81165bc6>] ? vunmap_page_range+0x1a6/0x310
[4005105.249434] [<ffffffff81165d41>] ? unmap_kernel_range_noflush+0x11/0x20
[4005105.249436] [<ffffffff81382ab8>] ? ghes_copy_tofrom_phys+0x118/0x1e0
[4005105.249437] [<ffffffff81034cff>] ? native_apic_wait_icr_idle+0x1f/0x30
[4005105.249439] [<ffffffff8100a275>] ? arch_irq_work_raise+0x35/0x40
[4005105.249441] [<ffffffff81016b48>] perf_event_nmi_handler+0x28/0x50
[4005105.249443] [<ffffffff81008efd>] nmi_handle+0x6d/0x140
[4005105.249445] [<ffffffff81009480>] default_do_nmi+0x40/0x100
[4005105.249446] [<ffffffff81009641>] do_nmi+0x101/0x150
[4005105.249447] [<ffffffff81616687>] end_repeat_nmi+0x1a/0x1e
[4005105.249450] [<ffffffffa02dd7fc>] ? ipoib_mcast_join_task+0x14c/0x330
[ib_ipoib]](https://image.slidesharecdn.com/crashdumps-161106235855/85/Linux-Kernel-Crashdump-29-320.jpg)
![Analyzing the crashed kernel
[4005105.249450] [<ffffffffa02dd7fc>] ?
ipoib_mcast_join_task+0x14c/0x330 [ib_ipoib]
crash> list *(ipoib_mcast_join_task+0x14c)
list: invalid argument:
*(ipoib_mcast_join_task+0x14c)
crash>
# grep -r ipoib_mcast_join_task
drivers/infiniband/ulp/ipoib/ipoib_multicast.c:void
ipoib_mcast_join_task(struct work_struct *work)](https://image.slidesharecdn.com/crashdumps-161106235855/85/Linux-Kernel-Crashdump-30-320.jpg)


![Analyzing the crashed kernel
crash> whatis task_struct.cred
struct task_struct {
[1456] const struct cred *cred;
}
crash> whatis struct cred
struct cred {
kuid_t uid;
kuid_t suid;
kuid_t euid;
kuid_t fsuid;
kernel_cap_t cap_inheritable;
kernel_cap_t cap_permitted;
kernel_cap_t cap_effective;
struct user_struct *user;
struct user_namespace *user_ns;
struct group_info *group_info;](https://image.slidesharecdn.com/crashdumps-161106235855/85/Linux-Kernel-Crashdump-36-320.jpg)


The document discusses analyzing Linux kernel crash dumps. It covers various ways to gather crash data like serial console, netconsole, kmsg dumpers, Kdump, and Pstore. It then discusses analyzing the crashed kernel using tools like ksymoops, crash utility, and examining the backtrace, kernel logs, processes, and file descriptors. The document provides examples of gathering data from Pstore and using commands like bt, log, and ps with the crash utility to extract information from a crash dump.