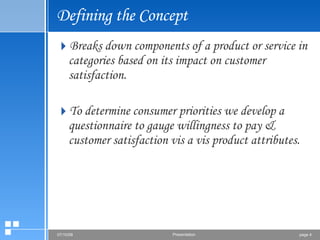
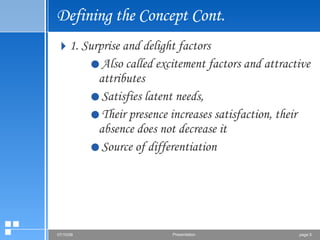
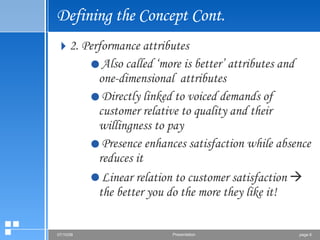
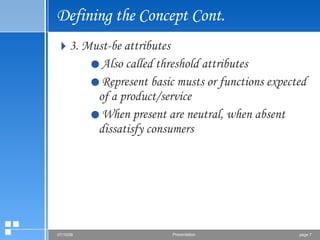
Downloaded 377 times
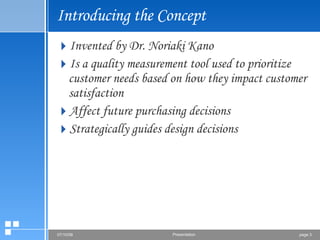

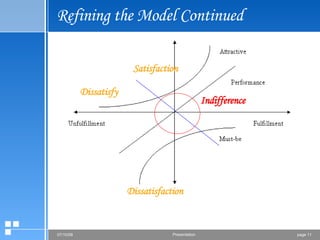
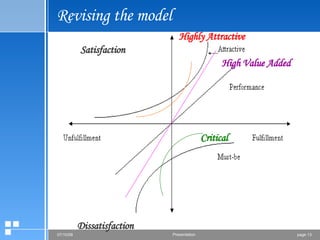


The document summarizes the Kano model, which is a technique used to prioritize customer needs based on their impact on satisfaction. It breaks needs down into five categories: must-be attributes, performance attributes, excitement attributes, indifferent attributes, and dissatisfiers. Questionnaires are used to determine which category each attribute falls into. Plotting the attributes on a Kano graph allows companies to strategically focus on meeting attributes that will most increase customer satisfaction and drive purchases.