Download to read offline


![[
{ ... },
{
"name": "Westmalle Tripel",
"brewery": "Brouwerij der Trappisten van Westmalle",
"votes": 17658,
"rating": 4.7
},
{ ... }
]](https://image.slidesharecdn.com/jetbrainsasia-exploring-181125001040/75/JetBrains-Day-Seoul-Exploring-NET-s-memory-management-a-trip-down-memory-lane-22-2048.jpg)

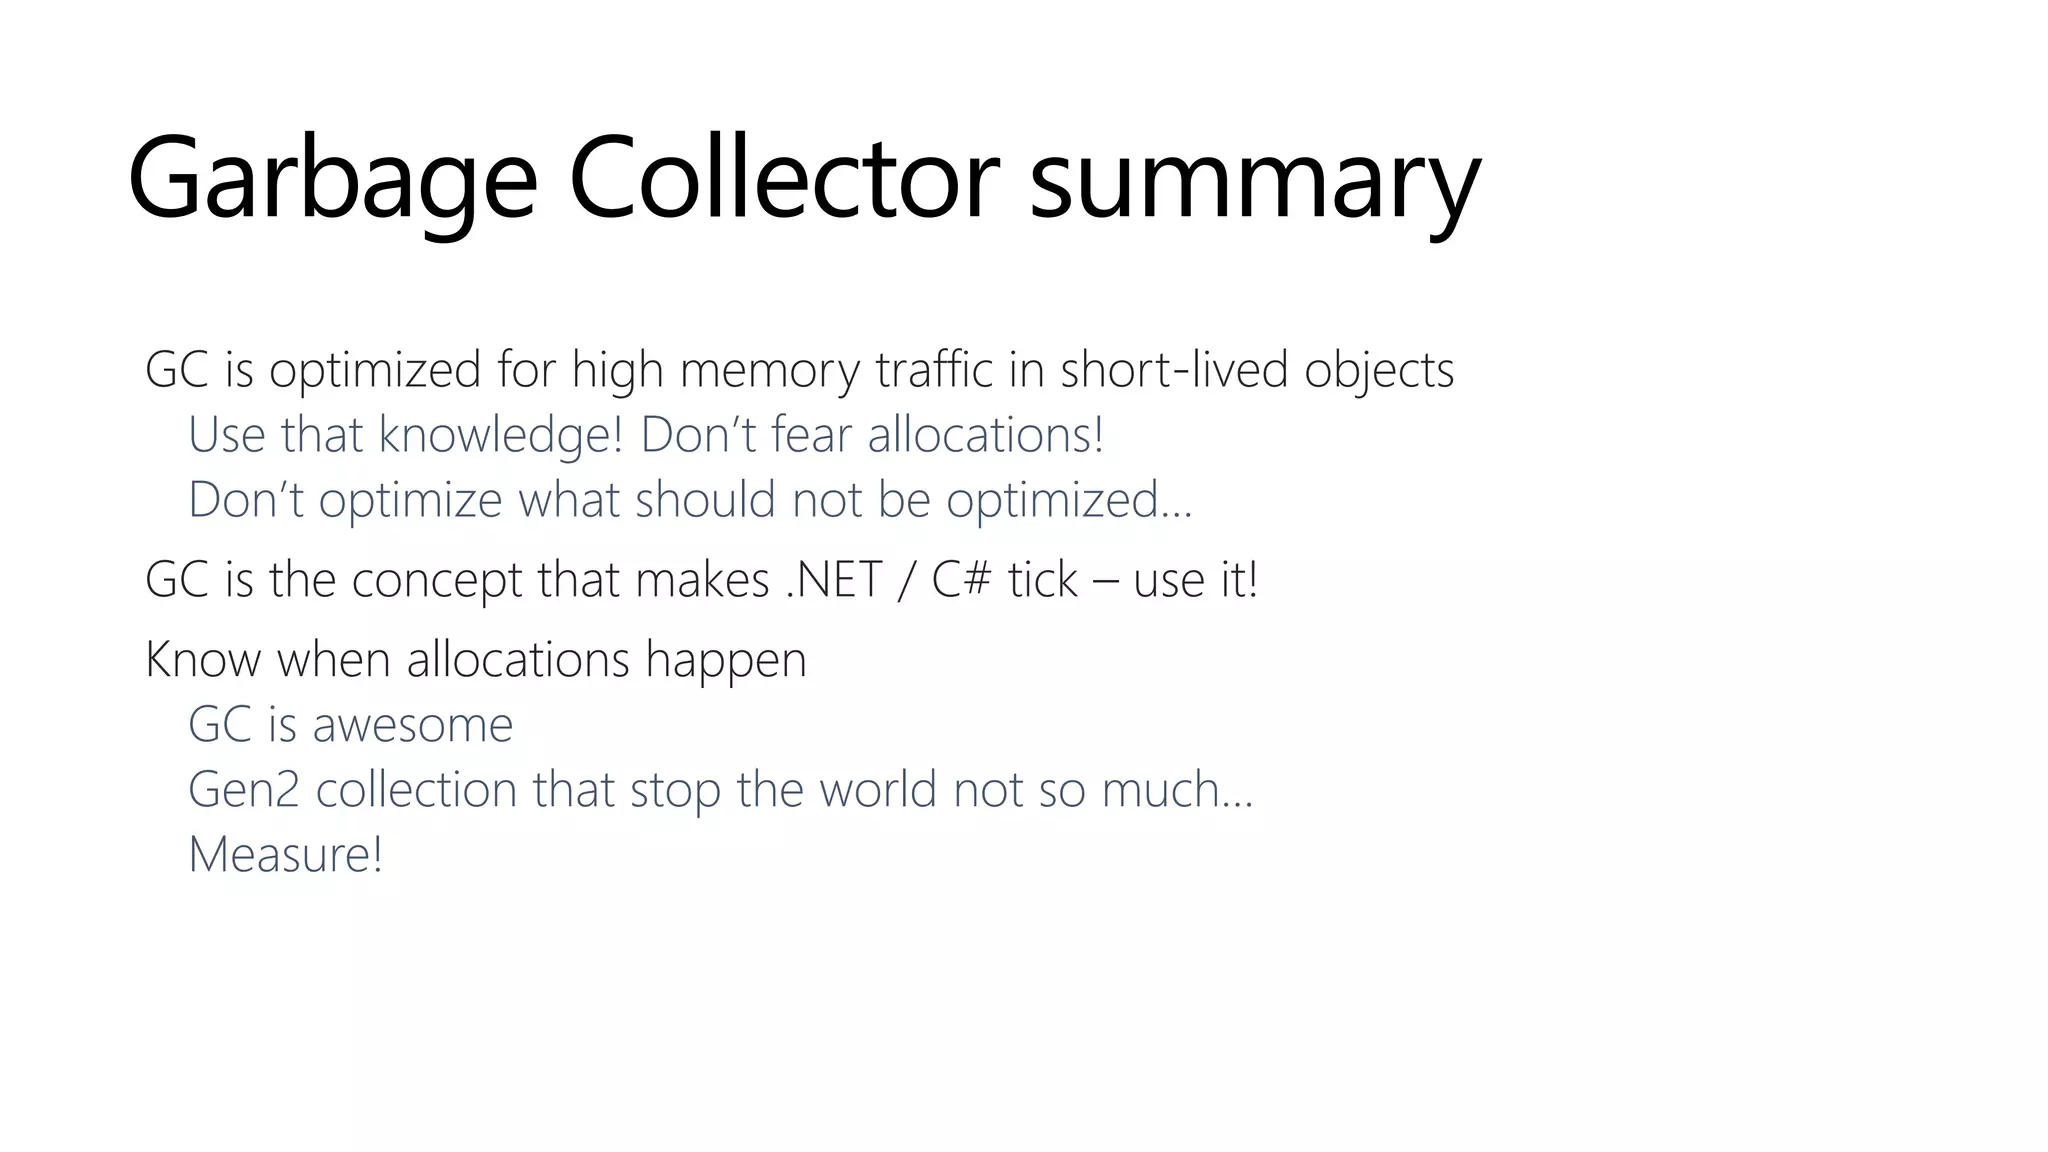


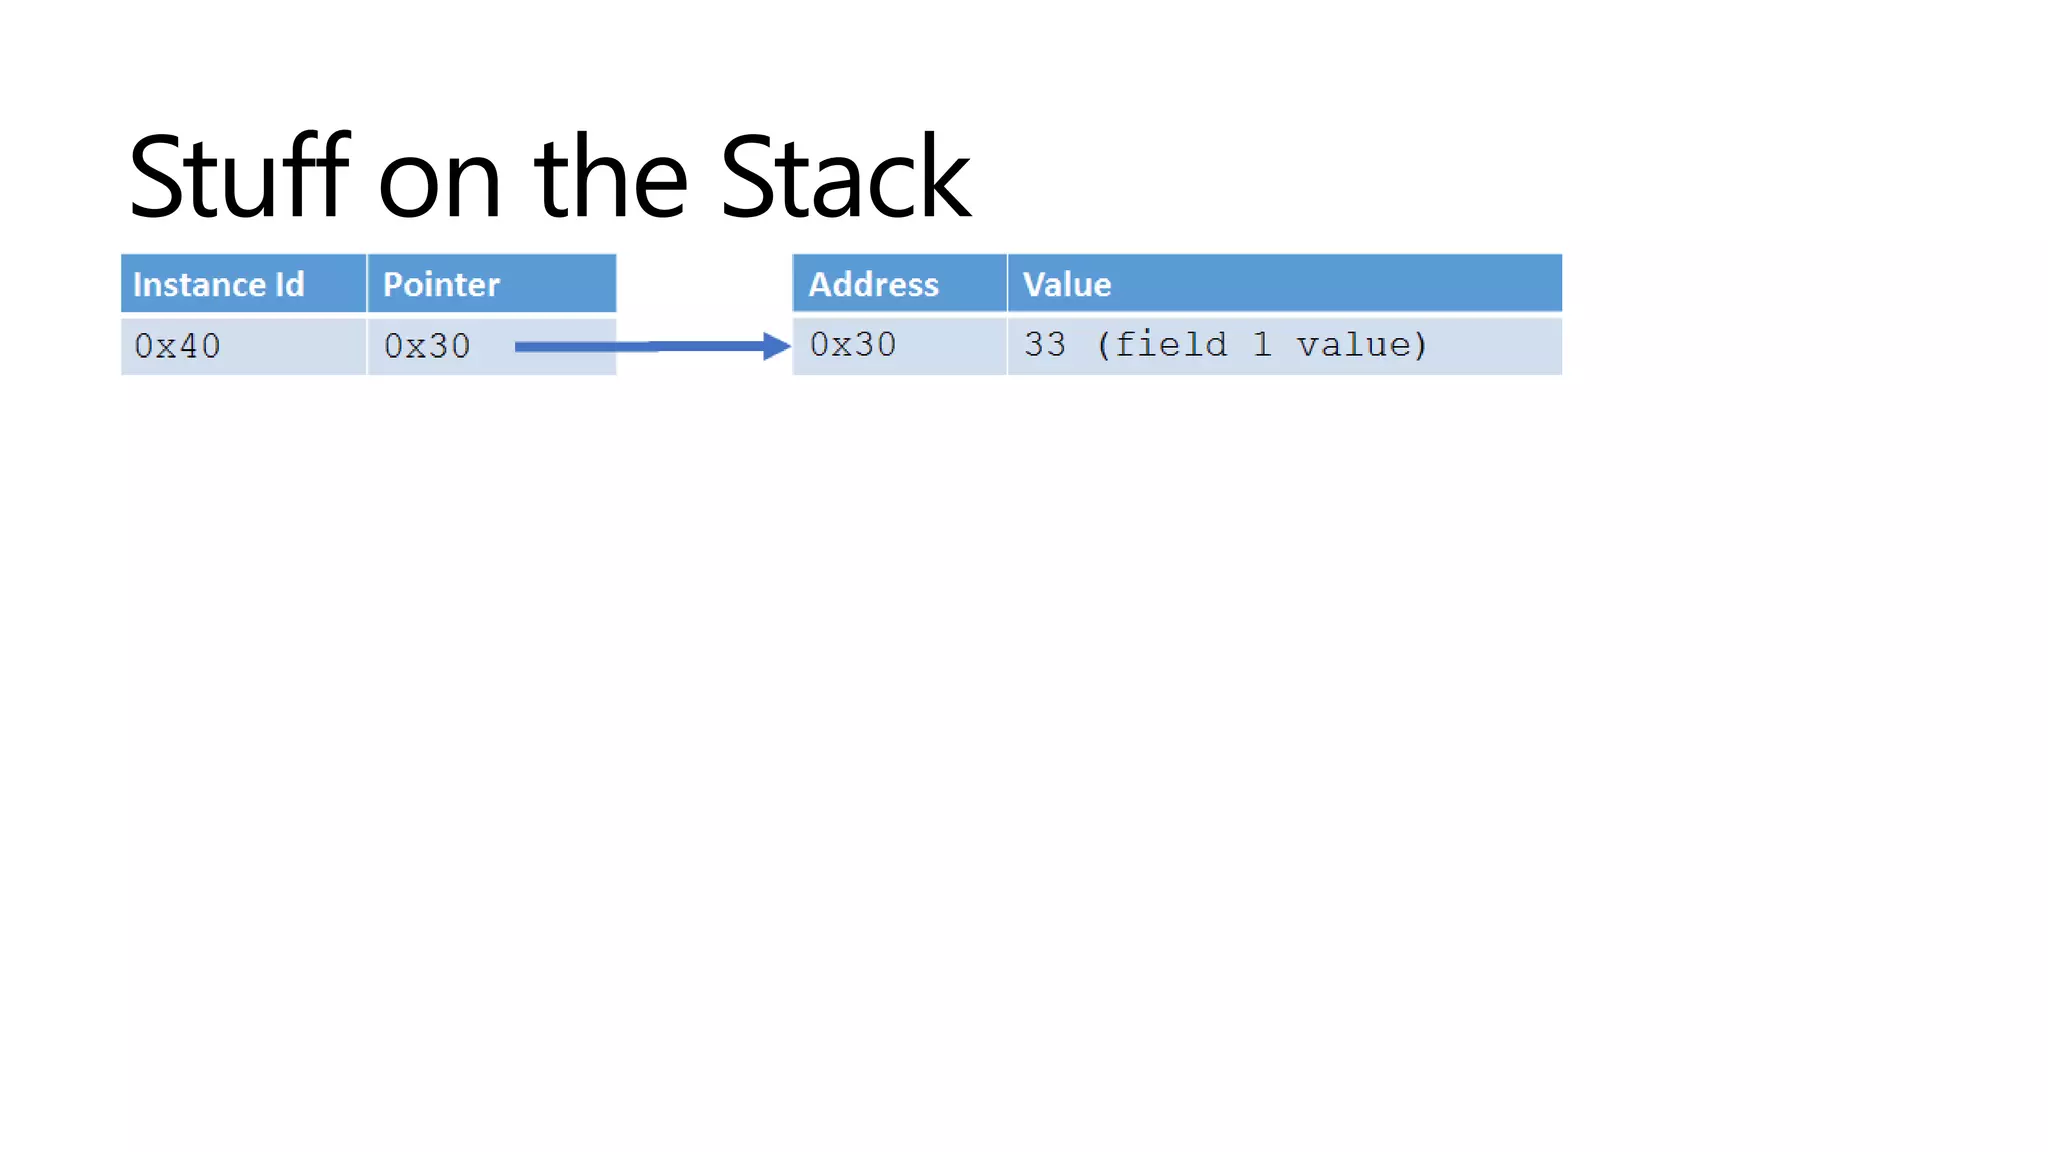
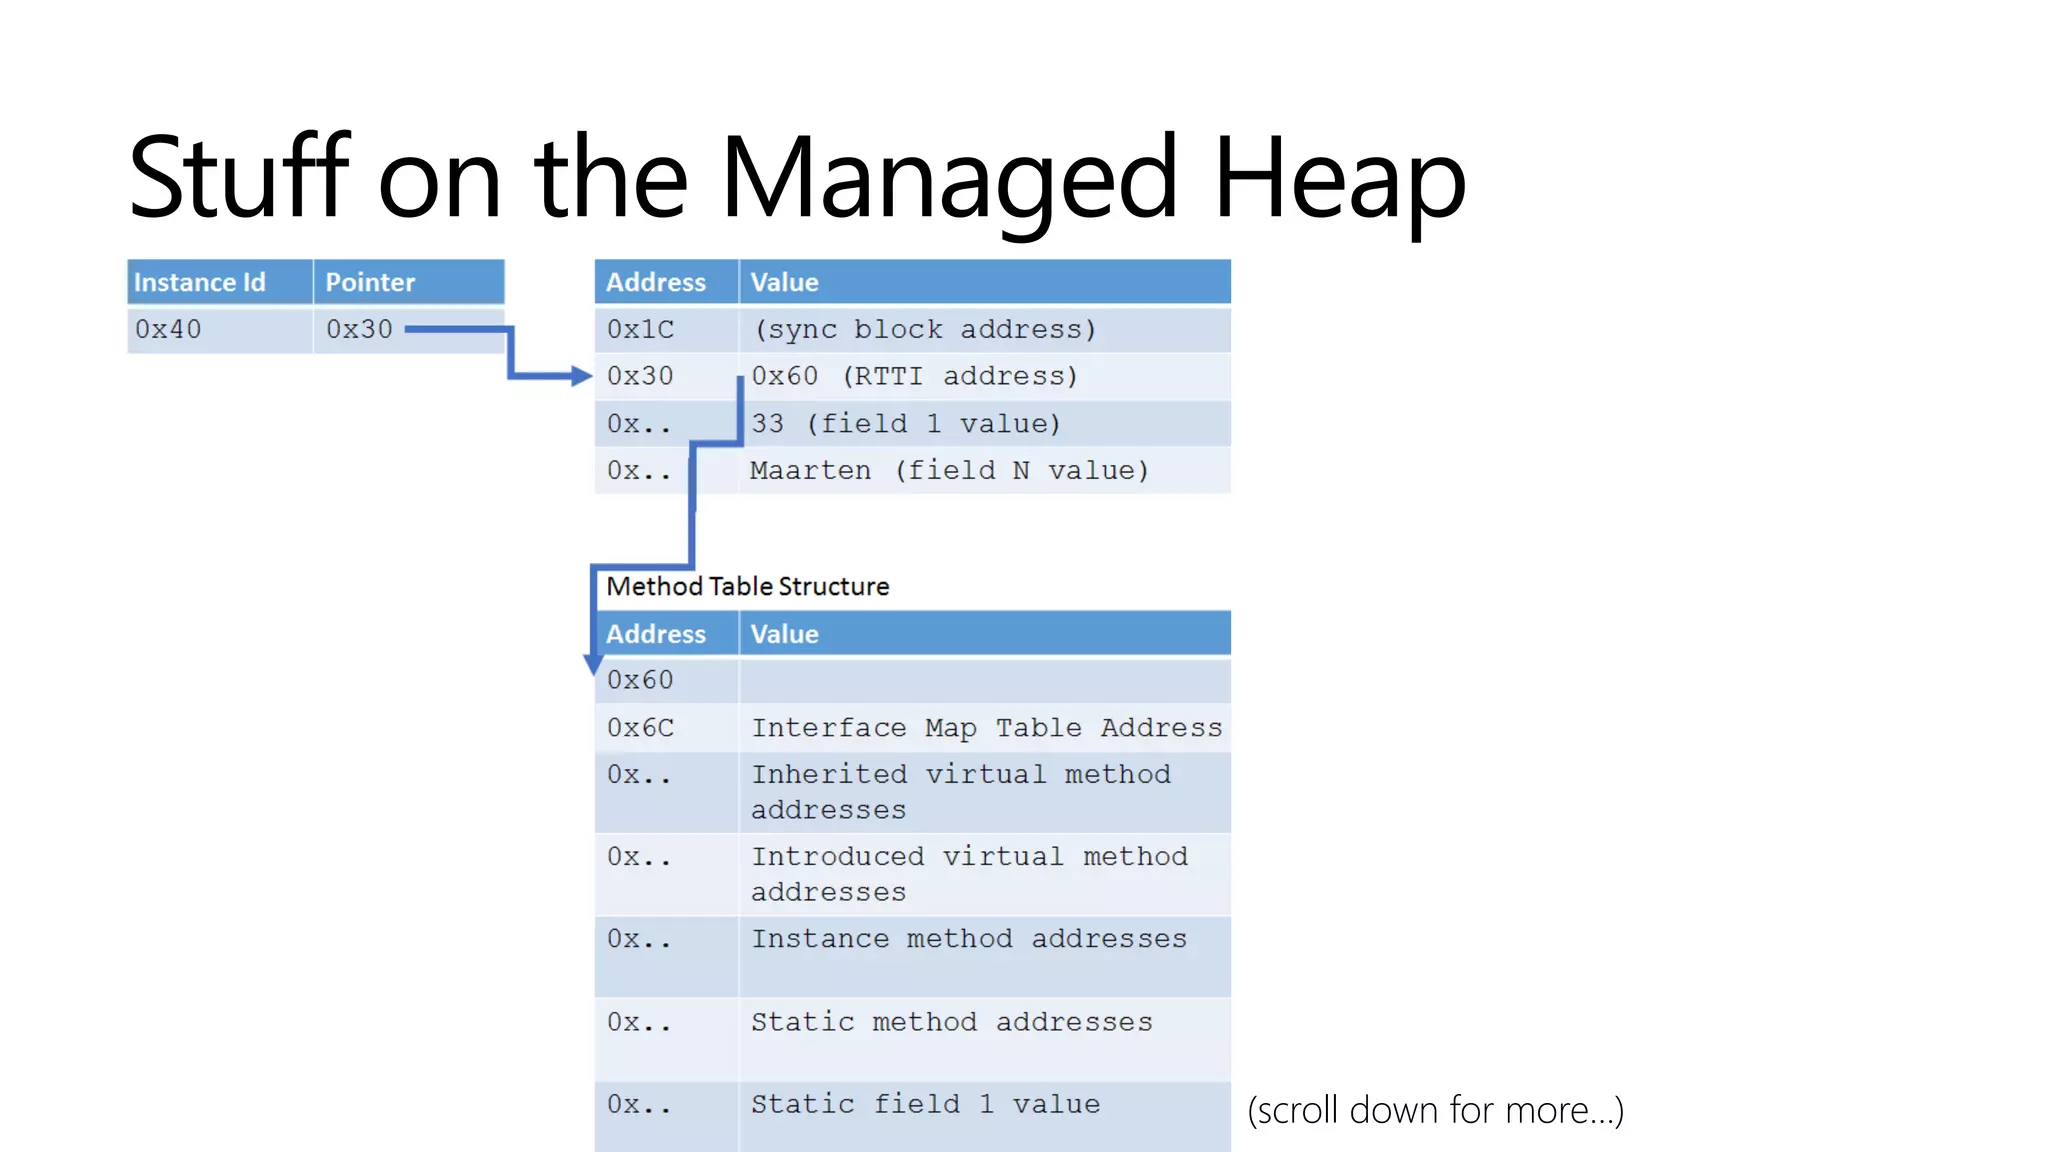


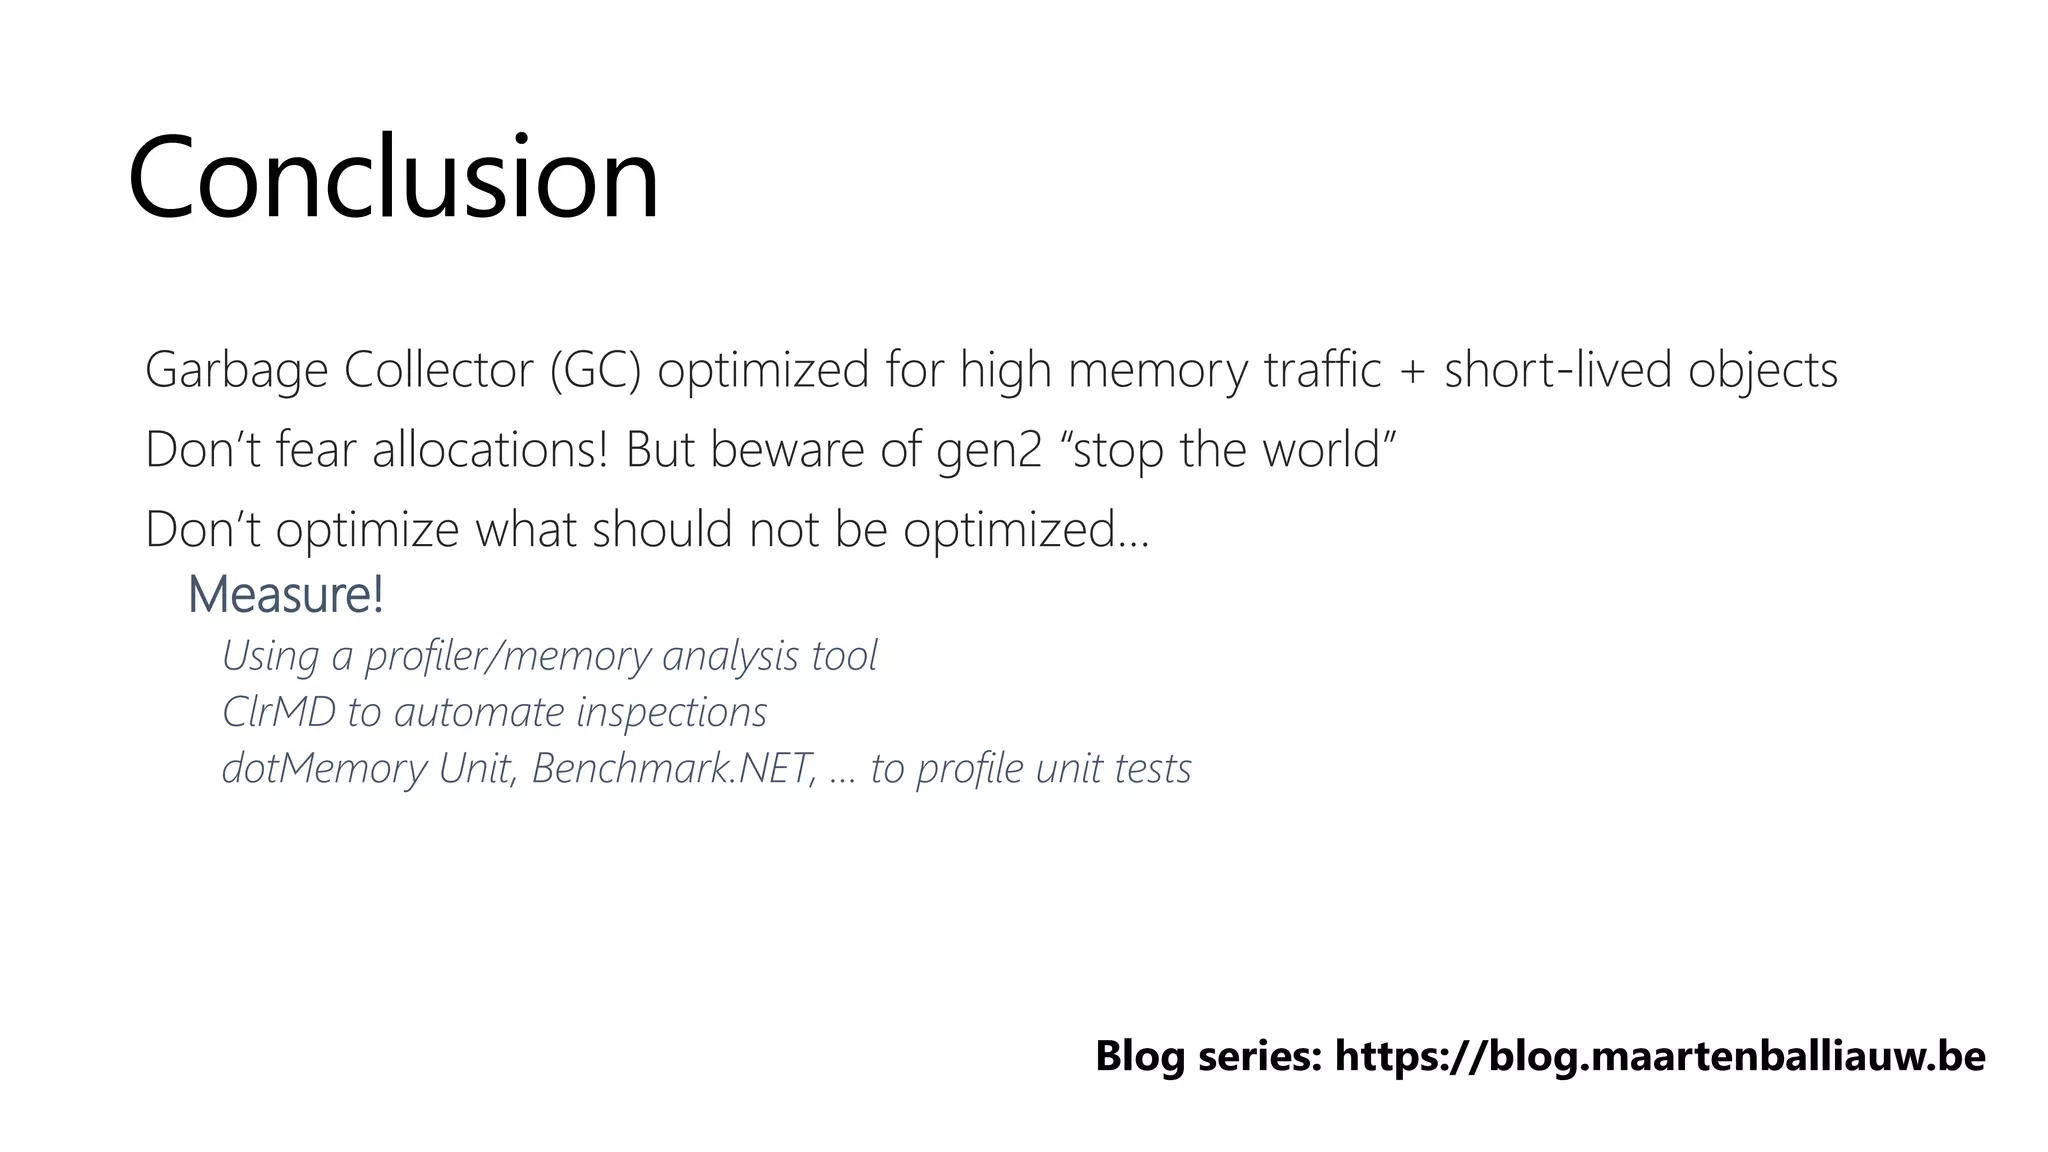


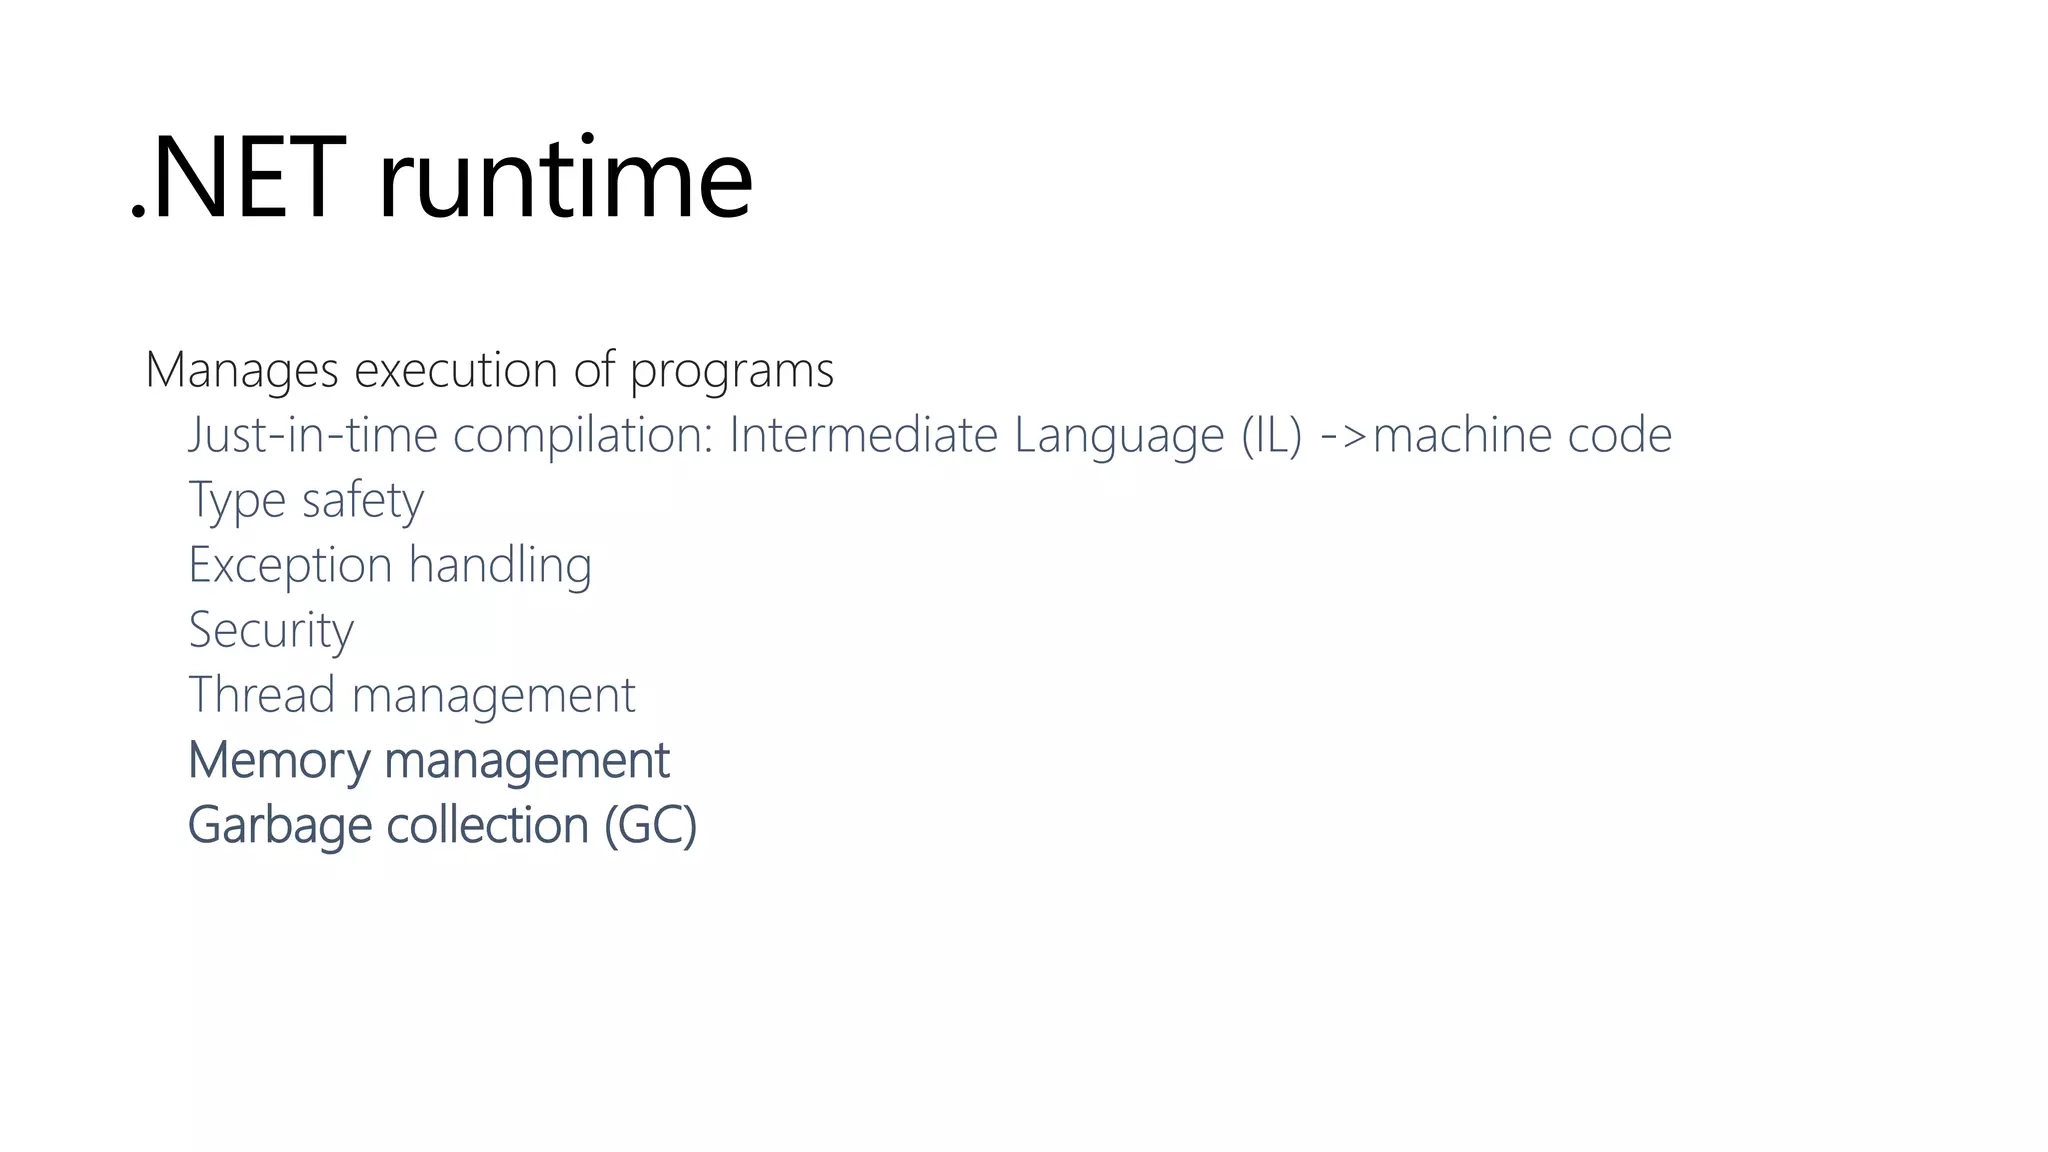
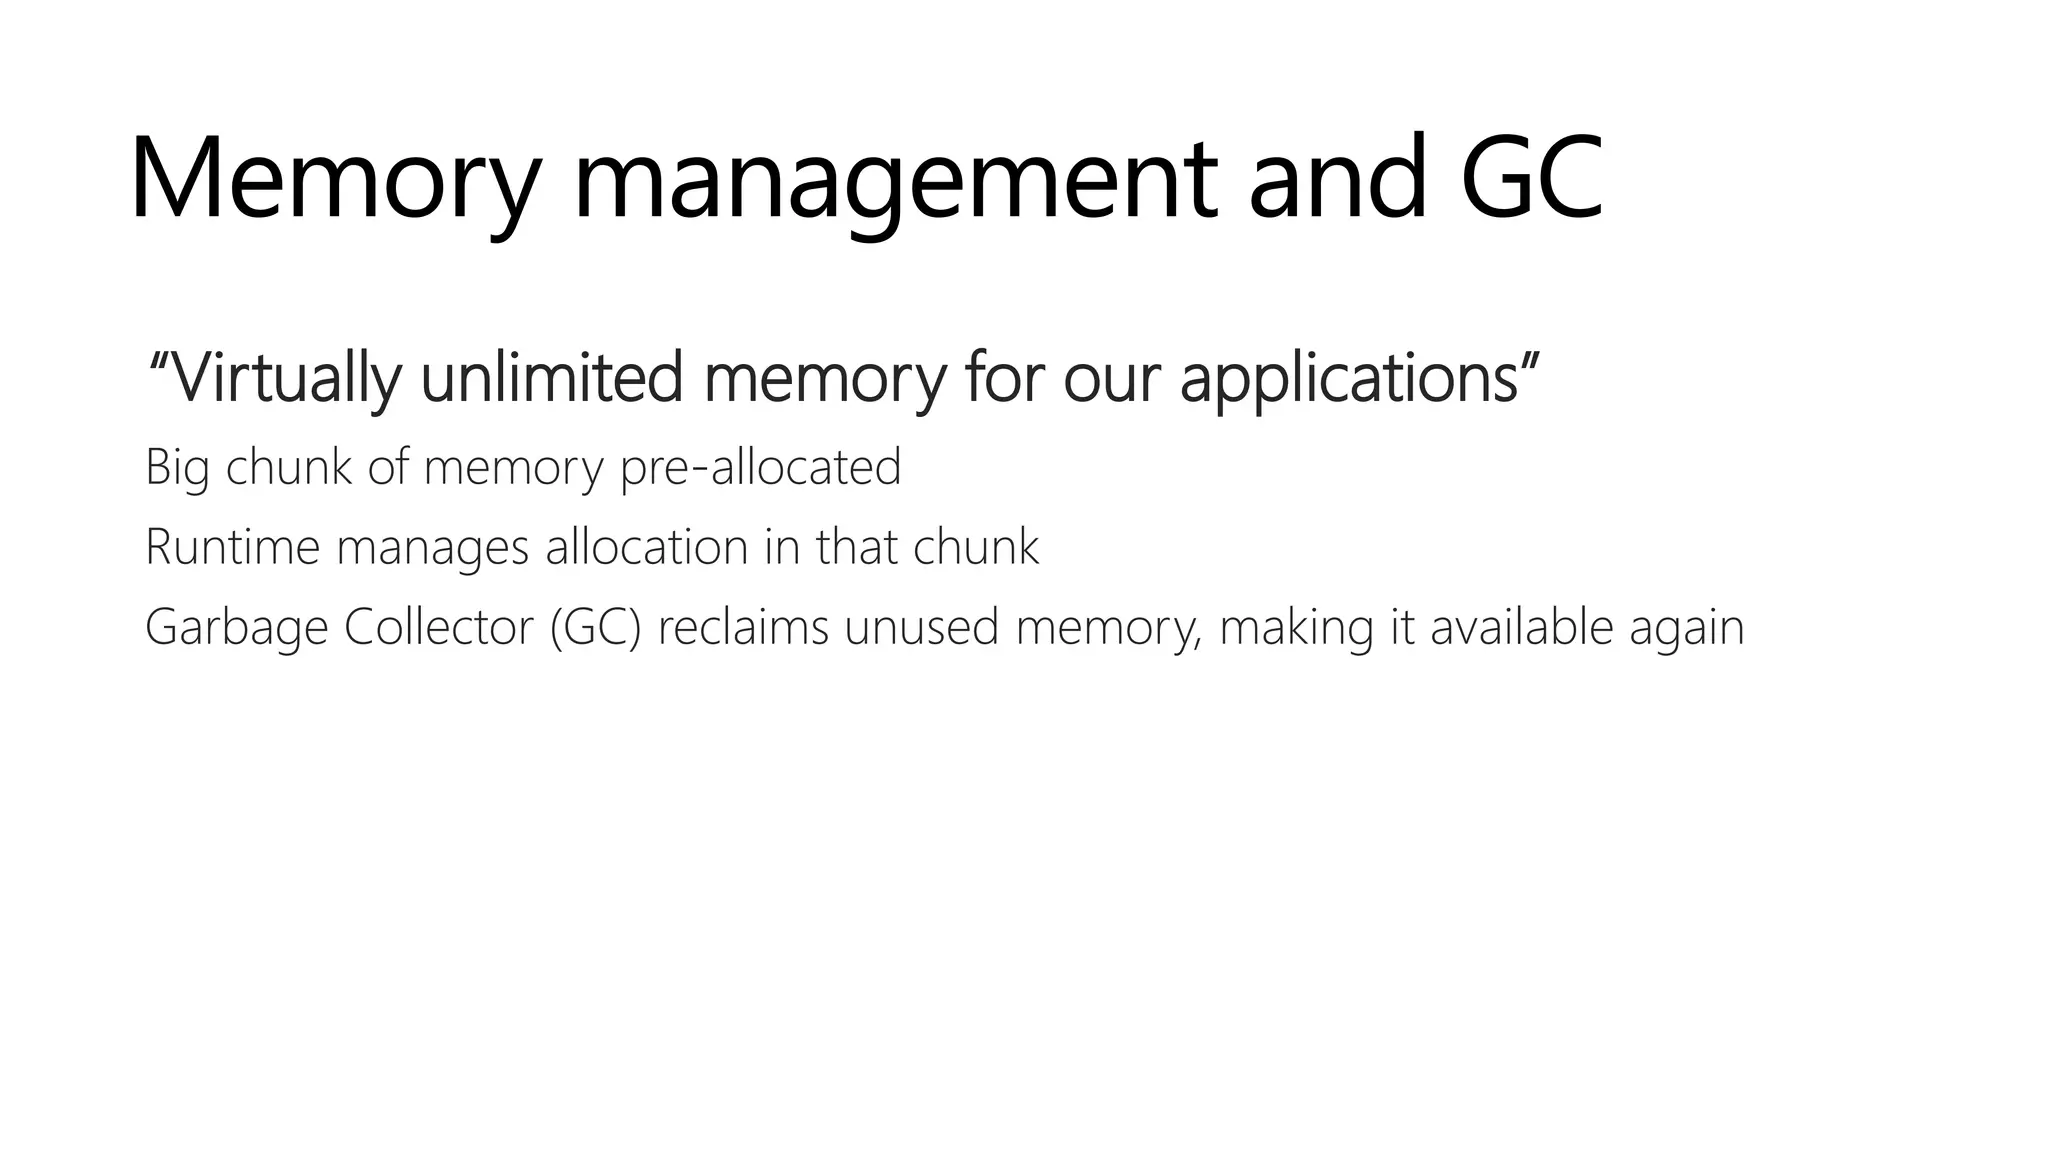
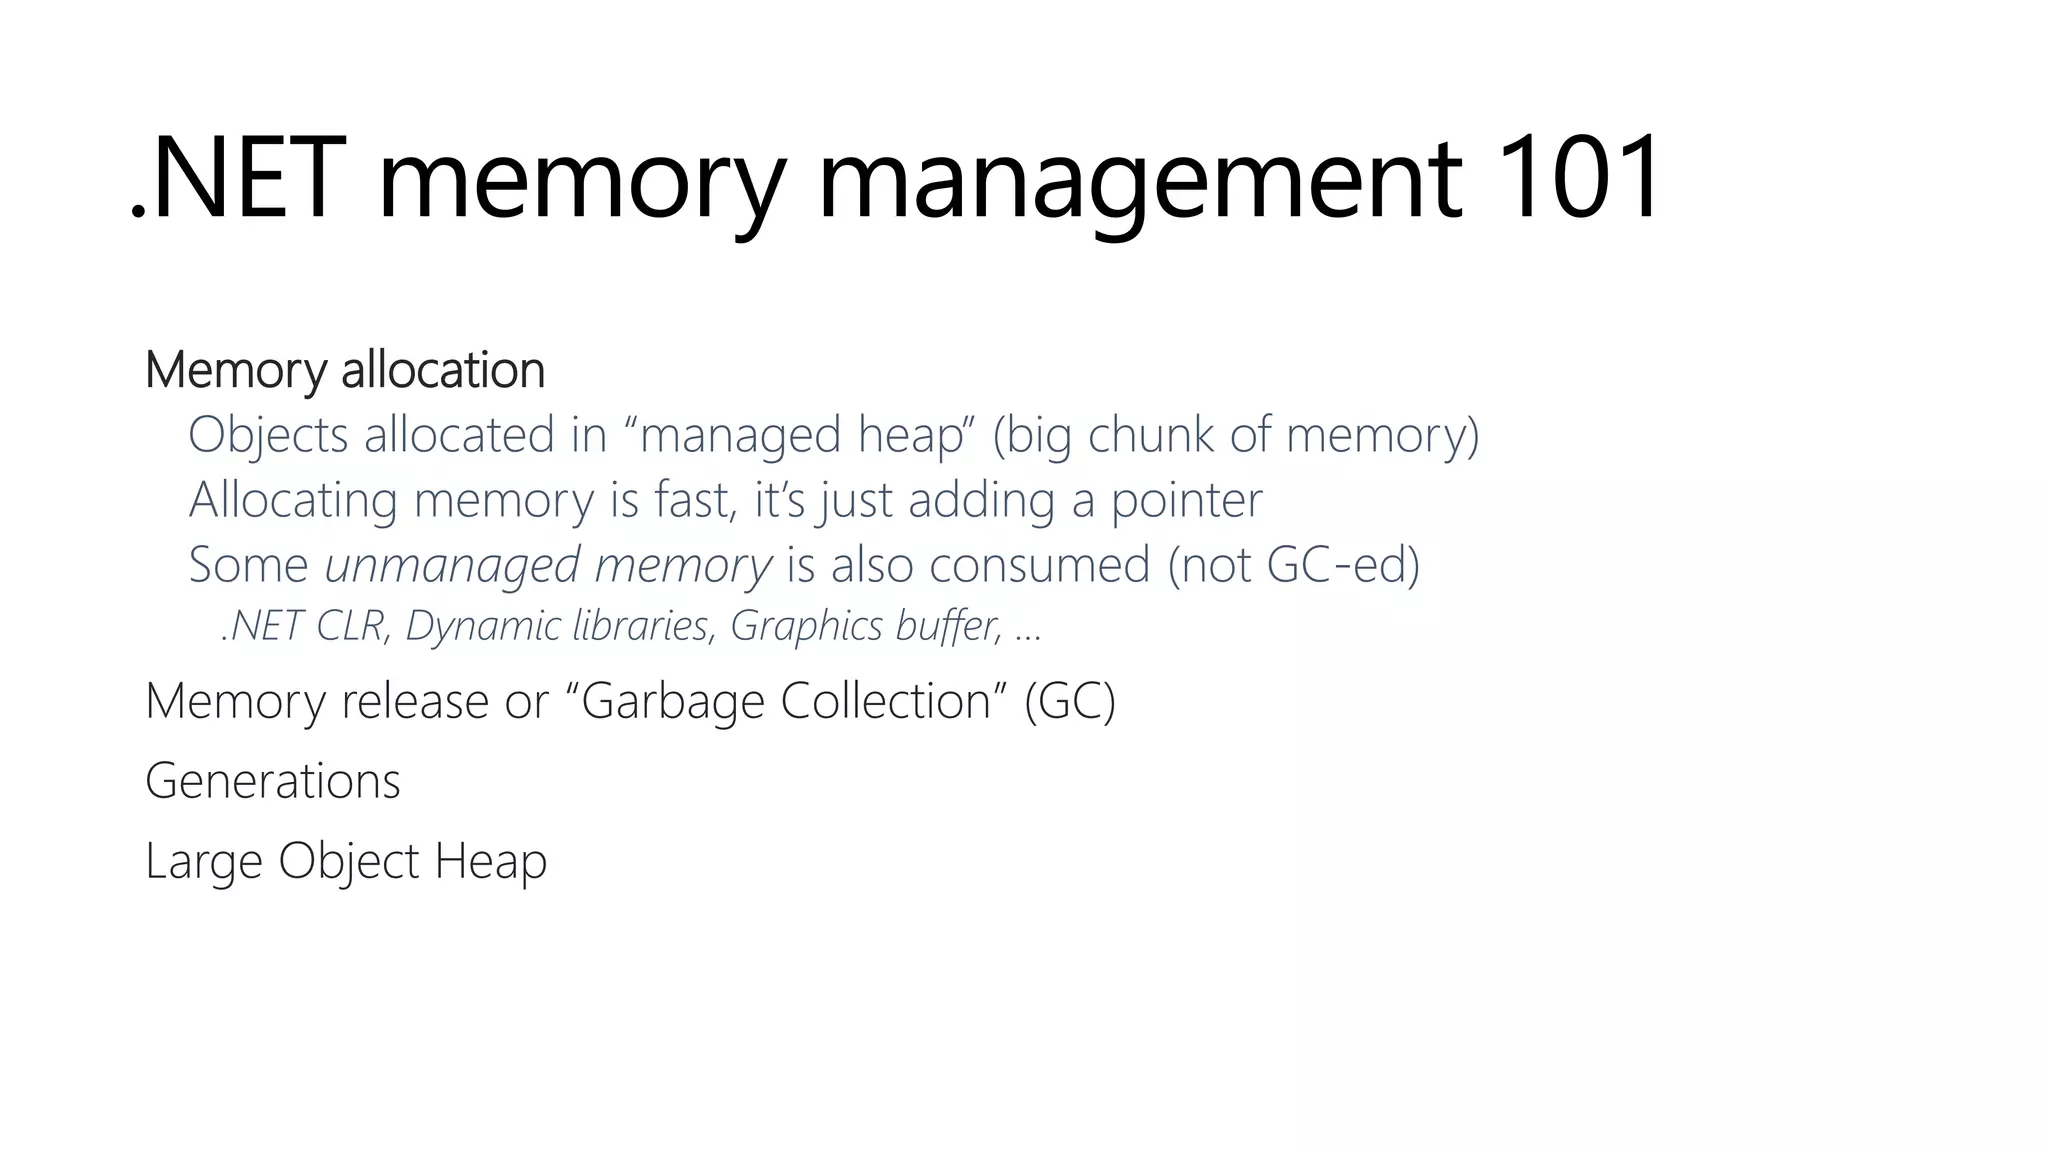
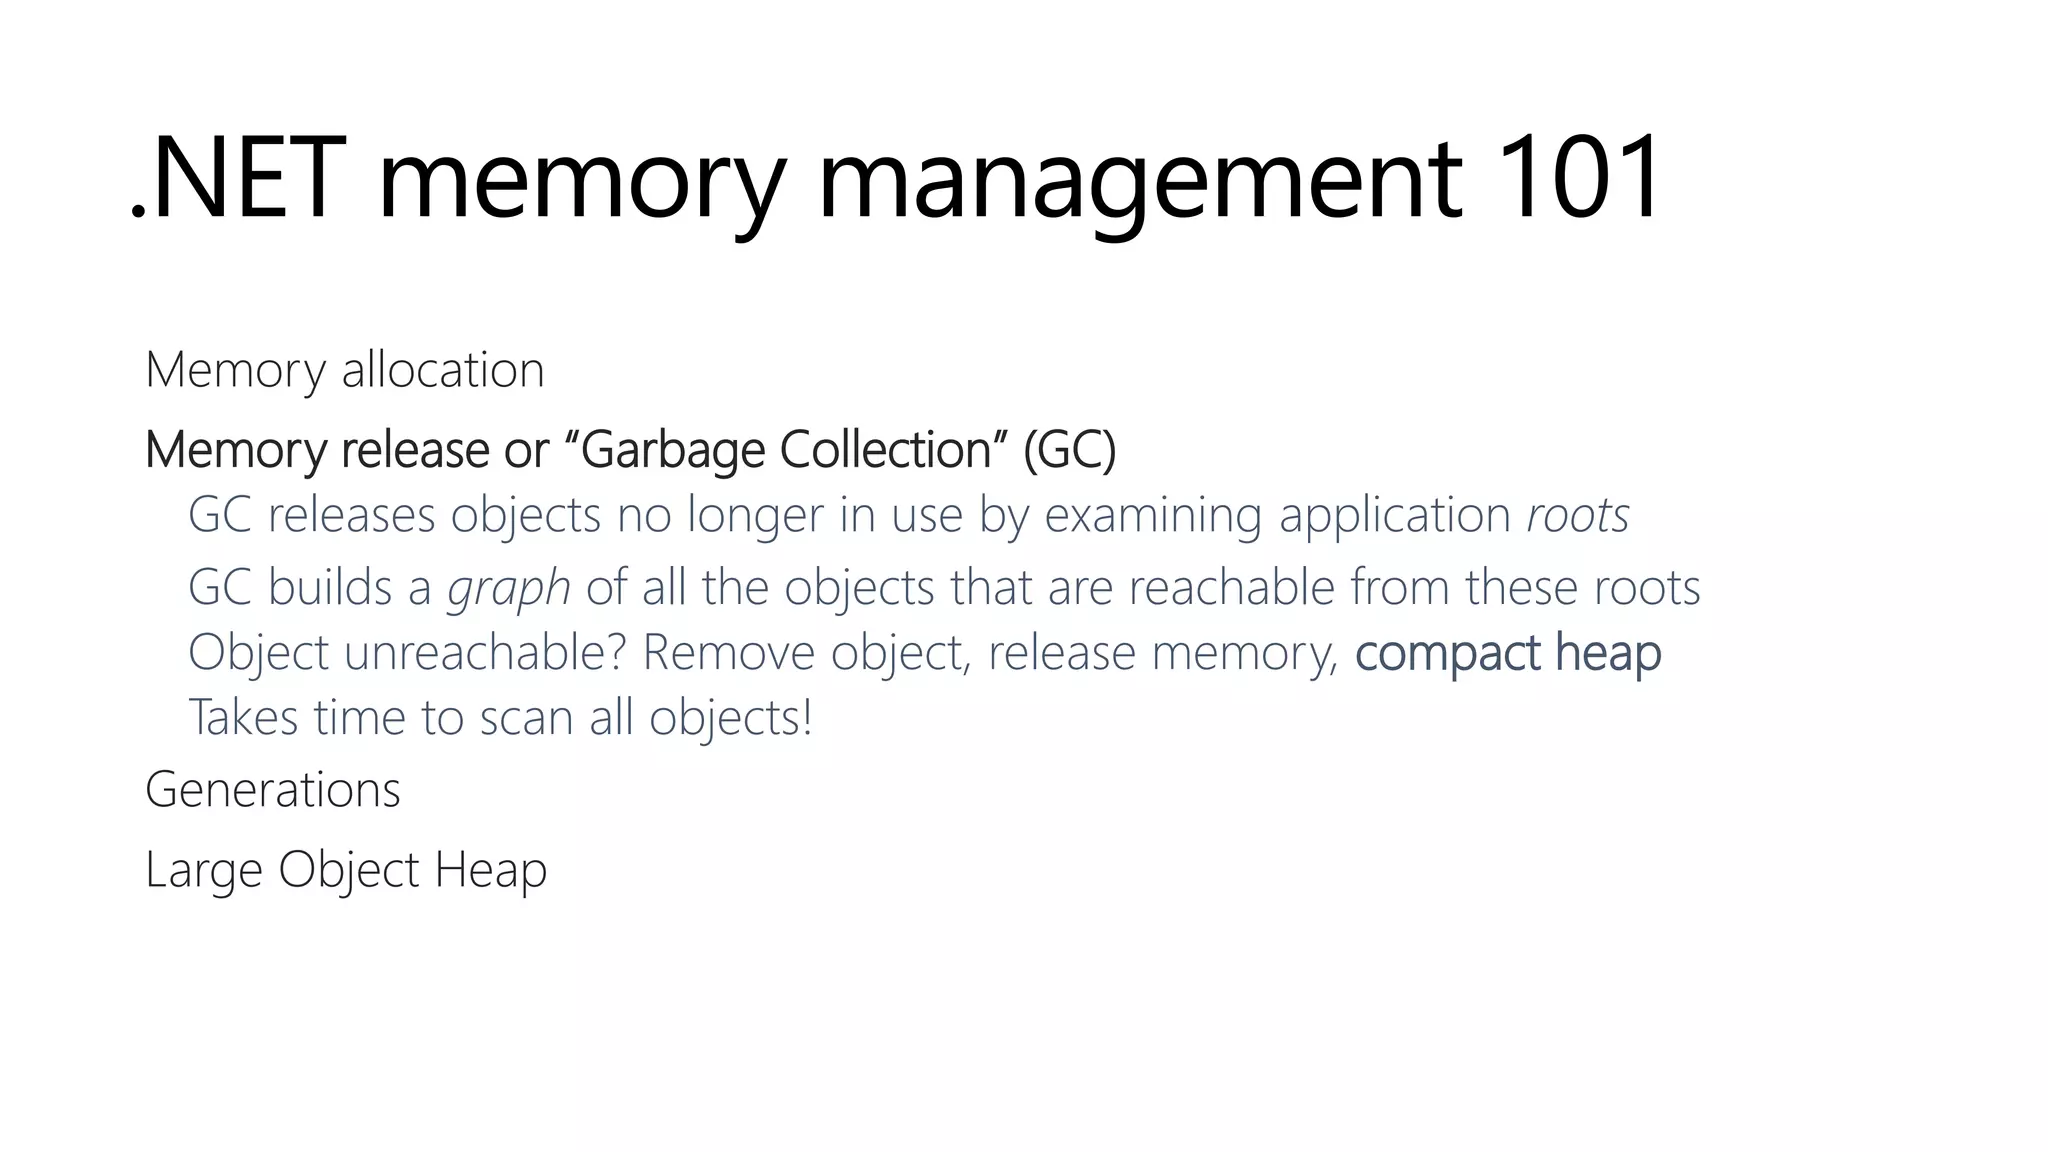
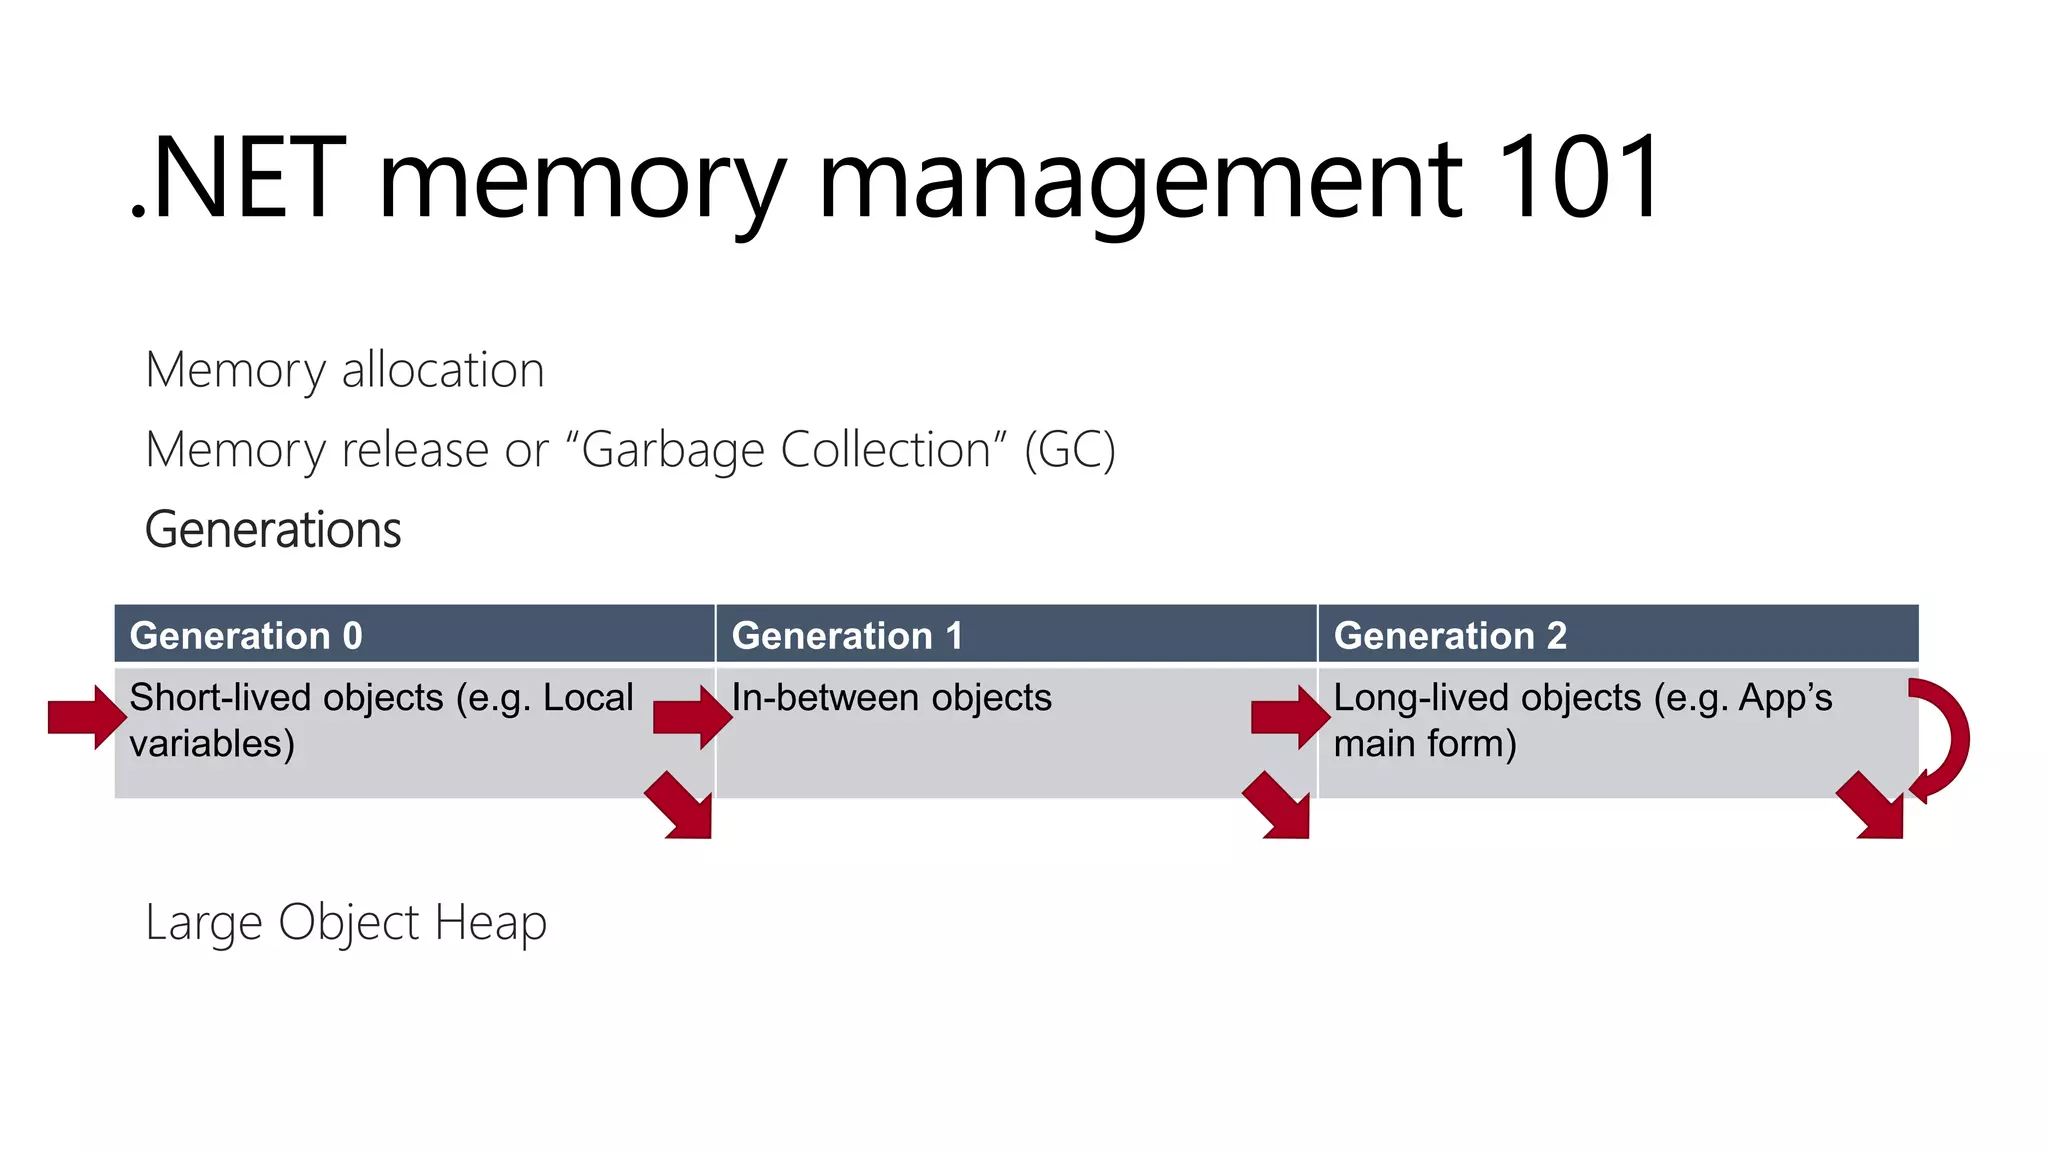
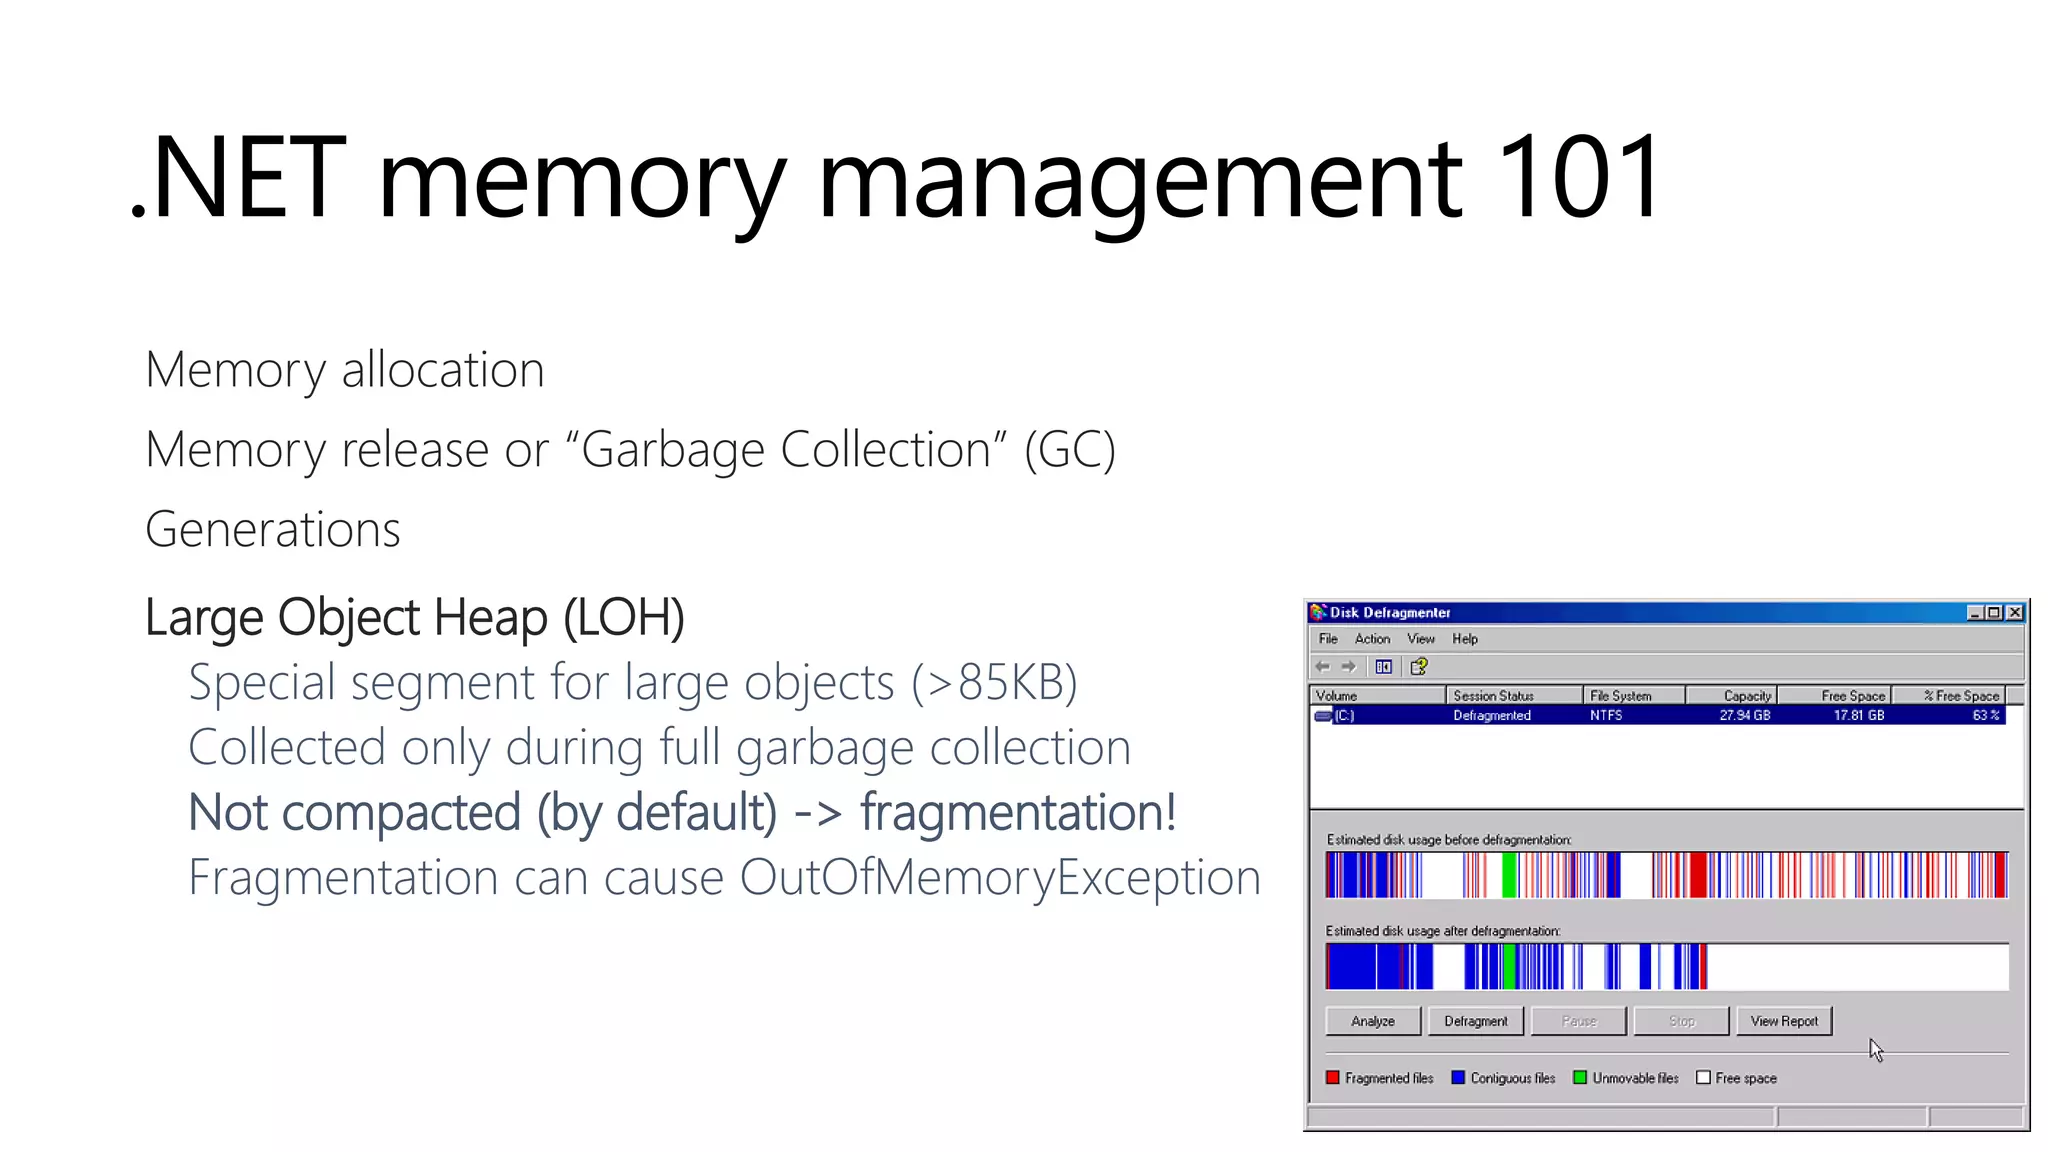
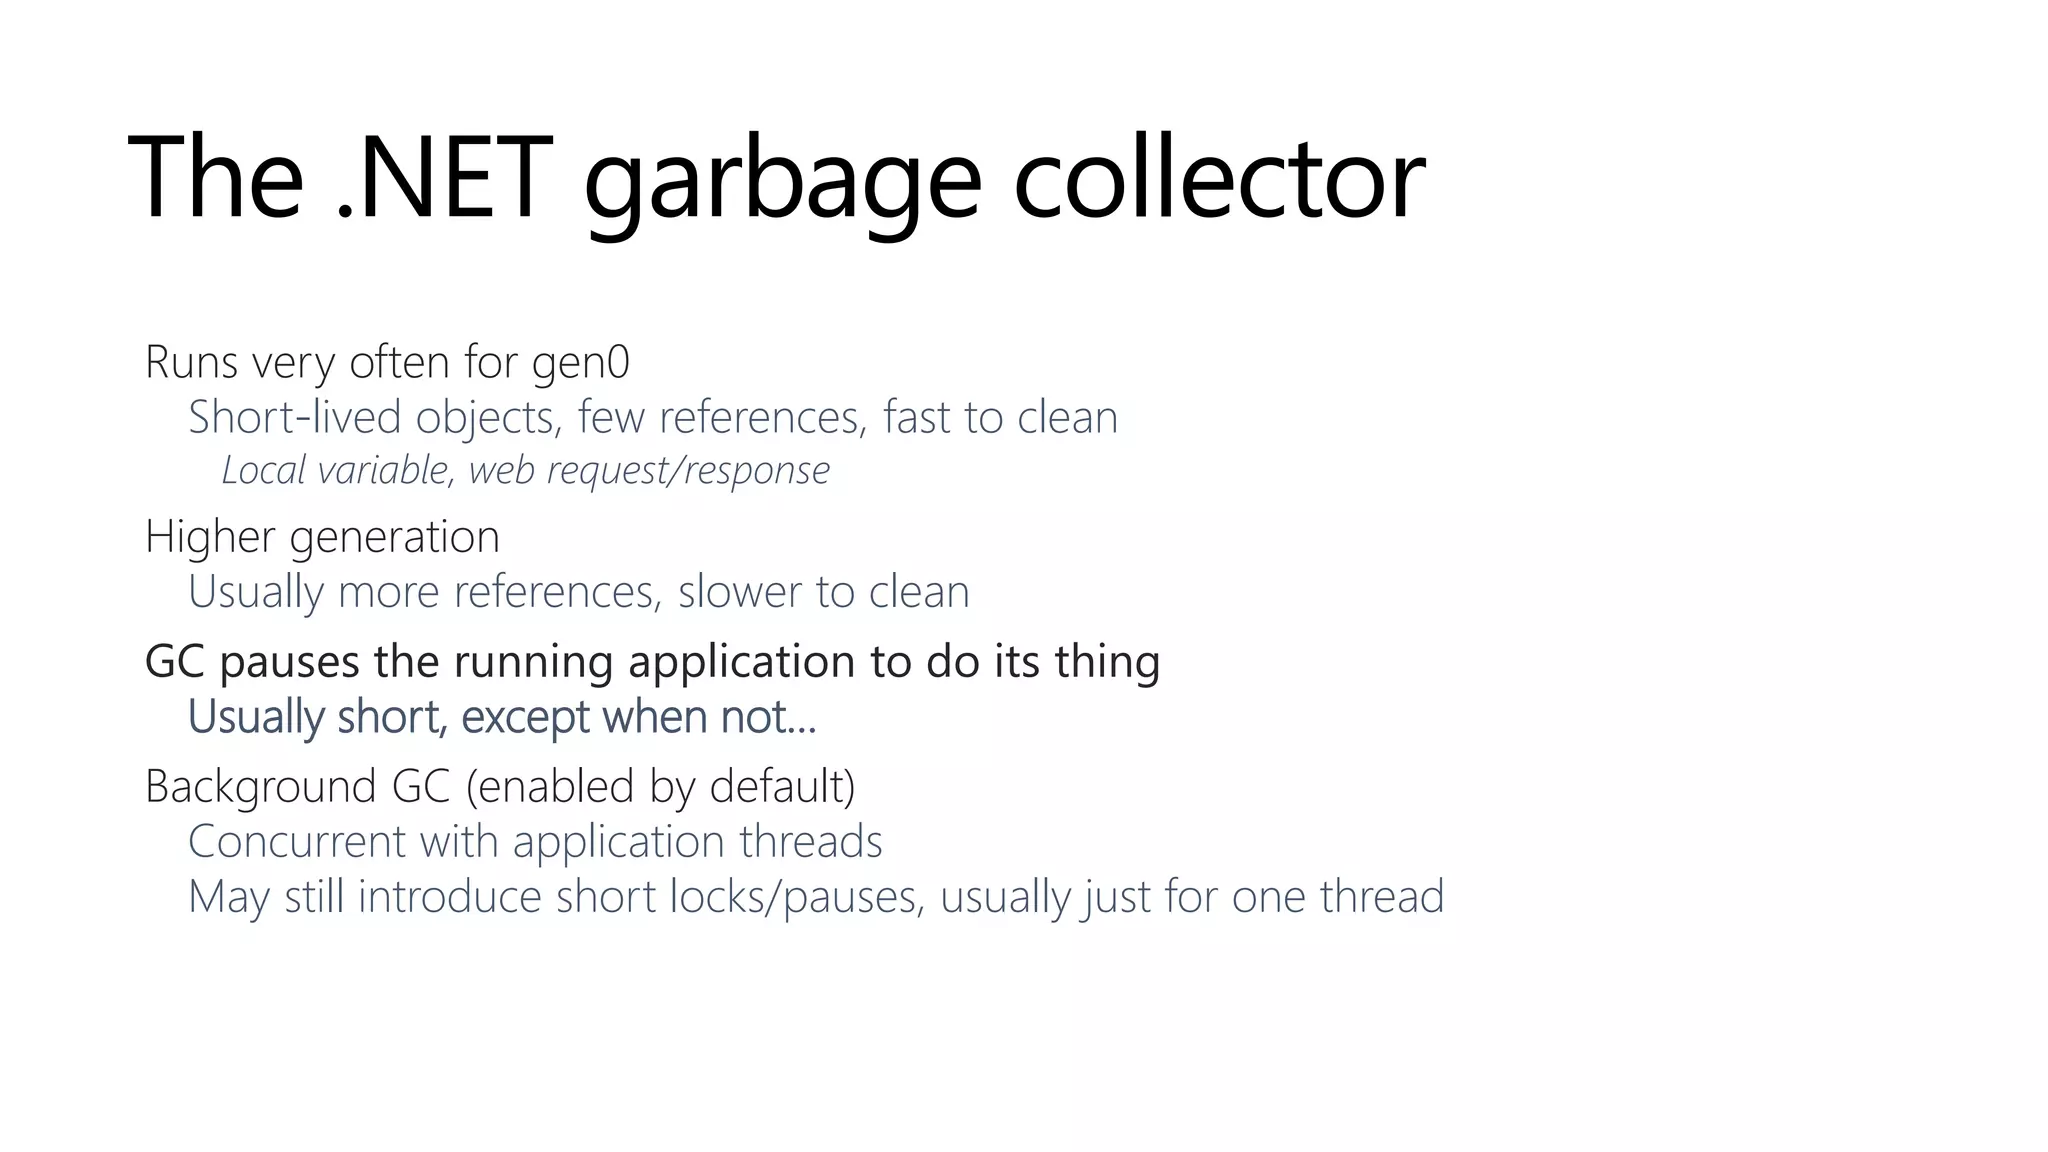
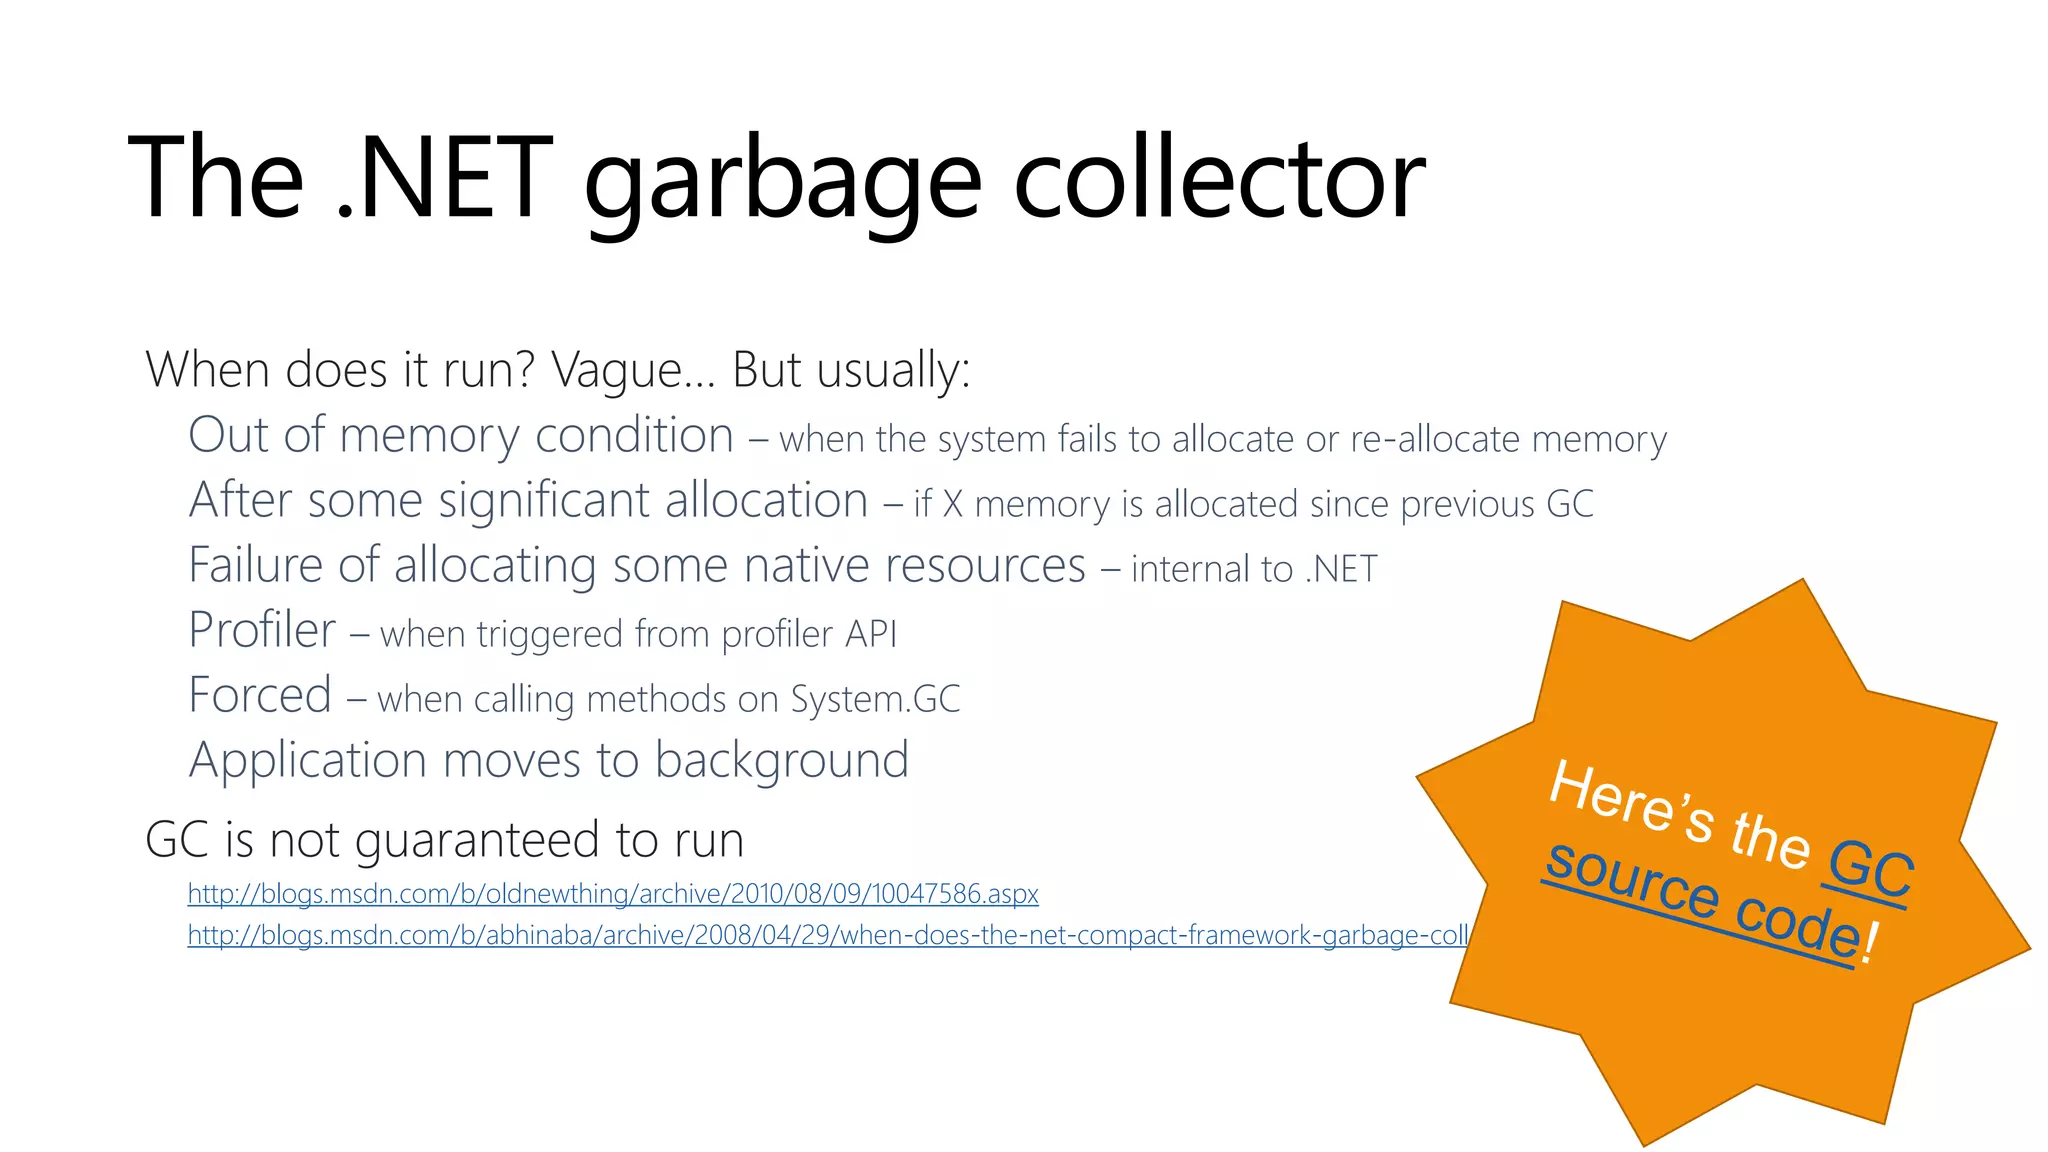
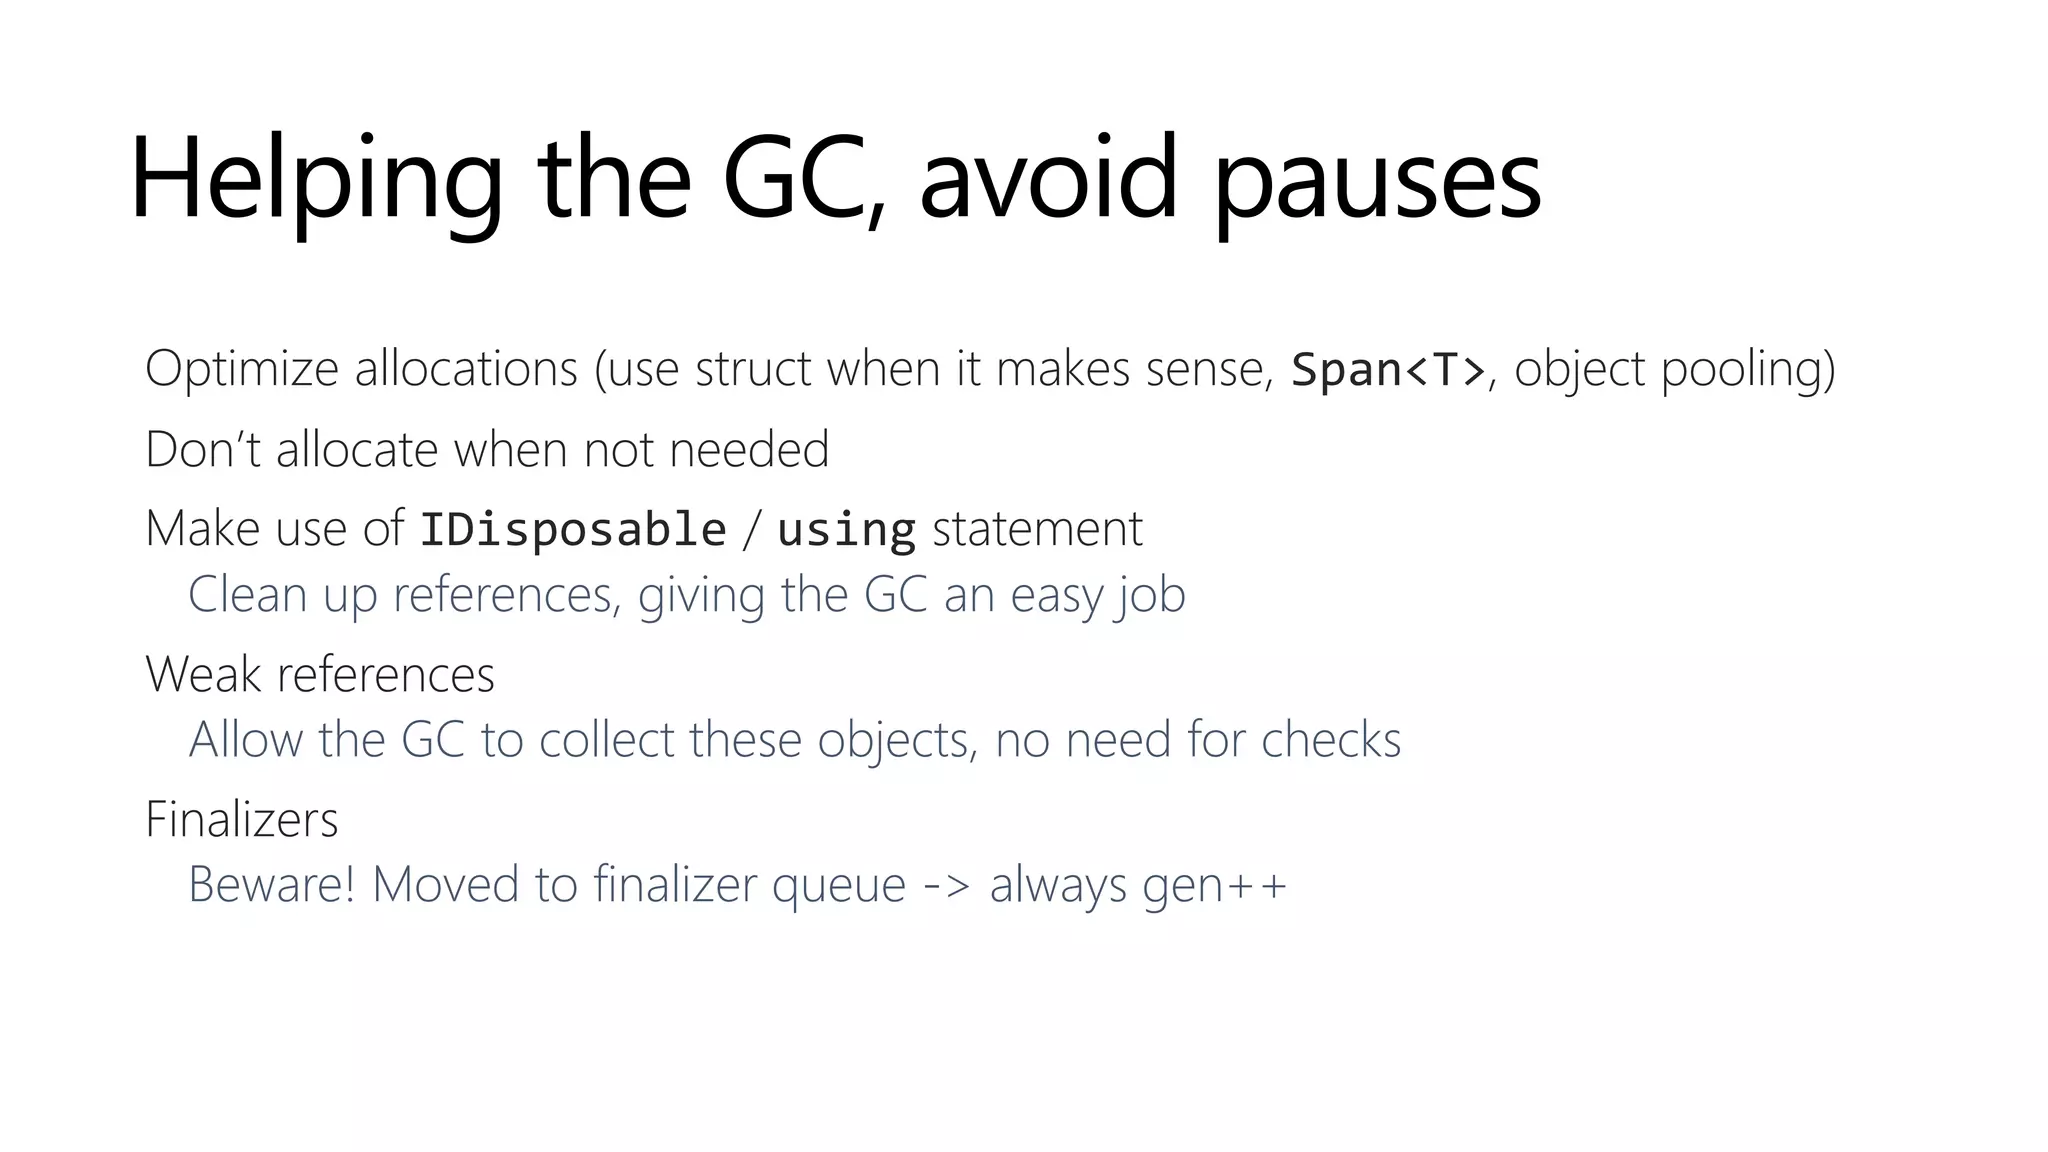
.NET memory management is primarily handled by the garbage collector (GC), which manages memory allocation in the managed heap and reclaims unused memory. Memory is allocated quickly using pointers, and objects are organized into generations for efficient garbage collection, with special consideration for large objects. Developers are encouraged to optimize allocations and use tools for measurement to prevent performance issues related to memory management.


![Vibe Coding vs. Spec-Driven Development [Free Meetup]](https://cdn.slidesharecdn.com/ss_thumbnails/vibecodingvsspecdrivendevelopment-251209105622-43f455e7-thumbnail.jpg?width=640&height=640&fit=bounds)


