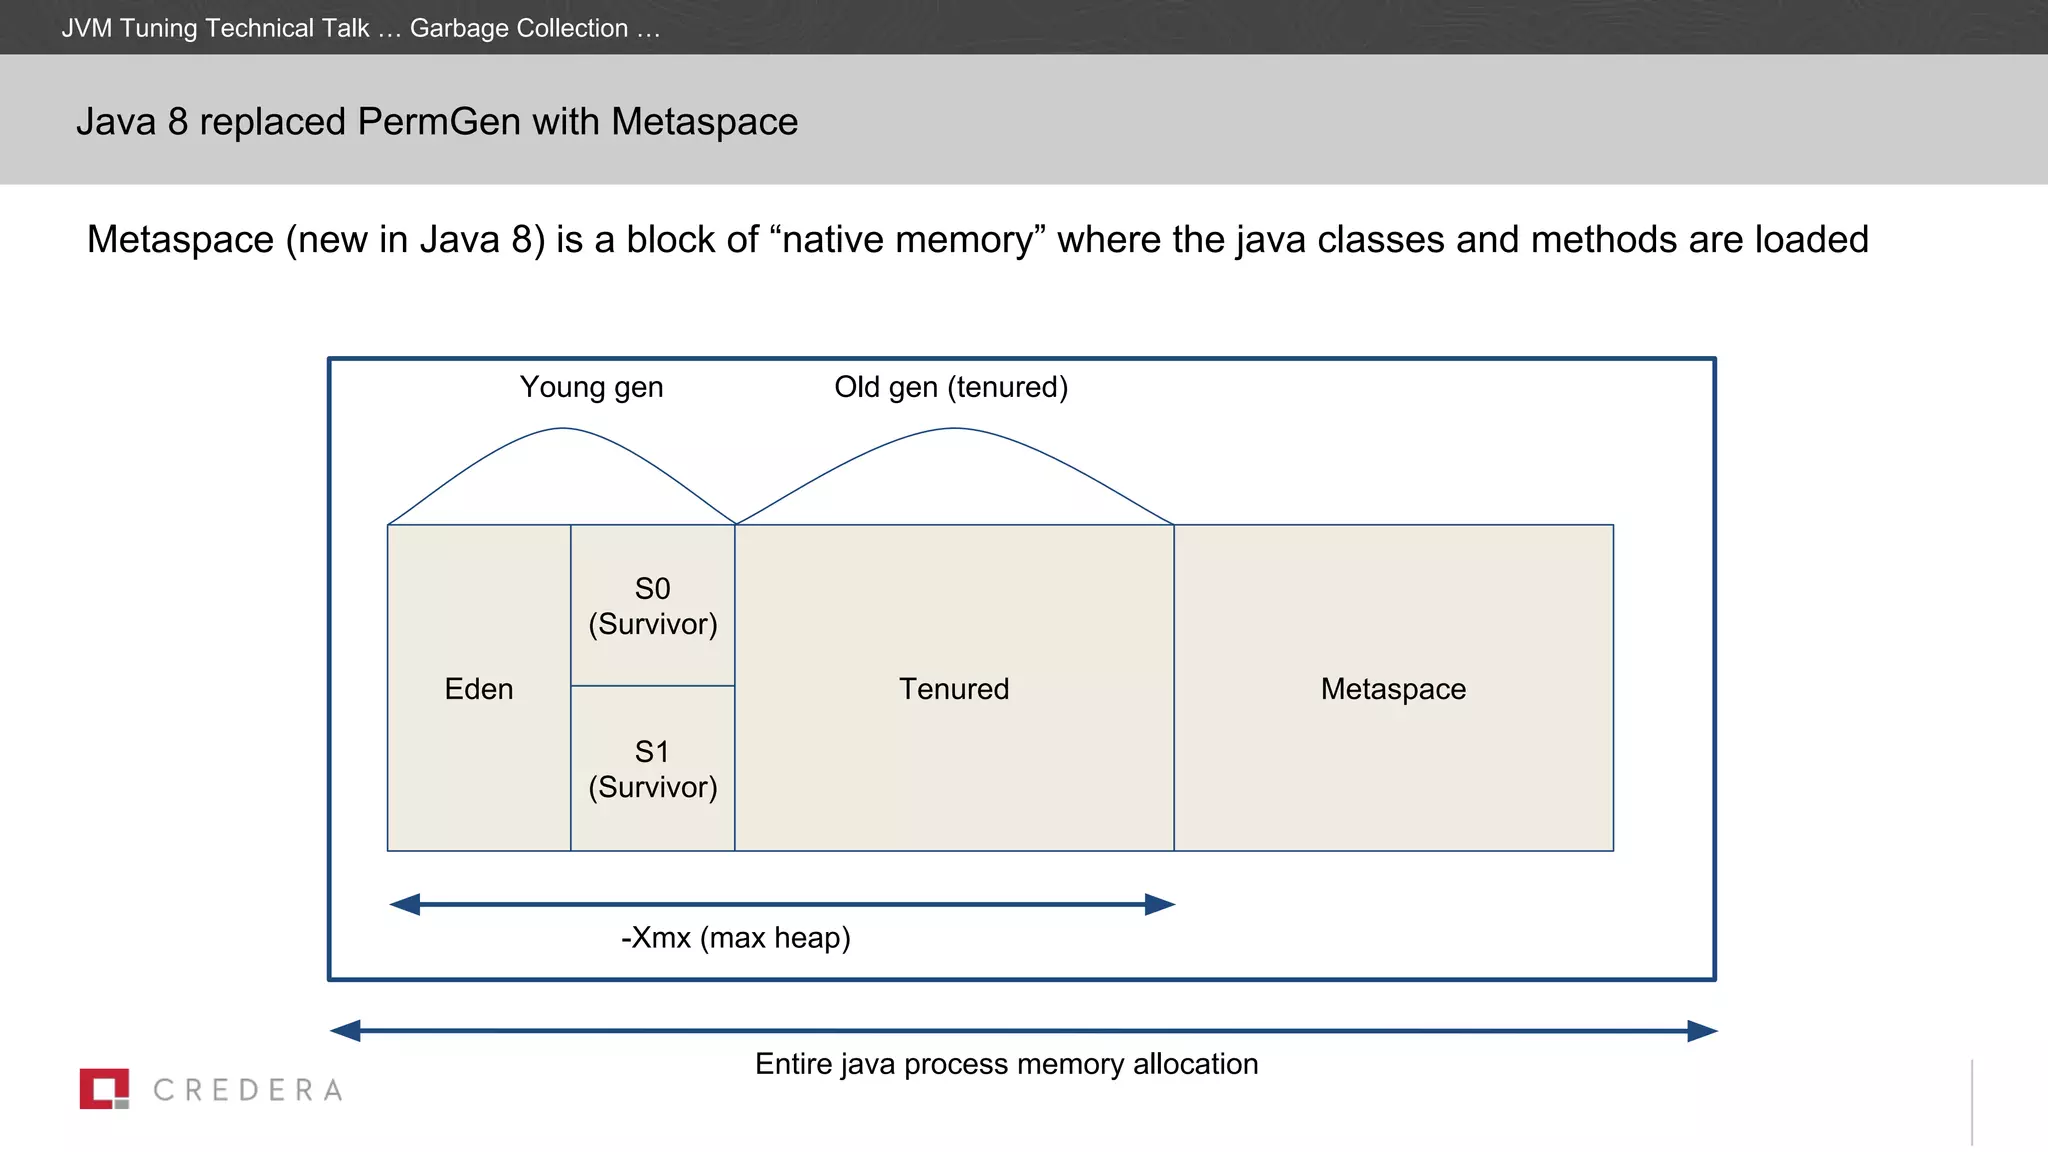
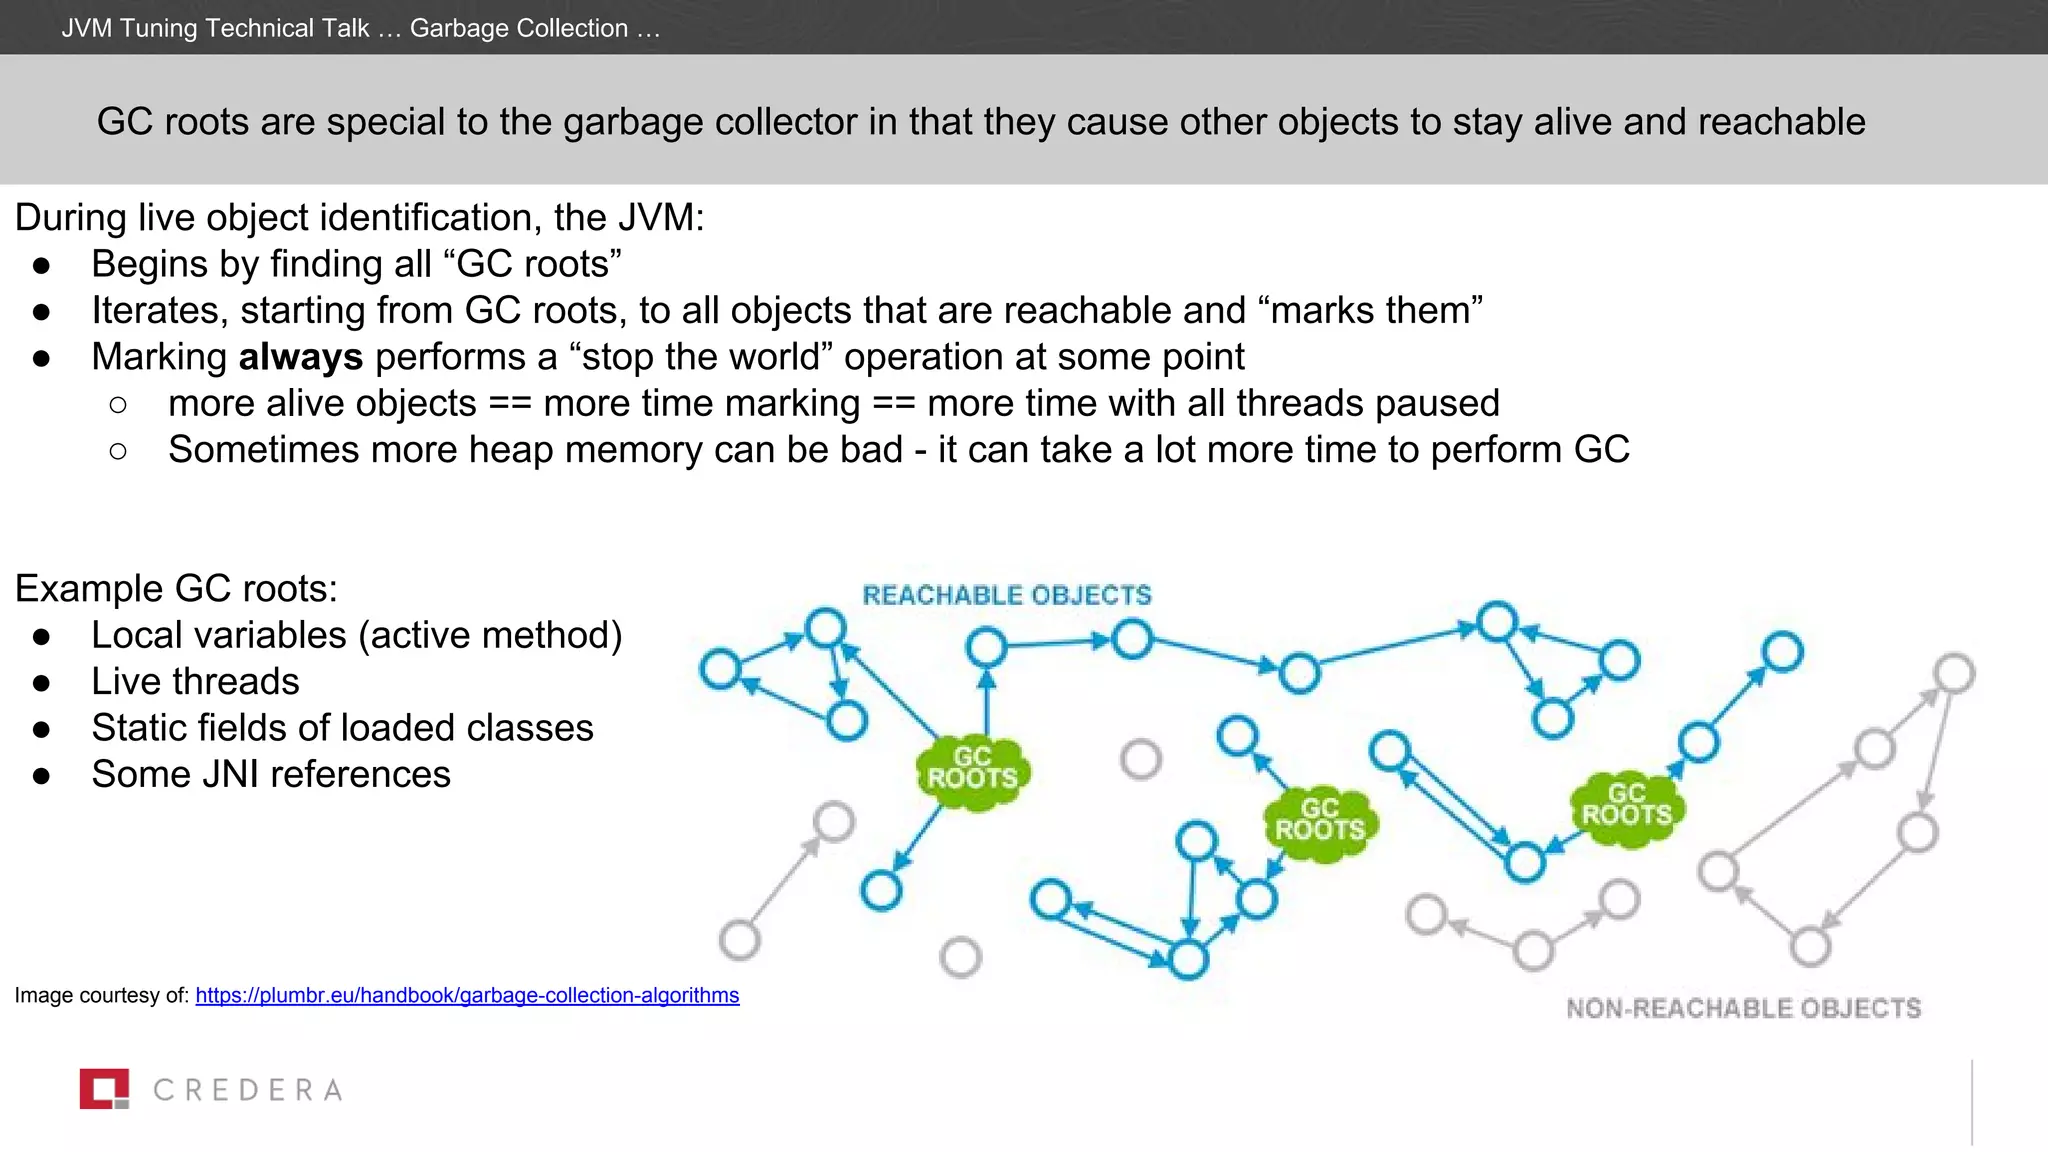
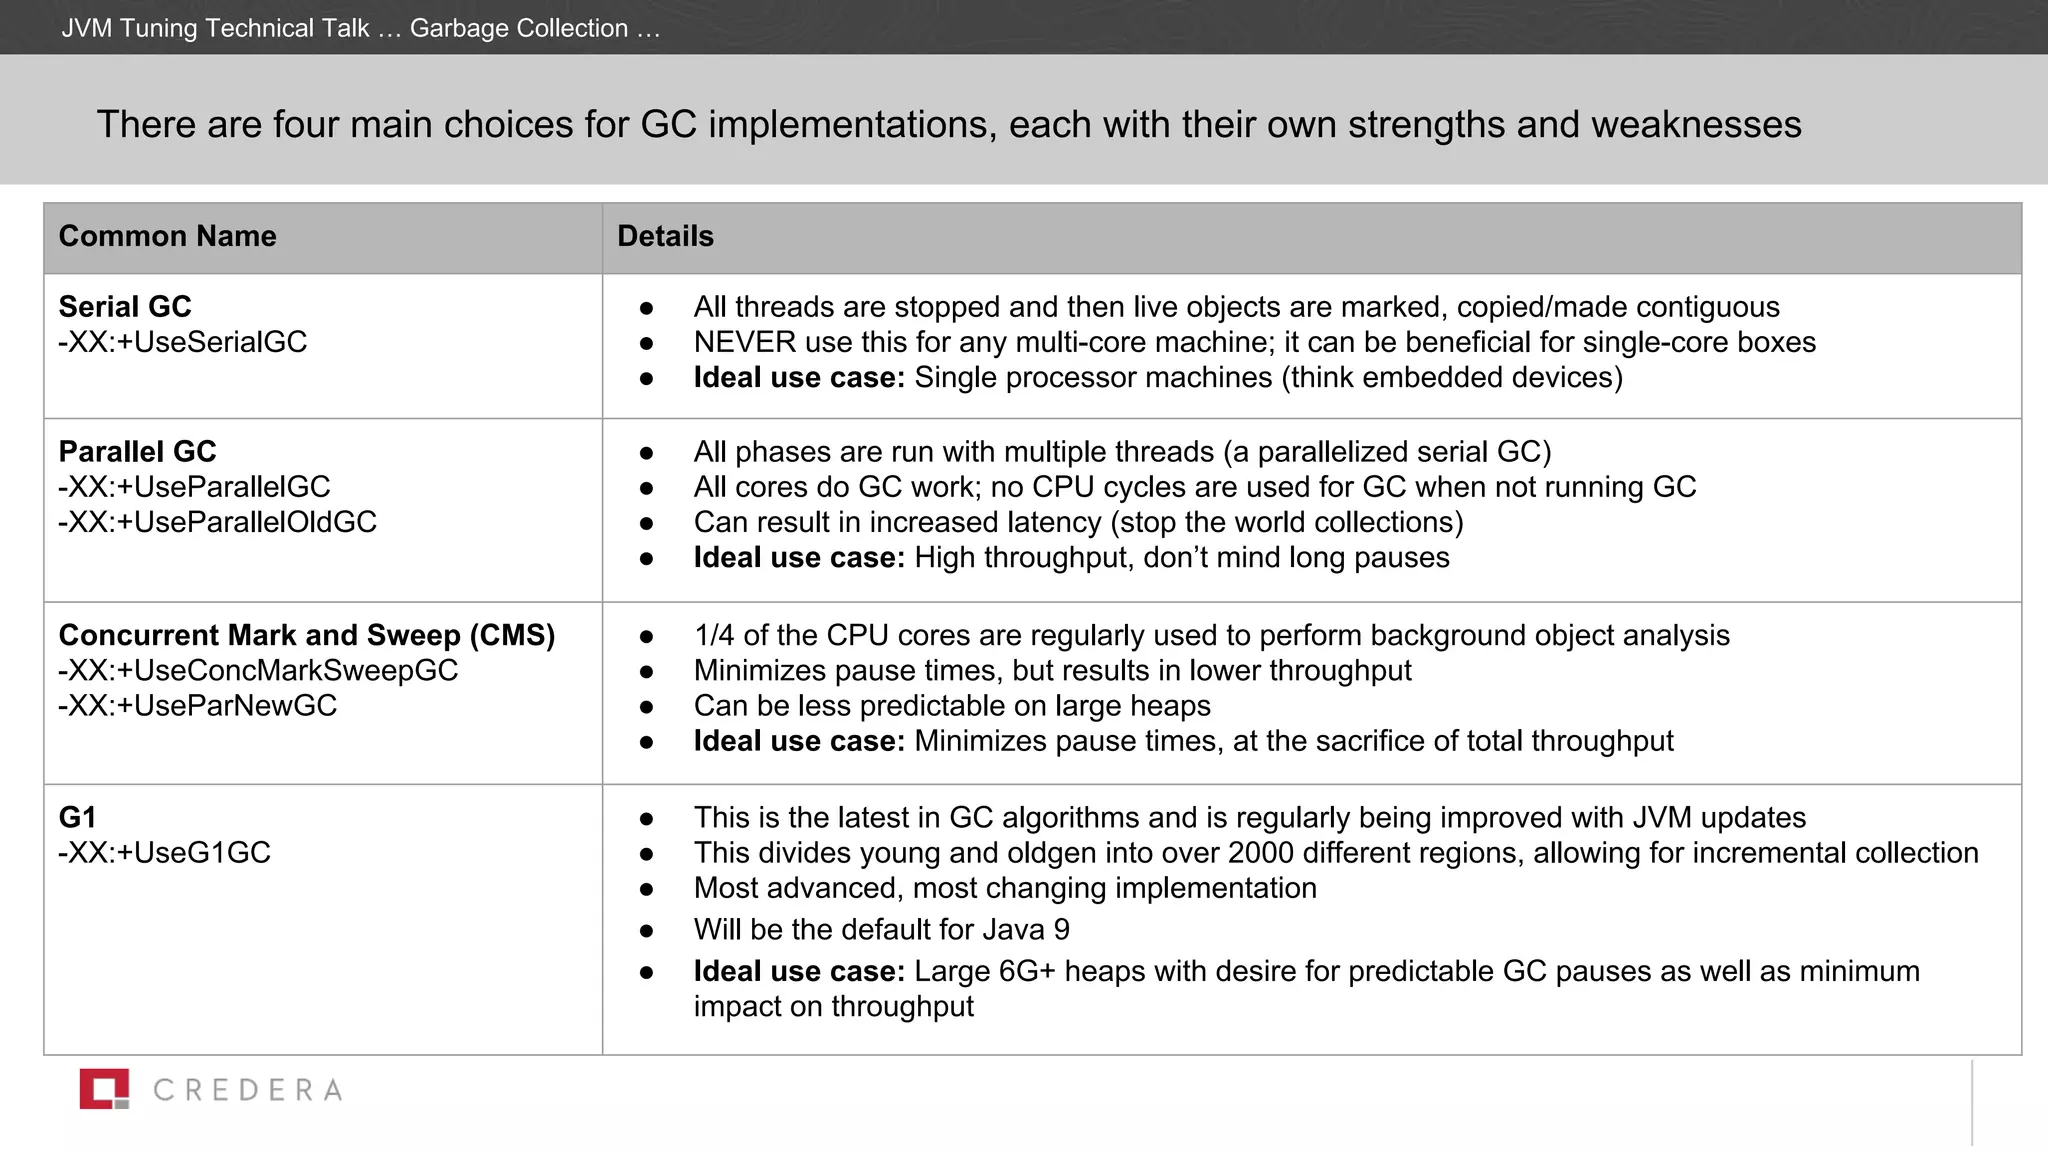
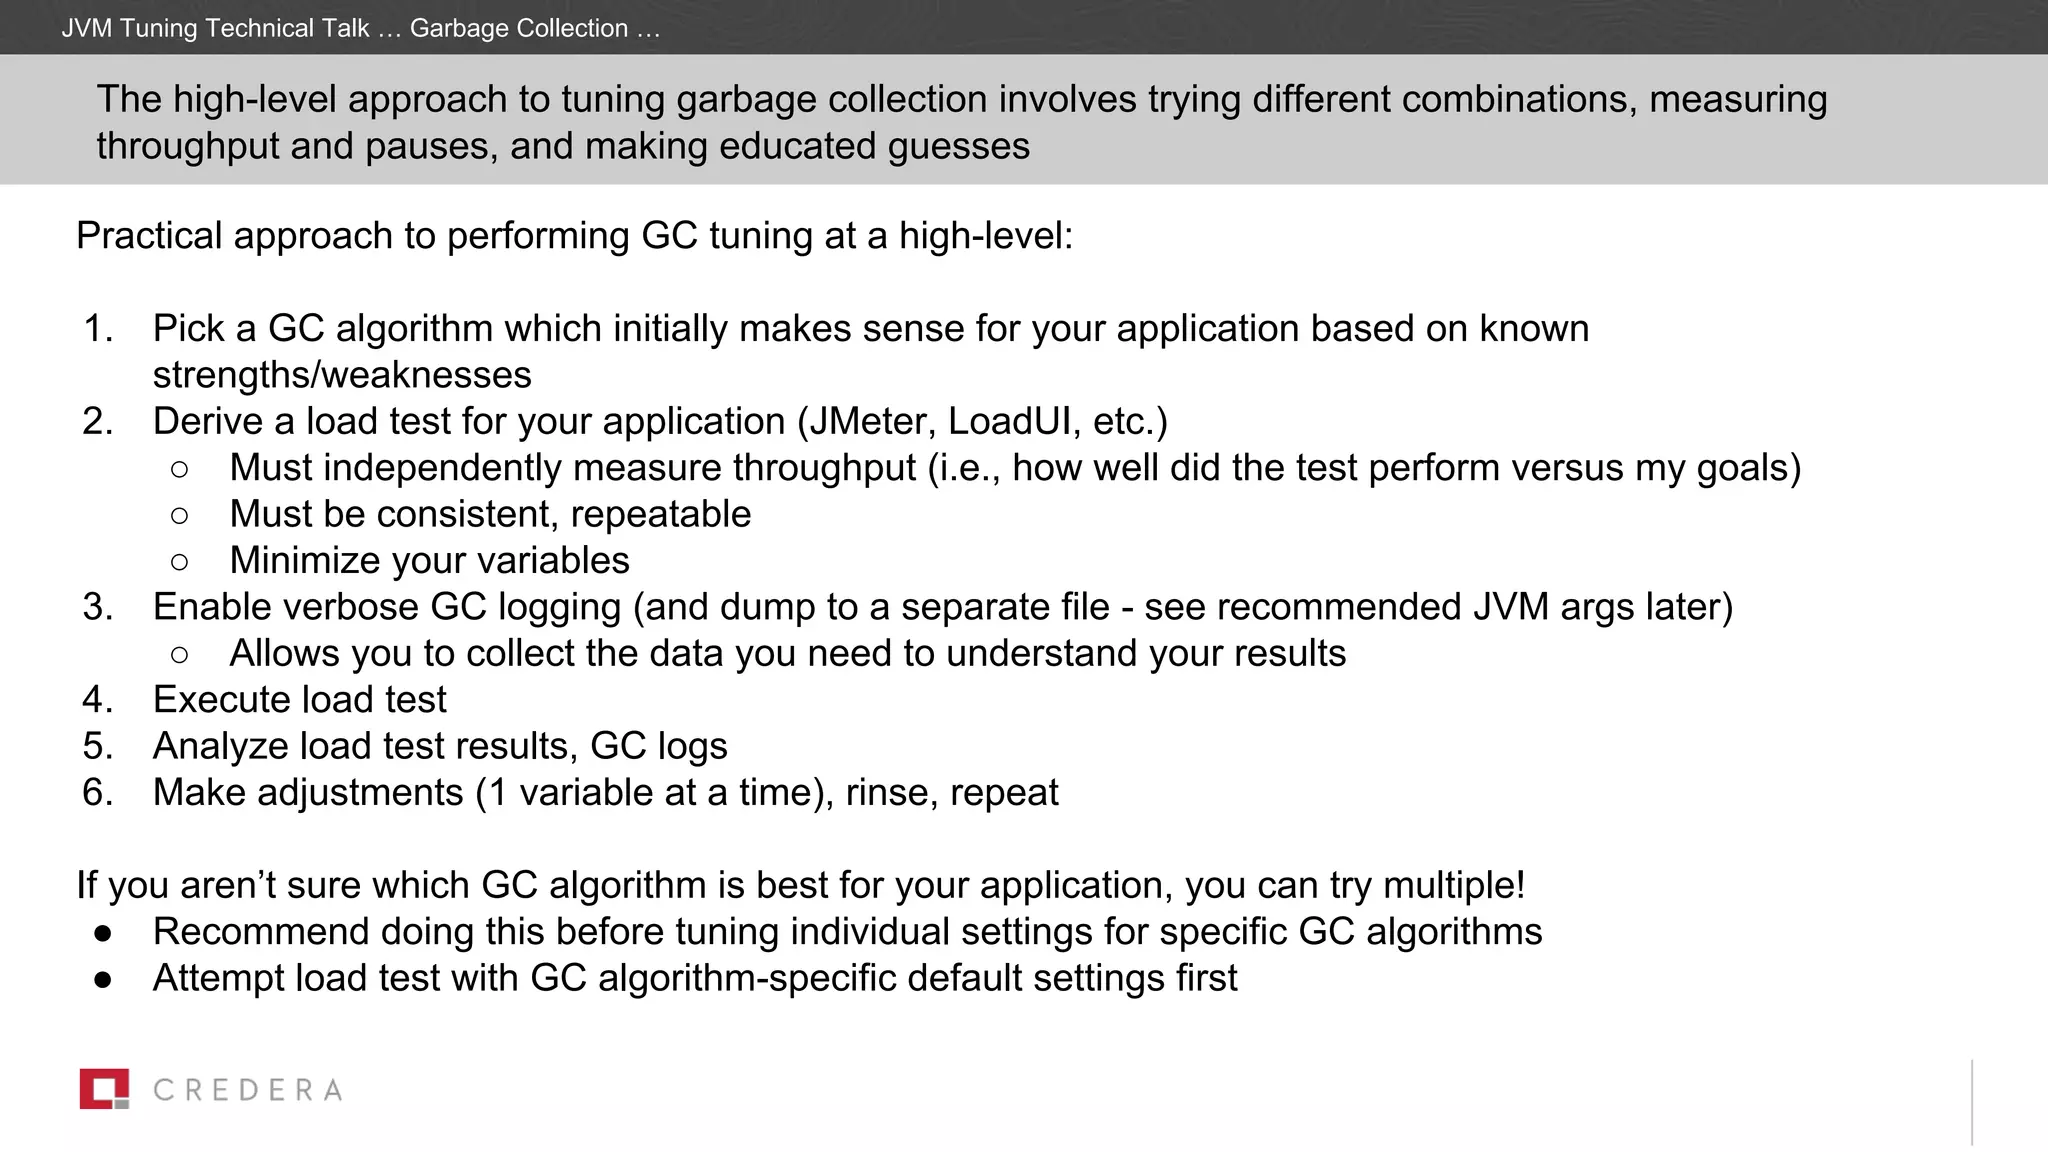
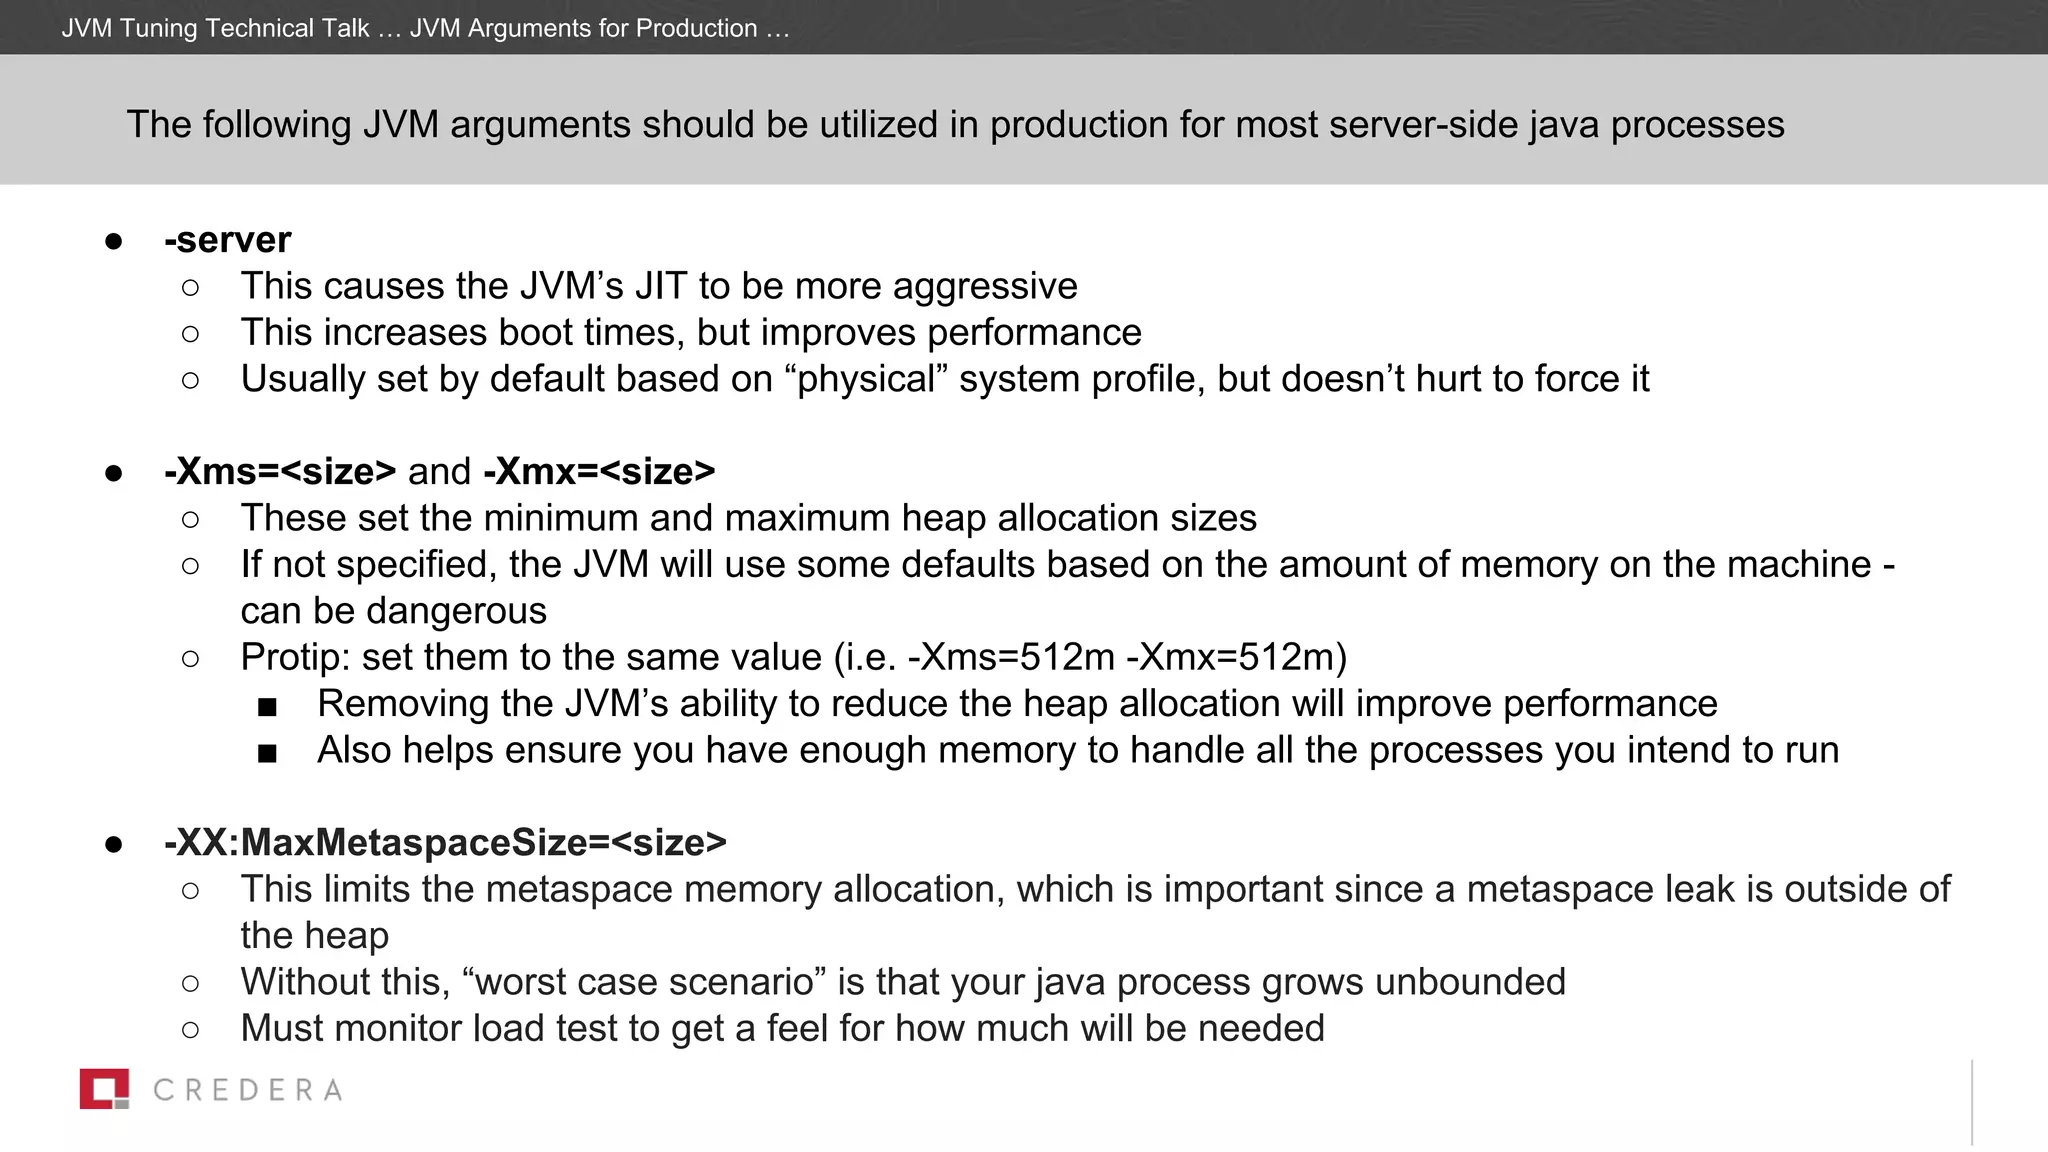
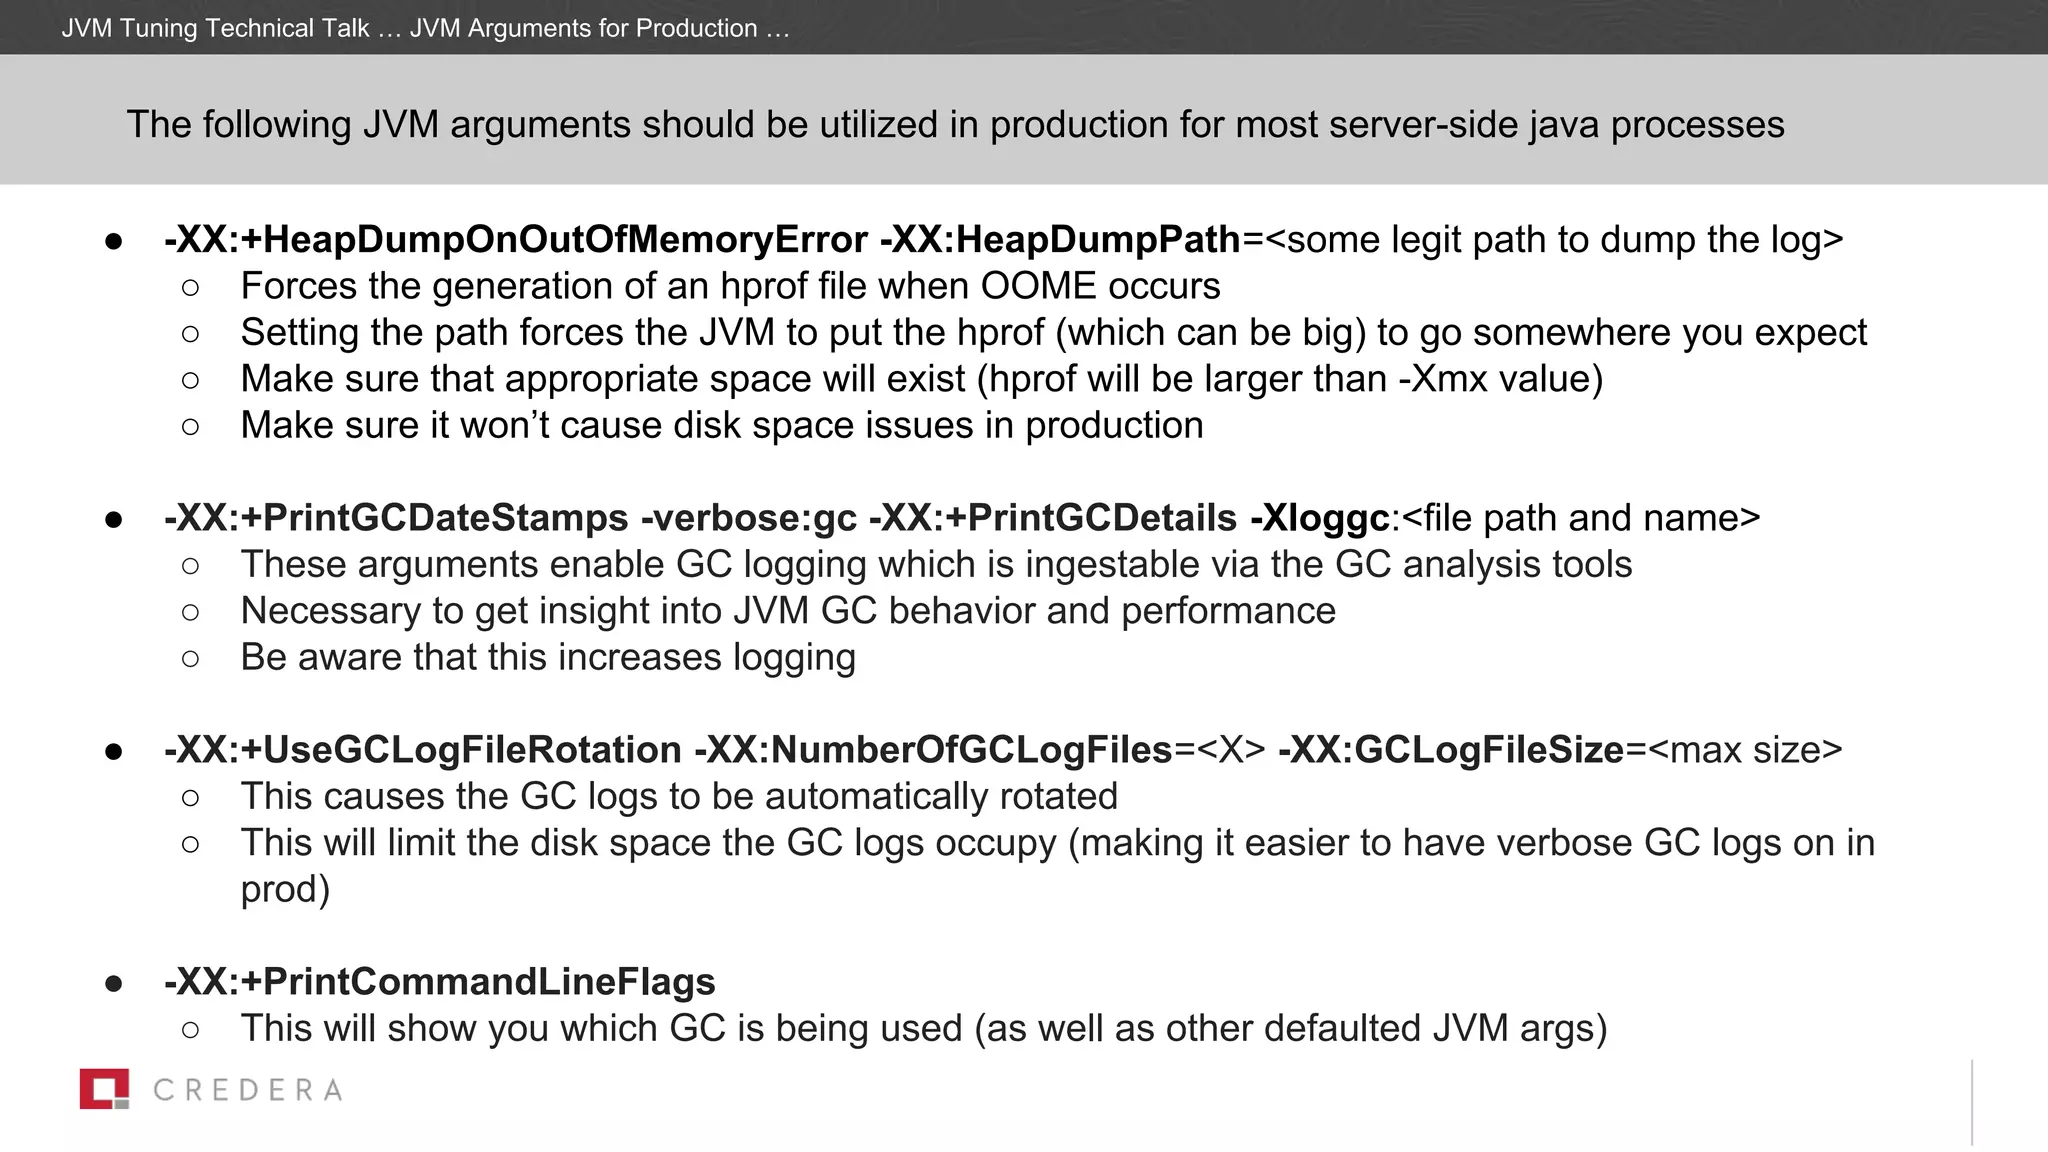
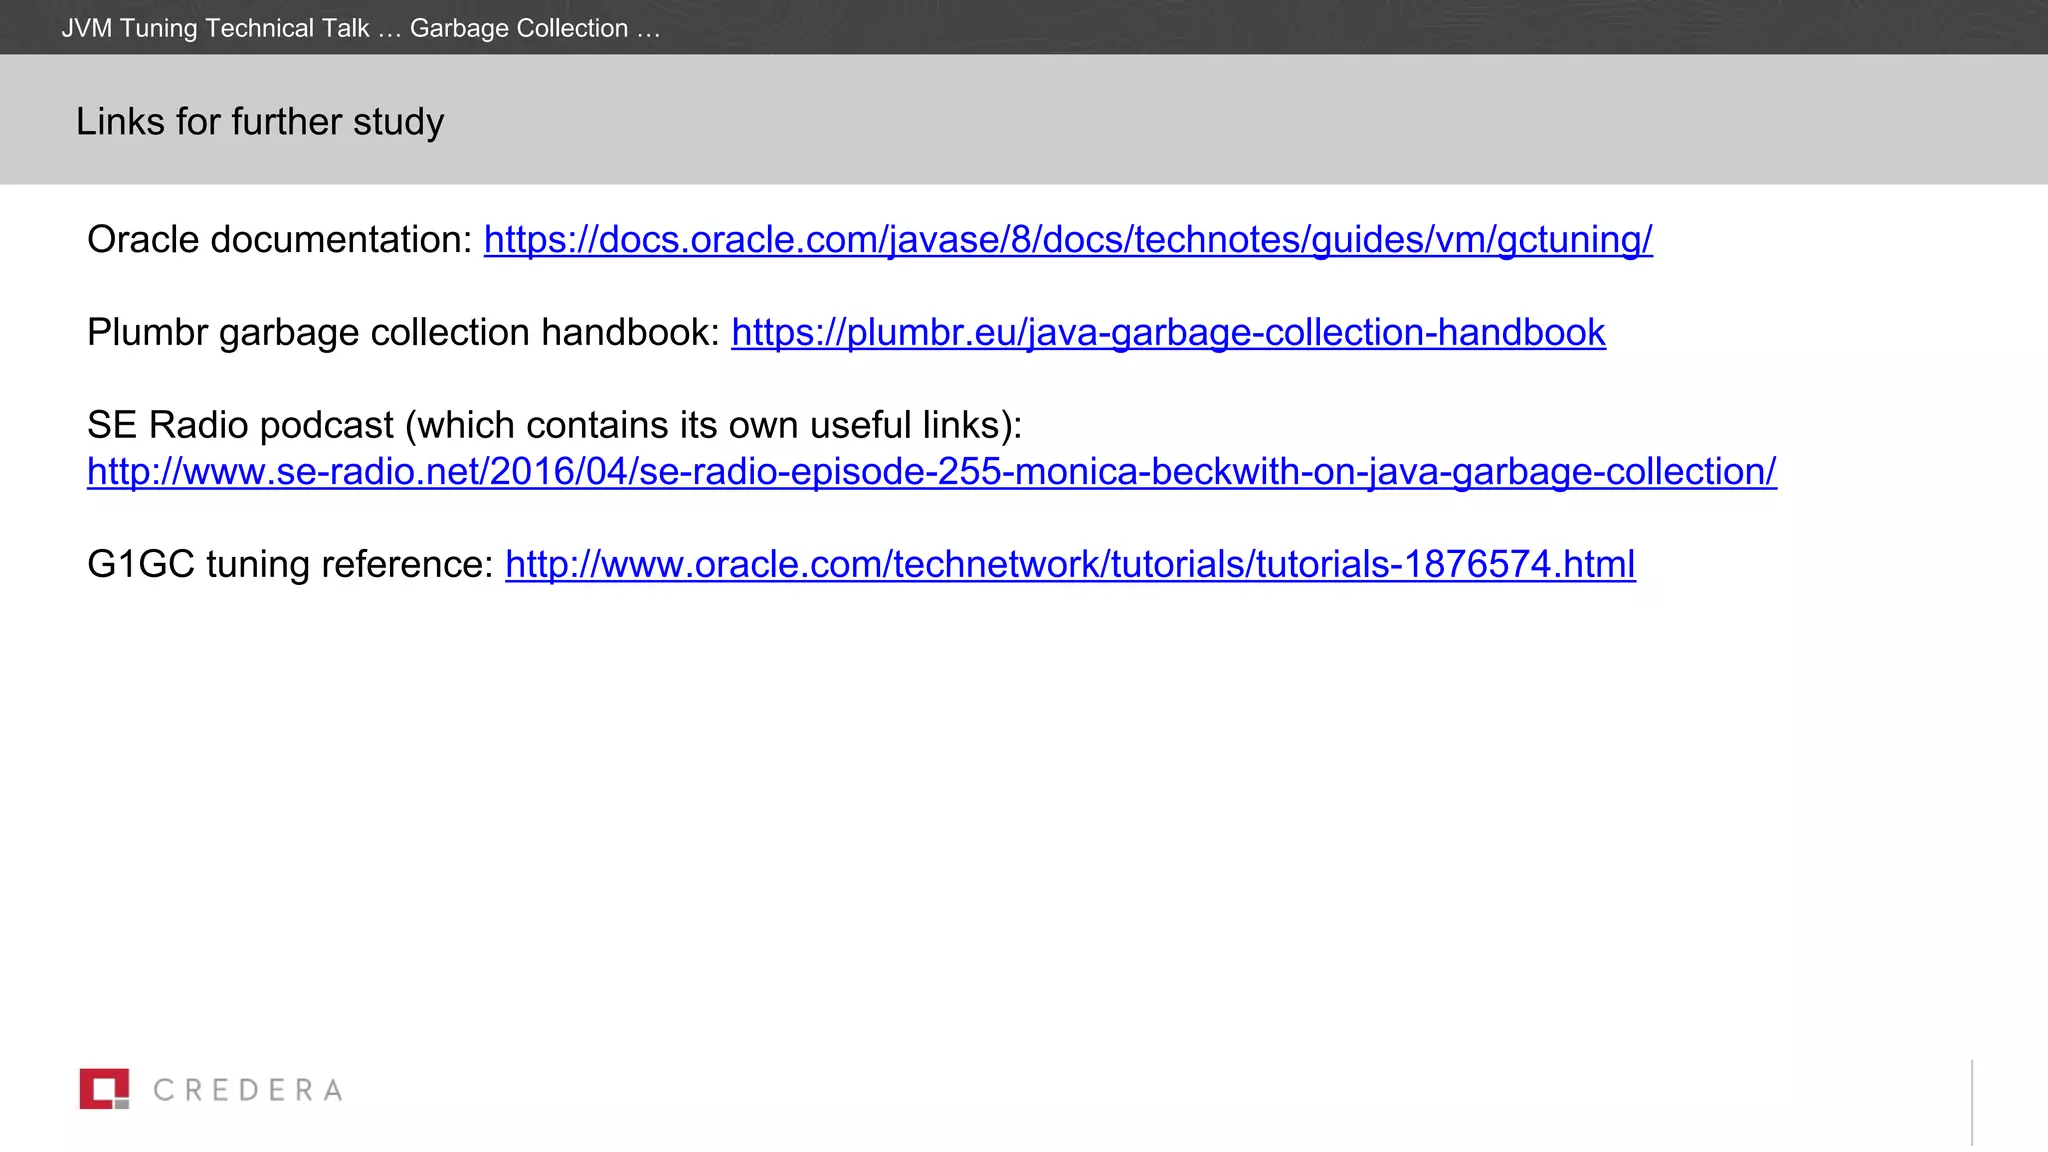
SlideShare a Scribd company logo
1 of 27
Discussion Document – Strictly Confidential & Proprietary
JVM Performance Tuning
August 2016
JVM Performance Tuning
● Overview
● Garbage Collection
○ Overview of how it works
○ Practical application
○ Recommendations for production
● JVM Profiling
○ Overview
○ Recommendations for production
○ Profiling demos
JVM Tuning Technical Talk … Agenda …
JVM Performance Tuning Technical Talk Agenda
Overview
Before we start...
Physical Server
Hypervisor
Operating System
JVM Process
Your code
Internet
Physical Server
Operating System
RDBMS
Your Schema/
Queries
Local Disk
Physical Server
Disk
Disk
DiskSAN
Storage
OS
Performance tuning requires looking at a complete picture of the system and addressing the right issues
(usually your code)
● Tuning the wrong component can have no
impact and can sometimes make things worse!
● This presentation is focused on the JVM -
others will follow...
JVM Tuning Technical Talk … Overview …
There are many implementations of the JVM in existence today, and it is important to be aware of what you
are working with because they may be tuned differently
• There are many JVM implementations in existence today (75+)
• 2 main implementations to be aware of:
– OpenJDK
▪ This is a completely open source JVM choice
▪ This is the default packaged JVM with many Linux distros
– HotSpot
▪ Currently owned by Oracle
▪ Based on OpenJDK, but includes in other implementations of various
pieces (some closed source)
– Other commercial JVMs exist: be aware which one you are running
▪ Running “java -version” will tell you
Reference: https://plumbr.eu/blog/java/java-version-and-vendor-data-analyzed-2016-edition
JVM Tuning Technical Talk … Overview …
Tuning your JVM can have a significant impact on application performance
• JVM Tuning - what and why?
– Involves using various tools to get more insight on what the JVM is doing “under the hood”
– Generally involves various command line arguments to tune behaviors primarily centered around
modifying garbage collection
– Garbage collection is expensive!
• When approaching JVM tuning, remember 2 things:
– Tuning your JVM can have a significant impact on application performance
– “Premature optimization is the root of all evil” - Donald Knuth
JVM Tuning Technical Talk … Overview …
Garbage Collection
Garbage collection “eliminates” the need for a programmer to have to manage memory themselves in code
● Trivial C++ example of manual memory management:
{
foo* f = new foo();
// Do interesting things with f
delete f; // you'll see that the object is destroyed.
}
● In Java, there is no “delete”
● The JVM shields the developer from the complexities of manual memory management
● The memory still needs to be reclaimed to become available for future use
● Garbage collection automatically identifies “dead objects” to reclaim the memory they occupy and make it
available again for future use
JVM Tuning Technical Talk … Garbage Collection …
Garbage collection is a form of automatic memory management which attempts to keep the developer from
doing it manually
JVM Tuning Technical Talk … Garbage Collection …
● “Generational hypothesis”: most objects survive for only
a short period of time
○ The majority of objects “die young”
○ GC can be typically be more efficiently performed
by focusing on collecting younger objects
● The JVM uses the concept of “generations” of an
object, based on analysis of how typical object
allocation/deallocation occurs over time
Common terms when tuning GC:
● Throughput - how much actual work your application
is doing (i.e. total time spent not doing GC)
● Pauses - Times your application appears unresponsive
due to performing GC
Reference: https://docs.oracle.com/javase/8/docs/technotes/guides/vm/gctuning/generations.html
GC algorithms in HotSpot/OpenJDK operate under the “generational hypothesis”
With the Java 8-based memory architecture, objects move
through the heap in stages
1. When objects are first created, they are allocated into eden
2. Once eden fills up, a GC event is triggered
○ Dead objects are effectively removed from eden
○ Surviving objects are moved into the survivor spaces
3. When a survivor space fill up, a GC event is triggered
○ Objects alternate between S0/S1 through GC
○ Objects which survive a certain number of GC passes
move to tenured
4. When oldgen/tenured fills up, a GC event is triggered
JVM Tuning Technical Talk … Garbage Collection …
JVM Memory management utilizes “generations” to bucket objects in memory based on their age
Eden
S0
(Survivor)
S1
(Survivor)
Tenured
Young gen Old gen (tenured)
-Xmx (max heap)
Different GC events:
● Minor GC - cleanup younggen
○ Happens when eden or survivor spaces fills up
○ Generally fast
● Major GC - cleanup oldgen
○ Generally takes longer (more objects to deal with)
● Full GC - cleanup both younggen and oldgen
Notes:
● Minor GC collections happen much more frequently - this
is how the generational hypothesis is implemented
● All of these GC events are “stop the world” operations at
some point during operation
JVM Tuning Technical Talk … Garbage Collection …
Three main types of GC events can occur to trigger the cleanup of dead objects and graduate live ones
Eden
S0
(Survivor)
S1
(Survivor)
Tenured
Young gen Old gen (tenured)
-Xmx (max heap)
○ “Stop the world” events cause ALL application threads to stop while the GC code does its work
● Different GC algorithms take different approaches in cleaning these spaces
○ Some algorithms do different parts of this concurrently
● GC tuning revolves around minimizing the occurrence and reducing the duration of these application
pauses
Metaspace (new in Java 8) is a block of “native memory” where the java classes and methods are loaded
JVM Tuning Technical Talk … Garbage Collection …
Java 8 replaced PermGen with Metaspace
Eden
S0
(Survivor)
S1
(Survivor)
Tenured
Young gen Old gen (tenured)
-Xmx (max heap)
Entire java process memory allocation
Metaspace
GC roots are special to the garbage collector in that they cause other objects to stay alive and reachable
During live object identification, the JVM:
● Begins by finding all “GC roots”
● Iterates, starting from GC roots, to all objects that are reachable and “marks them”
● Marking always performs a “stop the world” operation at some point
○ more alive objects == more time marking == more time with all threads paused
○ Sometimes more heap memory can be bad - it can take a lot more time to perform GC
Example GC roots:
● Local variables (active method)
● Live threads
● Static fields of loaded classes
● Some JNI references
Image courtesy of: https://plumbr.eu/handbook/garbage-collection-algorithms
JVM Tuning Technical Talk … Garbage Collection …
There are four main choices for GC implementations, each with their own strengths and weaknesses
Common Name Details
Serial GC
-XX:+UseSerialGC
● All threads are stopped and then live objects are marked, copied/made contiguous
● NEVER use this for any multi-core machine; it can be beneficial for single-core boxes
● Ideal use case: Single processor machines (think embedded devices)
Parallel GC
-XX:+UseParallelGC
-XX:+UseParallelOldGC
● All phases are run with multiple threads (a parallelized serial GC)
● All cores do GC work; no CPU cycles are used for GC when not running GC
● Can result in increased latency (stop the world collections)
● Ideal use case: High throughput, don’t mind long pauses
Concurrent Mark and Sweep (CMS)
-XX:+UseConcMarkSweepGC
-XX:+UseParNewGC
● 1/4 of the CPU cores are regularly used to perform background object analysis
● Minimizes pause times, but results in lower throughput
● Can be less predictable on large heaps
● Ideal use case: Minimizes pause times, at the sacrifice of total throughput
G1
-XX:+UseG1GC
● This is the latest in GC algorithms and is regularly being improved with JVM updates
● This divides young and oldgen into over 2000 different regions, allowing for incremental collection
● Most advanced, most changing implementation
● Will be the default for Java 9
● Ideal use case: Large 6G+ heaps with desire for predictable GC pauses as well as minimum
impact on throughput
JVM Tuning Technical Talk … Garbage Collection …
Garbage Collection:
Practical Application
The high-level approach to tuning garbage collection involves trying different combinations, measuring
throughput and pauses, and making educated guesses
Practical approach to performing GC tuning at a high-level:
1. Pick a GC algorithm which initially makes sense for your application based on known
strengths/weaknesses
2. Derive a load test for your application (JMeter, LoadUI, etc.)
○ Must independently measure throughput (i.e., how well did the test perform versus my goals)
○ Must be consistent, repeatable
○ Minimize your variables
3. Enable verbose GC logging (and dump to a separate file - see recommended JVM args later)
○ Allows you to collect the data you need to understand your results
4. Execute load test
5. Analyze load test results, GC logs
6. Make adjustments (1 variable at a time), rinse, repeat
If you aren’t sure which GC algorithm is best for your application, you can try multiple!
● Recommend doing this before tuning individual settings for specific GC algorithms
● Attempt load test with GC algorithm-specific default settings first
JVM Tuning Technical Talk … Garbage Collection …
● GCHisto
○ Allows for visual analysis of verbose GC logs
○ Free, originally a plugin for VisualVM
○ https://github.com/jewes/gchisto
● GCViewer
○ Allows for visual analysis of verbose GC logs similar to GCHisto
○ https://github.com/chewiebug/GCViewer/wiki
● JConsole
○ Free, shipped with the JDK
○ Can use JMX connection to get access to and insight about a running JVM “on the fly”
○ Gives you insight into current memory usage and GC
○ Can be used to view and manipulate specifically exposed data within the JVM on the fly without
restarting the process (future talk)
There are a few useful tools to help analyze garbage collection performance
JVM Tuning Technical Talk … Garbage Collection …
JVM Profiling
JVM Tuning Technical Talk … JVM Profiling …
A Java process can be inspected to get insight on data related to performance and memory usage
Main goals around JVM profiling:
● Analyze code behavior
○ Inspect individual method execution invocation counts and and durations
○ Inspect individual thread states
○ Can be used to help find your performance bottlenecks
● Analyze memory usage
○ Every object in the heap is available for inspection
○ Identify GC roots (or lack thereof) for each object
These things can be done in real-time via attaching a profiler, or offline inspecting data files:
○ thread dump file
■ The state of all the threads in the application
○ hprof file
■ Snapshot of everything in the JVM heap with other useful metadata
■ Can be generated via: JConsole, JVisualVM, jmap, etc.
■ hprof files can be generated automatically on OutOfMemoryErrors - *** very useful ***
JVM Tuning Technical Talk … JVM Profiling …
Profiling is made available locally and remotely via different mechanisms and it is important to understand
how you get access to this information
Your profiling tools are running in different processes than your target JVMs
● They can even be on different machines
● It is important to be aware of these boundaries
● The profiling tools can connect via a socket connection - be aware of firewall rules, etc.
JVM monitoring connection options:
● jstatd
○ this is a standalone daemon process which needs to be running on the same machine as the JVM
you want to monitor/manage
○ This requires starting jstatd on the machine you want to get access to
○ Monitoring capabilities are limited
○ Can be useful in the case where you don’t have JMX enabled and can’t restart your process
● JMX
○ More powerful access to the JVM
○ Requires starting your target java process with some command line arguments
○ This is enabled by default on Java 6+ locally
■ Be warned - if the target process isn’t running as the same user or JVM as the monitoring tool,
they won’t find each other unless you explicitly define ports
●
● VisualVM
○ Free, shipped with the JDK
○ Allows for deep insight into the performance of a given JVM
○ Will demo this today
● YourKit
○ Has many useful features above and beyond VisualVM, but usually not necessary
○ https://www.yourkit.com/java/profiler/
○ Paid commercial tool with free trial period
● JProfiler
○ Has a graphical representation of call stacks, can be easier to navigate
○ Paid commercial tool
It’s demo time!!!
There are a plethora of tools available for getting insight into JVM activities and performance
JVM Tuning Technical Talk … JVM Profiling …
● Many other command line tools are shipped with the JDK
○ jmap - can be used to force a heap dump from a running JVM
○ jstatd - allows remote access to already running JVMs
○ http://docs.oracle.com/javase/8/docs/technotes/tools/
JVM Tuning Technical Talk … JVM Tuning Tools …
Other notable tools available for getting insight into and analysis of JVM performance
JVM Configuration for
Production
● -server
○ This causes the JVM’s JIT to be more aggressive
○ This increases boot times, but improves performance
○ Usually set by default based on “physical” system profile, but doesn’t hurt to force it
● -Xms=<size> and -Xmx=<size>
○ These set the minimum and maximum heap allocation sizes
○ If not specified, the JVM will use some defaults based on the amount of memory on the machine -
can be dangerous
○ Protip: set them to the same value (i.e. -Xms=512m -Xmx=512m)
■ Removing the JVM’s ability to reduce the heap allocation will improve performance
■ Also helps ensure you have enough memory to handle all the processes you intend to run
● -XX:MaxMetaspaceSize=<size>
○ This limits the metaspace memory allocation, which is important since a metaspace leak is outside of
the heap
○ Without this, “worst case scenario” is that your java process grows unbounded
○ Must monitor load test to get a feel for how much will be needed
JVM Tuning Technical Talk … JVM Arguments for Production …
The following JVM arguments should be utilized in production for most server-side java processes
● -XX:+HeapDumpOnOutOfMemoryError -XX:HeapDumpPath=<some legit path to dump the log>
○ Forces the generation of an hprof file when OOME occurs
○ Setting the path forces the JVM to put the hprof (which can be big) to go somewhere you expect
○ Make sure that appropriate space will exist (hprof will be larger than -Xmx value)
○ Make sure it won’t cause disk space issues in production
● -XX:+PrintGCDateStamps -verbose:gc -XX:+PrintGCDetails -Xloggc:<file path and name>
○ These arguments enable GC logging which is ingestable via the GC analysis tools
○ Necessary to get insight into JVM GC behavior and performance
○ Be aware that this increases logging
● -XX:+UseGCLogFileRotation -XX:NumberOfGCLogFiles=<X> -XX:GCLogFileSize=<max size>
○ This causes the GC logs to be automatically rotated
○ This will limit the disk space the GC logs occupy (making it easier to have verbose GC logs on in
prod)
● -XX:+PrintCommandLineFlags
○ This will show you which GC is being used (as well as other defaulted JVM args)
JVM Tuning Technical Talk … JVM Arguments for Production …
The following JVM arguments should be utilized in production for most server-side java processes
Oracle documentation: https://docs.oracle.com/javase/8/docs/technotes/guides/vm/gctuning/
Plumbr garbage collection handbook: https://plumbr.eu/java-garbage-collection-handbook
SE Radio podcast (which contains its own useful links):
http://www.se-radio.net/2016/04/se-radio-episode-255-monica-beckwith-on-java-garbage-collection/
G1GC tuning reference: http://www.oracle.com/technetwork/tutorials/tutorials-1876574.html
JVM Tuning Technical Talk … Garbage Collection …
Links for further study

More Related Content

What's hot

Choosing Right Garbage Collector to Increase Efficiency of Java Memory Usage
Choosing Right Garbage Collector to Increase Efficiency of Java Memory UsageChoosing Right Garbage Collector to Increase Efficiency of Java Memory Usage
Choosing Right Garbage Collector to Increase Efficiency of Java Memory UsageJelastic Multi-Cloud PaaS
 
HBase Tales From the Trenches - Short stories about most common HBase operati...
HBase Tales From the Trenches - Short stories about most common HBase operati...HBase Tales From the Trenches - Short stories about most common HBase operati...
HBase Tales From the Trenches - Short stories about most common HBase operati...DataWorks Summit
 
Distributed applications using Hazelcast
Distributed applications using HazelcastDistributed applications using Hazelcast
Distributed applications using HazelcastTaras Matyashovsky
 
Testes em uma arquitetura com messageria/streaming (Kafka)
Testes em uma arquitetura com messageria/streaming (Kafka)Testes em uma arquitetura com messageria/streaming (Kafka)
Testes em uma arquitetura com messageria/streaming (Kafka)Robson Agapito Correa
 
Java11 New Features
Java11 New FeaturesJava11 New Features
Java11 New FeaturesHaim Michael
 
Comparing Native Java REST API Frameworks - Seattle JUG 2022
Comparing Native Java REST API Frameworks - Seattle JUG 2022Comparing Native Java REST API Frameworks - Seattle JUG 2022
Comparing Native Java REST API Frameworks - Seattle JUG 2022Matt Raible
 
[오픈소스컨설팅] 스카우터 사용자 가이드 2020
[오픈소스컨설팅] 스카우터 사용자 가이드 2020[오픈소스컨설팅] 스카우터 사용자 가이드 2020
[오픈소스컨설팅] 스카우터 사용자 가이드 2020Ji-Woong Choi
 
JMeter - Performance testing your webapp
JMeter - Performance testing your webappJMeter - Performance testing your webapp
JMeter - Performance testing your webappAmit Solanki
 
How Netflix Tunes EC2 Instances for Performance
How Netflix Tunes EC2 Instances for PerformanceHow Netflix Tunes EC2 Instances for Performance
How Netflix Tunes EC2 Instances for PerformanceBrendan Gregg
 
LMAX Disruptor - High Performance Inter-Thread Messaging Library
LMAX Disruptor - High Performance Inter-Thread Messaging LibraryLMAX Disruptor - High Performance Inter-Thread Messaging Library
LMAX Disruptor - High Performance Inter-Thread Messaging LibrarySebastian Andrasoni
 
How to go about testing in React?
How to go about testing in React? How to go about testing in React?
How to go about testing in React? Lisa Gagarina
 
우아한 모노리스
우아한 모노리스우아한 모노리스
우아한 모노리스Arawn Park
 
Version Control with Git
Version Control with GitVersion Control with Git
Version Control with GitLuigi De Russis
 
Time to-live: How to Perform Automatic State Cleanup in Apache Flink - Andrey...
Time to-live: How to Perform Automatic State Cleanup in Apache Flink - Andrey...Time to-live: How to Perform Automatic State Cleanup in Apache Flink - Andrey...
Time to-live: How to Perform Automatic State Cleanup in Apache Flink - Andrey...Flink Forward
 
GraalVM Overview Compact version
GraalVM Overview Compact versionGraalVM Overview Compact version
GraalVM Overview Compact versionscalaconfjp
 
Test de logiciels
Test de logiciels Test de logiciels
Test de logiciels Bilel Abed
 
[215] Druid로 쉽고 빠르게 데이터 분석하기
[215] Druid로 쉽고 빠르게 데이터 분석하기[215] Druid로 쉽고 빠르게 데이터 분석하기
[215] Druid로 쉽고 빠르게 데이터 분석하기NAVER D2
 

What's hot (20)

Choosing Right Garbage Collector to Increase Efficiency of Java Memory Usage
Choosing Right Garbage Collector to Increase Efficiency of Java Memory UsageChoosing Right Garbage Collector to Increase Efficiency of Java Memory Usage
Choosing Right Garbage Collector to Increase Efficiency of Java Memory Usage
 
JVM++: The Graal VM
JVM++: The Graal VMJVM++: The Graal VM
JVM++: The Graal VM
 
HBase Tales From the Trenches - Short stories about most common HBase operati...
HBase Tales From the Trenches - Short stories about most common HBase operati...HBase Tales From the Trenches - Short stories about most common HBase operati...
HBase Tales From the Trenches - Short stories about most common HBase operati...
 
Distributed applications using Hazelcast
Distributed applications using HazelcastDistributed applications using Hazelcast
Distributed applications using Hazelcast
 
Testes em uma arquitetura com messageria/streaming (Kafka)
Testes em uma arquitetura com messageria/streaming (Kafka)Testes em uma arquitetura com messageria/streaming (Kafka)
Testes em uma arquitetura com messageria/streaming (Kafka)
 
Java11 New Features
Java11 New FeaturesJava11 New Features
Java11 New Features
 
Comparing Native Java REST API Frameworks - Seattle JUG 2022
Comparing Native Java REST API Frameworks - Seattle JUG 2022Comparing Native Java REST API Frameworks - Seattle JUG 2022
Comparing Native Java REST API Frameworks - Seattle JUG 2022
 
[오픈소스컨설팅] 스카우터 사용자 가이드 2020
[오픈소스컨설팅] 스카우터 사용자 가이드 2020[오픈소스컨설팅] 스카우터 사용자 가이드 2020
[오픈소스컨설팅] 스카우터 사용자 가이드 2020
 
JMeter - Performance testing your webapp
JMeter - Performance testing your webappJMeter - Performance testing your webapp
JMeter - Performance testing your webapp
 
How Netflix Tunes EC2 Instances for Performance
How Netflix Tunes EC2 Instances for PerformanceHow Netflix Tunes EC2 Instances for Performance
How Netflix Tunes EC2 Instances for Performance
 
Jenkins
JenkinsJenkins
Jenkins
 
LMAX Disruptor - High Performance Inter-Thread Messaging Library
LMAX Disruptor - High Performance Inter-Thread Messaging LibraryLMAX Disruptor - High Performance Inter-Thread Messaging Library
LMAX Disruptor - High Performance Inter-Thread Messaging Library
 
How to go about testing in React?
How to go about testing in React? How to go about testing in React?
How to go about testing in React?
 
우아한 모노리스
우아한 모노리스우아한 모노리스
우아한 모노리스
 
Version Control with Git
Version Control with GitVersion Control with Git
Version Control with Git
 
Apache jMeter
Apache jMeterApache jMeter
Apache jMeter
 
Time to-live: How to Perform Automatic State Cleanup in Apache Flink - Andrey...
Time to-live: How to Perform Automatic State Cleanup in Apache Flink - Andrey...Time to-live: How to Perform Automatic State Cleanup in Apache Flink - Andrey...
Time to-live: How to Perform Automatic State Cleanup in Apache Flink - Andrey...
 
GraalVM Overview Compact version
GraalVM Overview Compact versionGraalVM Overview Compact version
GraalVM Overview Compact version
 
Test de logiciels
Test de logiciels Test de logiciels
Test de logiciels
 
[215] Druid로 쉽고 빠르게 데이터 분석하기
[215] Druid로 쉽고 빠르게 데이터 분석하기[215] Druid로 쉽고 빠르게 데이터 분석하기
[215] Druid로 쉽고 빠르게 데이터 분석하기
 

Similar to JVM Performance Tuning

Software Profiling: Java Performance, Profiling and Flamegraphs
Software Profiling: Java Performance, Profiling and FlamegraphsSoftware Profiling: Java Performance, Profiling and Flamegraphs
Software Profiling: Java Performance, Profiling and FlamegraphsIsuru Perera
 
Elastic JVM for Scalable Java EE Applications Running in Containers #Jakart...
Elastic JVM  for Scalable Java EE Applications  Running in Containers #Jakart...Elastic JVM  for Scalable Java EE Applications  Running in Containers #Jakart...
Elastic JVM for Scalable Java EE Applications Running in Containers #Jakart...Jelastic Multi-Cloud PaaS
 
Quick introduction to Java Garbage Collector (JVM GC)
Quick introduction to Java Garbage Collector (JVM GC)Quick introduction to Java Garbage Collector (JVM GC)
Quick introduction to Java Garbage Collector (JVM GC)Marcos García
 
Jvm problem diagnostics
Jvm problem diagnosticsJvm problem diagnostics
Jvm problem diagnosticsDanijel Mitar
 
Garbage Collection, Tuning And Monitoring JVM In EBS 11i And R12
Garbage Collection, Tuning And Monitoring JVM In EBS 11i And R12Garbage Collection, Tuning And Monitoring JVM In EBS 11i And R12
Garbage Collection, Tuning And Monitoring JVM In EBS 11i And R12sidg75
 
Java Performance and Using Java Flight Recorder
Java Performance and Using Java Flight RecorderJava Performance and Using Java Flight Recorder
Java Performance and Using Java Flight RecorderIsuru Perera
 
Software Profiling: Understanding Java Performance and how to profile in Java
Software Profiling: Understanding Java Performance and how to profile in JavaSoftware Profiling: Understanding Java Performance and how to profile in Java
Software Profiling: Understanding Java Performance and how to profile in JavaIsuru Perera
 
Performance tuning jvm
Performance tuning jvmPerformance tuning jvm
Performance tuning jvmPrem Kuppumani
 
Java performance monitoring
Java performance monitoringJava performance monitoring
Java performance monitoringSimon Ritter
 
Вячеслав Блинов «Java Garbage Collection: A Performance Impact»
Вячеслав Блинов «Java Garbage Collection: A Performance Impact»Вячеслав Блинов «Java Garbage Collection: A Performance Impact»
Вячеслав Блинов «Java Garbage Collection: A Performance Impact»Anna Shymchenko
 
Garbage collection
Garbage collectionGarbage collection
Garbage collectionMudit Gupta
 
State of Java Elasticity. Tuning Java Efficiency - GIDS.JAVA LIVE 2020
State of Java Elasticity. Tuning Java Efficiency - GIDS.JAVA LIVE 2020State of Java Elasticity. Tuning Java Efficiency - GIDS.JAVA LIVE 2020
State of Java Elasticity. Tuning Java Efficiency - GIDS.JAVA LIVE 2020Jelastic Multi-Cloud PaaS
 
The JVM is your friend
The JVM is your friendThe JVM is your friend
The JVM is your friendKai Koenig
 
Java Performance and Profiling
Java Performance and ProfilingJava Performance and Profiling
Java Performance and ProfilingWSO2
 
Profiler Guided Java Performance Tuning
Profiler Guided Java Performance TuningProfiler Guided Java Performance Tuning
Profiler Guided Java Performance Tuningosa_ora
 
Introduction of Java GC Tuning and Java Java Mission Control
Introduction of Java GC Tuning and Java Java Mission ControlIntroduction of Java GC Tuning and Java Java Mission Control
Introduction of Java GC Tuning and Java Java Mission ControlLeon Chen
 
Tuning Java for Big Data
Tuning Java for Big DataTuning Java for Big Data
Tuning Java for Big DataScott Seighman
 
Garbage First and you
Garbage First and youGarbage First and you
Garbage First and youKai Koenig
 
Garbage First and You!
Garbage First and You!Garbage First and You!
Garbage First and You!devObjective
 

Similar to JVM Performance Tuning (20)

Software Profiling: Java Performance, Profiling and Flamegraphs
Software Profiling: Java Performance, Profiling and FlamegraphsSoftware Profiling: Java Performance, Profiling and Flamegraphs
Software Profiling: Java Performance, Profiling and Flamegraphs
 
Elastic JVM for Scalable Java EE Applications Running in Containers #Jakart...
Elastic JVM  for Scalable Java EE Applications  Running in Containers #Jakart...Elastic JVM  for Scalable Java EE Applications  Running in Containers #Jakart...
Elastic JVM for Scalable Java EE Applications Running in Containers #Jakart...
 
Quick introduction to Java Garbage Collector (JVM GC)
Quick introduction to Java Garbage Collector (JVM GC)Quick introduction to Java Garbage Collector (JVM GC)
Quick introduction to Java Garbage Collector (JVM GC)
 
Jvm problem diagnostics
Jvm problem diagnosticsJvm problem diagnostics
Jvm problem diagnostics
 
Garbage Collection, Tuning And Monitoring JVM In EBS 11i And R12
Garbage Collection, Tuning And Monitoring JVM In EBS 11i And R12Garbage Collection, Tuning And Monitoring JVM In EBS 11i And R12
Garbage Collection, Tuning And Monitoring JVM In EBS 11i And R12
 
Java Performance and Using Java Flight Recorder
Java Performance and Using Java Flight RecorderJava Performance and Using Java Flight Recorder
Java Performance and Using Java Flight Recorder
 
Software Profiling: Understanding Java Performance and how to profile in Java
Software Profiling: Understanding Java Performance and how to profile in JavaSoftware Profiling: Understanding Java Performance and how to profile in Java
Software Profiling: Understanding Java Performance and how to profile in Java
 
Performance tuning jvm
Performance tuning jvmPerformance tuning jvm
Performance tuning jvm
 
Java performance monitoring
Java performance monitoringJava performance monitoring
Java performance monitoring
 
Вячеслав Блинов «Java Garbage Collection: A Performance Impact»
Вячеслав Блинов «Java Garbage Collection: A Performance Impact»Вячеслав Блинов «Java Garbage Collection: A Performance Impact»
Вячеслав Блинов «Java Garbage Collection: A Performance Impact»
 
Garbage collection
Garbage collectionGarbage collection
Garbage collection
 
State of Java Elasticity. Tuning Java Efficiency - GIDS.JAVA LIVE 2020
State of Java Elasticity. Tuning Java Efficiency - GIDS.JAVA LIVE 2020State of Java Elasticity. Tuning Java Efficiency - GIDS.JAVA LIVE 2020
State of Java Elasticity. Tuning Java Efficiency - GIDS.JAVA LIVE 2020
 
Jvm is-your-friend
Jvm is-your-friendJvm is-your-friend
Jvm is-your-friend
 
The JVM is your friend
The JVM is your friendThe JVM is your friend
The JVM is your friend
 
Java Performance and Profiling
Java Performance and ProfilingJava Performance and Profiling
Java Performance and Profiling
 
Profiler Guided Java Performance Tuning
Profiler Guided Java Performance TuningProfiler Guided Java Performance Tuning
Profiler Guided Java Performance Tuning
 
Introduction of Java GC Tuning and Java Java Mission Control
Introduction of Java GC Tuning and Java Java Mission ControlIntroduction of Java GC Tuning and Java Java Mission Control
Introduction of Java GC Tuning and Java Java Mission Control
 
Tuning Java for Big Data
Tuning Java for Big DataTuning Java for Big Data
Tuning Java for Big Data
 
Garbage First and you
Garbage First and youGarbage First and you
Garbage First and you
 
Garbage First and You!
Garbage First and You!Garbage First and You!
Garbage First and You!
 

Recently uploaded

Dealing with Cultural Dispersion — Stefano Lambiase — ICSE-SEIS 2024
Dealing with Cultural Dispersion — Stefano Lambiase — ICSE-SEIS 2024Dealing with Cultural Dispersion — Stefano Lambiase — ICSE-SEIS 2024
Dealing with Cultural Dispersion — Stefano Lambiase — ICSE-SEIS 2024StefanoLambiase
 
Cloud Management Software Platforms: OpenStack
Cloud Management Software Platforms: OpenStackCloud Management Software Platforms: OpenStack
Cloud Management Software Platforms: OpenStackVICTOR MAESTRE RAMIREZ
 
Salesforce Certified Field Service Consultant
Salesforce Certified Field Service ConsultantSalesforce Certified Field Service Consultant
Salesforce Certified Field Service ConsultantAxelRicardoTrocheRiq
 
Adobe Marketo Engage Deep Dives: Using Webhooks to Transfer Data
Adobe Marketo Engage Deep Dives: Using Webhooks to Transfer DataAdobe Marketo Engage Deep Dives: Using Webhooks to Transfer Data
Adobe Marketo Engage Deep Dives: Using Webhooks to Transfer DataBradBedford3
 
Der Spagat zwischen BIAS und FAIRNESS (2024)
Der Spagat zwischen BIAS und FAIRNESS (2024)Der Spagat zwischen BIAS und FAIRNESS (2024)
Der Spagat zwischen BIAS und FAIRNESS (2024)OPEN KNOWLEDGE GmbH
 
Recruitment Management Software Benefits (Infographic)
Recruitment Management Software Benefits (Infographic)Recruitment Management Software Benefits (Infographic)
Recruitment Management Software Benefits (Infographic)Hr365.us smith
 
EY_Graph Database Powered Sustainability
EY_Graph Database Powered SustainabilityEY_Graph Database Powered Sustainability
EY_Graph Database Powered SustainabilityNeo4j
 
Advancing Engineering with AI through the Next Generation of Strategic Projec...
Advancing Engineering with AI through the Next Generation of Strategic Projec...Advancing Engineering with AI through the Next Generation of Strategic Projec...
Advancing Engineering with AI through the Next Generation of Strategic Projec...OnePlan Solutions
 
chapter--4-software-project-planning.ppt
chapter--4-software-project-planning.pptchapter--4-software-project-planning.ppt
chapter--4-software-project-planning.pptkotipi9215
 
Software Project Health Check: Best Practices and Techniques for Your Product...
Software Project Health Check: Best Practices and Techniques for Your Product...Software Project Health Check: Best Practices and Techniques for Your Product...
Software Project Health Check: Best Practices and Techniques for Your Product...Velvetech LLC
 
Call Us🔝>༒+91-9711147426⇛Call In girls karol bagh (Delhi)
Call Us🔝>༒+91-9711147426⇛Call In girls karol bagh (Delhi)Call Us🔝>༒+91-9711147426⇛Call In girls karol bagh (Delhi)
Call Us🔝>༒+91-9711147426⇛Call In girls karol bagh (Delhi)jennyeacort
 
Asset Management Software - Infographic
Asset Management Software - InfographicAsset Management Software - Infographic
Asset Management Software - InfographicHr365.us smith
 
Folding Cheat Sheet #4 - fourth in a series
Folding Cheat Sheet #4 - fourth in a seriesFolding Cheat Sheet #4 - fourth in a series
Folding Cheat Sheet #4 - fourth in a seriesPhilip Schwarz
 
Building a General PDE Solving Framework with Symbolic-Numeric Scientific Mac...
Building a General PDE Solving Framework with Symbolic-Numeric Scientific Mac...Building a General PDE Solving Framework with Symbolic-Numeric Scientific Mac...
Building a General PDE Solving Framework with Symbolic-Numeric Scientific Mac...stazi3110
 
BATTLEFIELD ORM: TIPS, TACTICS AND STRATEGIES FOR CONQUERING YOUR DATABASE
BATTLEFIELD ORM: TIPS, TACTICS AND STRATEGIES FOR CONQUERING YOUR DATABASEBATTLEFIELD ORM: TIPS, TACTICS AND STRATEGIES FOR CONQUERING YOUR DATABASE
BATTLEFIELD ORM: TIPS, TACTICS AND STRATEGIES FOR CONQUERING YOUR DATABASEOrtus Solutions, Corp
 
Russian Call Girls in Karol Bagh Aasnvi ➡️ 8264348440 💋📞 Independent Escort S...
Russian Call Girls in Karol Bagh Aasnvi ➡️ 8264348440 💋📞 Independent Escort S...Russian Call Girls in Karol Bagh Aasnvi ➡️ 8264348440 💋📞 Independent Escort S...
Russian Call Girls in Karol Bagh Aasnvi ➡️ 8264348440 💋📞 Independent Escort S...soniya singh
 
What are the key points to focus on before starting to learn ETL Development....
What are the key points to focus on before starting to learn ETL Development....What are the key points to focus on before starting to learn ETL Development....
What are the key points to focus on before starting to learn ETL Development....kzayra69
 
ODSC - Batch to Stream workshop - integration of Apache Spark, Cassandra, Pos...
ODSC - Batch to Stream workshop - integration of Apache Spark, Cassandra, Pos...ODSC - Batch to Stream workshop - integration of Apache Spark, Cassandra, Pos...
ODSC - Batch to Stream workshop - integration of Apache Spark, Cassandra, Pos...Christina Lin
 
MYjobs Presentation Django-based project
MYjobs Presentation Django-based projectMYjobs Presentation Django-based project
MYjobs Presentation Django-based projectAnoyGreter
 

Recently uploaded (20)

Dealing with Cultural Dispersion — Stefano Lambiase — ICSE-SEIS 2024
Dealing with Cultural Dispersion — Stefano Lambiase — ICSE-SEIS 2024Dealing with Cultural Dispersion — Stefano Lambiase — ICSE-SEIS 2024
Dealing with Cultural Dispersion — Stefano Lambiase — ICSE-SEIS 2024
 
Hot Sexy call girls in Patel Nagar🔝 9953056974 🔝 escort Service
Hot Sexy call girls in Patel Nagar🔝 9953056974 🔝 escort ServiceHot Sexy call girls in Patel Nagar🔝 9953056974 🔝 escort Service
Hot Sexy call girls in Patel Nagar🔝 9953056974 🔝 escort Service
 
Cloud Management Software Platforms: OpenStack
Cloud Management Software Platforms: OpenStackCloud Management Software Platforms: OpenStack
Cloud Management Software Platforms: OpenStack
 
Salesforce Certified Field Service Consultant
Salesforce Certified Field Service ConsultantSalesforce Certified Field Service Consultant
Salesforce Certified Field Service Consultant
 
Adobe Marketo Engage Deep Dives: Using Webhooks to Transfer Data
Adobe Marketo Engage Deep Dives: Using Webhooks to Transfer DataAdobe Marketo Engage Deep Dives: Using Webhooks to Transfer Data
Adobe Marketo Engage Deep Dives: Using Webhooks to Transfer Data
 
Der Spagat zwischen BIAS und FAIRNESS (2024)
Der Spagat zwischen BIAS und FAIRNESS (2024)Der Spagat zwischen BIAS und FAIRNESS (2024)
Der Spagat zwischen BIAS und FAIRNESS (2024)
 
Recruitment Management Software Benefits (Infographic)
Recruitment Management Software Benefits (Infographic)Recruitment Management Software Benefits (Infographic)
Recruitment Management Software Benefits (Infographic)
 
EY_Graph Database Powered Sustainability
EY_Graph Database Powered SustainabilityEY_Graph Database Powered Sustainability
EY_Graph Database Powered Sustainability
 
Advancing Engineering with AI through the Next Generation of Strategic Projec...
Advancing Engineering with AI through the Next Generation of Strategic Projec...Advancing Engineering with AI through the Next Generation of Strategic Projec...
Advancing Engineering with AI through the Next Generation of Strategic Projec...
 
chapter--4-software-project-planning.ppt
chapter--4-software-project-planning.pptchapter--4-software-project-planning.ppt
chapter--4-software-project-planning.ppt
 
Software Project Health Check: Best Practices and Techniques for Your Product...
Software Project Health Check: Best Practices and Techniques for Your Product...Software Project Health Check: Best Practices and Techniques for Your Product...
Software Project Health Check: Best Practices and Techniques for Your Product...
 
Call Us🔝>༒+91-9711147426⇛Call In girls karol bagh (Delhi)
Call Us🔝>༒+91-9711147426⇛Call In girls karol bagh (Delhi)Call Us🔝>༒+91-9711147426⇛Call In girls karol bagh (Delhi)
Call Us🔝>༒+91-9711147426⇛Call In girls karol bagh (Delhi)
 
Asset Management Software - Infographic
Asset Management Software - InfographicAsset Management Software - Infographic
Asset Management Software - Infographic
 
Folding Cheat Sheet #4 - fourth in a series
Folding Cheat Sheet #4 - fourth in a seriesFolding Cheat Sheet #4 - fourth in a series
Folding Cheat Sheet #4 - fourth in a series
 
Building a General PDE Solving Framework with Symbolic-Numeric Scientific Mac...
Building a General PDE Solving Framework with Symbolic-Numeric Scientific Mac...Building a General PDE Solving Framework with Symbolic-Numeric Scientific Mac...
Building a General PDE Solving Framework with Symbolic-Numeric Scientific Mac...
 
BATTLEFIELD ORM: TIPS, TACTICS AND STRATEGIES FOR CONQUERING YOUR DATABASE
BATTLEFIELD ORM: TIPS, TACTICS AND STRATEGIES FOR CONQUERING YOUR DATABASEBATTLEFIELD ORM: TIPS, TACTICS AND STRATEGIES FOR CONQUERING YOUR DATABASE
BATTLEFIELD ORM: TIPS, TACTICS AND STRATEGIES FOR CONQUERING YOUR DATABASE
 
Russian Call Girls in Karol Bagh Aasnvi ➡️ 8264348440 💋📞 Independent Escort S...
Russian Call Girls in Karol Bagh Aasnvi ➡️ 8264348440 💋📞 Independent Escort S...Russian Call Girls in Karol Bagh Aasnvi ➡️ 8264348440 💋📞 Independent Escort S...
Russian Call Girls in Karol Bagh Aasnvi ➡️ 8264348440 💋📞 Independent Escort S...
 
What are the key points to focus on before starting to learn ETL Development....
What are the key points to focus on before starting to learn ETL Development....What are the key points to focus on before starting to learn ETL Development....
What are the key points to focus on before starting to learn ETL Development....
 
ODSC - Batch to Stream workshop - integration of Apache Spark, Cassandra, Pos...
ODSC - Batch to Stream workshop - integration of Apache Spark, Cassandra, Pos...ODSC - Batch to Stream workshop - integration of Apache Spark, Cassandra, Pos...
ODSC - Batch to Stream workshop - integration of Apache Spark, Cassandra, Pos...
 
MYjobs Presentation Django-based project
MYjobs Presentation Django-based projectMYjobs Presentation Django-based project
MYjobs Presentation Django-based project
 

JVM Performance Tuning

  • 1. Discussion Document – Strictly Confidential & Proprietary JVM Performance Tuning August 2016
  • 2. JVM Performance Tuning ● Overview ● Garbage Collection ○ Overview of how it works ○ Practical application ○ Recommendations for production ● JVM Profiling ○ Overview ○ Recommendations for production ○ Profiling demos JVM Tuning Technical Talk … Agenda … JVM Performance Tuning Technical Talk Agenda
  • 5. Physical Server Hypervisor Operating System JVM Process Your code Internet Physical Server Operating System RDBMS Your Schema/ Queries Local Disk Physical Server Disk Disk DiskSAN Storage OS Performance tuning requires looking at a complete picture of the system and addressing the right issues (usually your code) ● Tuning the wrong component can have no impact and can sometimes make things worse! ● This presentation is focused on the JVM - others will follow... JVM Tuning Technical Talk … Overview …
  • 6. There are many implementations of the JVM in existence today, and it is important to be aware of what you are working with because they may be tuned differently • There are many JVM implementations in existence today (75+) • 2 main implementations to be aware of: – OpenJDK ▪ This is a completely open source JVM choice ▪ This is the default packaged JVM with many Linux distros – HotSpot ▪ Currently owned by Oracle ▪ Based on OpenJDK, but includes in other implementations of various pieces (some closed source) – Other commercial JVMs exist: be aware which one you are running ▪ Running “java -version” will tell you Reference: https://plumbr.eu/blog/java/java-version-and-vendor-data-analyzed-2016-edition JVM Tuning Technical Talk … Overview …
  • 7. Tuning your JVM can have a significant impact on application performance • JVM Tuning - what and why? – Involves using various tools to get more insight on what the JVM is doing “under the hood” – Generally involves various command line arguments to tune behaviors primarily centered around modifying garbage collection – Garbage collection is expensive! • When approaching JVM tuning, remember 2 things: – Tuning your JVM can have a significant impact on application performance – “Premature optimization is the root of all evil” - Donald Knuth JVM Tuning Technical Talk … Overview …
  • 9. Garbage collection “eliminates” the need for a programmer to have to manage memory themselves in code ● Trivial C++ example of manual memory management: { foo* f = new foo(); // Do interesting things with f delete f; // you'll see that the object is destroyed. } ● In Java, there is no “delete” ● The JVM shields the developer from the complexities of manual memory management ● The memory still needs to be reclaimed to become available for future use ● Garbage collection automatically identifies “dead objects” to reclaim the memory they occupy and make it available again for future use JVM Tuning Technical Talk … Garbage Collection … Garbage collection is a form of automatic memory management which attempts to keep the developer from doing it manually
  • 10. JVM Tuning Technical Talk … Garbage Collection … ● “Generational hypothesis”: most objects survive for only a short period of time ○ The majority of objects “die young” ○ GC can be typically be more efficiently performed by focusing on collecting younger objects ● The JVM uses the concept of “generations” of an object, based on analysis of how typical object allocation/deallocation occurs over time Common terms when tuning GC: ● Throughput - how much actual work your application is doing (i.e. total time spent not doing GC) ● Pauses - Times your application appears unresponsive due to performing GC Reference: https://docs.oracle.com/javase/8/docs/technotes/guides/vm/gctuning/generations.html GC algorithms in HotSpot/OpenJDK operate under the “generational hypothesis”
  • 11. With the Java 8-based memory architecture, objects move through the heap in stages 1. When objects are first created, they are allocated into eden 2. Once eden fills up, a GC event is triggered ○ Dead objects are effectively removed from eden ○ Surviving objects are moved into the survivor spaces 3. When a survivor space fill up, a GC event is triggered ○ Objects alternate between S0/S1 through GC ○ Objects which survive a certain number of GC passes move to tenured 4. When oldgen/tenured fills up, a GC event is triggered JVM Tuning Technical Talk … Garbage Collection … JVM Memory management utilizes “generations” to bucket objects in memory based on their age Eden S0 (Survivor) S1 (Survivor) Tenured Young gen Old gen (tenured) -Xmx (max heap)
  • 12. Different GC events: ● Minor GC - cleanup younggen ○ Happens when eden or survivor spaces fills up ○ Generally fast ● Major GC - cleanup oldgen ○ Generally takes longer (more objects to deal with) ● Full GC - cleanup both younggen and oldgen Notes: ● Minor GC collections happen much more frequently - this is how the generational hypothesis is implemented ● All of these GC events are “stop the world” operations at some point during operation JVM Tuning Technical Talk … Garbage Collection … Three main types of GC events can occur to trigger the cleanup of dead objects and graduate live ones Eden S0 (Survivor) S1 (Survivor) Tenured Young gen Old gen (tenured) -Xmx (max heap) ○ “Stop the world” events cause ALL application threads to stop while the GC code does its work ● Different GC algorithms take different approaches in cleaning these spaces ○ Some algorithms do different parts of this concurrently ● GC tuning revolves around minimizing the occurrence and reducing the duration of these application pauses
  • 13. Metaspace (new in Java 8) is a block of “native memory” where the java classes and methods are loaded JVM Tuning Technical Talk … Garbage Collection … Java 8 replaced PermGen with Metaspace Eden S0 (Survivor) S1 (Survivor) Tenured Young gen Old gen (tenured) -Xmx (max heap) Entire java process memory allocation Metaspace
  • 14. GC roots are special to the garbage collector in that they cause other objects to stay alive and reachable During live object identification, the JVM: ● Begins by finding all “GC roots” ● Iterates, starting from GC roots, to all objects that are reachable and “marks them” ● Marking always performs a “stop the world” operation at some point ○ more alive objects == more time marking == more time with all threads paused ○ Sometimes more heap memory can be bad - it can take a lot more time to perform GC Example GC roots: ● Local variables (active method) ● Live threads ● Static fields of loaded classes ● Some JNI references Image courtesy of: https://plumbr.eu/handbook/garbage-collection-algorithms JVM Tuning Technical Talk … Garbage Collection …
  • 15. There are four main choices for GC implementations, each with their own strengths and weaknesses Common Name Details Serial GC -XX:+UseSerialGC ● All threads are stopped and then live objects are marked, copied/made contiguous ● NEVER use this for any multi-core machine; it can be beneficial for single-core boxes ● Ideal use case: Single processor machines (think embedded devices) Parallel GC -XX:+UseParallelGC -XX:+UseParallelOldGC ● All phases are run with multiple threads (a parallelized serial GC) ● All cores do GC work; no CPU cycles are used for GC when not running GC ● Can result in increased latency (stop the world collections) ● Ideal use case: High throughput, don’t mind long pauses Concurrent Mark and Sweep (CMS) -XX:+UseConcMarkSweepGC -XX:+UseParNewGC ● 1/4 of the CPU cores are regularly used to perform background object analysis ● Minimizes pause times, but results in lower throughput ● Can be less predictable on large heaps ● Ideal use case: Minimizes pause times, at the sacrifice of total throughput G1 -XX:+UseG1GC ● This is the latest in GC algorithms and is regularly being improved with JVM updates ● This divides young and oldgen into over 2000 different regions, allowing for incremental collection ● Most advanced, most changing implementation ● Will be the default for Java 9 ● Ideal use case: Large 6G+ heaps with desire for predictable GC pauses as well as minimum impact on throughput JVM Tuning Technical Talk … Garbage Collection …
  • 17. The high-level approach to tuning garbage collection involves trying different combinations, measuring throughput and pauses, and making educated guesses Practical approach to performing GC tuning at a high-level: 1. Pick a GC algorithm which initially makes sense for your application based on known strengths/weaknesses 2. Derive a load test for your application (JMeter, LoadUI, etc.) ○ Must independently measure throughput (i.e., how well did the test perform versus my goals) ○ Must be consistent, repeatable ○ Minimize your variables 3. Enable verbose GC logging (and dump to a separate file - see recommended JVM args later) ○ Allows you to collect the data you need to understand your results 4. Execute load test 5. Analyze load test results, GC logs 6. Make adjustments (1 variable at a time), rinse, repeat If you aren’t sure which GC algorithm is best for your application, you can try multiple! ● Recommend doing this before tuning individual settings for specific GC algorithms ● Attempt load test with GC algorithm-specific default settings first JVM Tuning Technical Talk … Garbage Collection …
  • 18. ● GCHisto ○ Allows for visual analysis of verbose GC logs ○ Free, originally a plugin for VisualVM ○ https://github.com/jewes/gchisto ● GCViewer ○ Allows for visual analysis of verbose GC logs similar to GCHisto ○ https://github.com/chewiebug/GCViewer/wiki ● JConsole ○ Free, shipped with the JDK ○ Can use JMX connection to get access to and insight about a running JVM “on the fly” ○ Gives you insight into current memory usage and GC ○ Can be used to view and manipulate specifically exposed data within the JVM on the fly without restarting the process (future talk) There are a few useful tools to help analyze garbage collection performance JVM Tuning Technical Talk … Garbage Collection …
  • 20. JVM Tuning Technical Talk … JVM Profiling … A Java process can be inspected to get insight on data related to performance and memory usage Main goals around JVM profiling: ● Analyze code behavior ○ Inspect individual method execution invocation counts and and durations ○ Inspect individual thread states ○ Can be used to help find your performance bottlenecks ● Analyze memory usage ○ Every object in the heap is available for inspection ○ Identify GC roots (or lack thereof) for each object These things can be done in real-time via attaching a profiler, or offline inspecting data files: ○ thread dump file ■ The state of all the threads in the application ○ hprof file ■ Snapshot of everything in the JVM heap with other useful metadata ■ Can be generated via: JConsole, JVisualVM, jmap, etc. ■ hprof files can be generated automatically on OutOfMemoryErrors - *** very useful ***
  • 21. JVM Tuning Technical Talk … JVM Profiling … Profiling is made available locally and remotely via different mechanisms and it is important to understand how you get access to this information Your profiling tools are running in different processes than your target JVMs ● They can even be on different machines ● It is important to be aware of these boundaries ● The profiling tools can connect via a socket connection - be aware of firewall rules, etc. JVM monitoring connection options: ● jstatd ○ this is a standalone daemon process which needs to be running on the same machine as the JVM you want to monitor/manage ○ This requires starting jstatd on the machine you want to get access to ○ Monitoring capabilities are limited ○ Can be useful in the case where you don’t have JMX enabled and can’t restart your process ● JMX ○ More powerful access to the JVM ○ Requires starting your target java process with some command line arguments ○ This is enabled by default on Java 6+ locally ■ Be warned - if the target process isn’t running as the same user or JVM as the monitoring tool, they won’t find each other unless you explicitly define ports ●
  • 22. ● VisualVM ○ Free, shipped with the JDK ○ Allows for deep insight into the performance of a given JVM ○ Will demo this today ● YourKit ○ Has many useful features above and beyond VisualVM, but usually not necessary ○ https://www.yourkit.com/java/profiler/ ○ Paid commercial tool with free trial period ● JProfiler ○ Has a graphical representation of call stacks, can be easier to navigate ○ Paid commercial tool It’s demo time!!! There are a plethora of tools available for getting insight into JVM activities and performance JVM Tuning Technical Talk … JVM Profiling …
  • 23. ● Many other command line tools are shipped with the JDK ○ jmap - can be used to force a heap dump from a running JVM ○ jstatd - allows remote access to already running JVMs ○ http://docs.oracle.com/javase/8/docs/technotes/tools/ JVM Tuning Technical Talk … JVM Tuning Tools … Other notable tools available for getting insight into and analysis of JVM performance
  • 25. ● -server ○ This causes the JVM’s JIT to be more aggressive ○ This increases boot times, but improves performance ○ Usually set by default based on “physical” system profile, but doesn’t hurt to force it ● -Xms=<size> and -Xmx=<size> ○ These set the minimum and maximum heap allocation sizes ○ If not specified, the JVM will use some defaults based on the amount of memory on the machine - can be dangerous ○ Protip: set them to the same value (i.e. -Xms=512m -Xmx=512m) ■ Removing the JVM’s ability to reduce the heap allocation will improve performance ■ Also helps ensure you have enough memory to handle all the processes you intend to run ● -XX:MaxMetaspaceSize=<size> ○ This limits the metaspace memory allocation, which is important since a metaspace leak is outside of the heap ○ Without this, “worst case scenario” is that your java process grows unbounded ○ Must monitor load test to get a feel for how much will be needed JVM Tuning Technical Talk … JVM Arguments for Production … The following JVM arguments should be utilized in production for most server-side java processes
  • 26. ● -XX:+HeapDumpOnOutOfMemoryError -XX:HeapDumpPath=<some legit path to dump the log> ○ Forces the generation of an hprof file when OOME occurs ○ Setting the path forces the JVM to put the hprof (which can be big) to go somewhere you expect ○ Make sure that appropriate space will exist (hprof will be larger than -Xmx value) ○ Make sure it won’t cause disk space issues in production ● -XX:+PrintGCDateStamps -verbose:gc -XX:+PrintGCDetails -Xloggc:<file path and name> ○ These arguments enable GC logging which is ingestable via the GC analysis tools ○ Necessary to get insight into JVM GC behavior and performance ○ Be aware that this increases logging ● -XX:+UseGCLogFileRotation -XX:NumberOfGCLogFiles=<X> -XX:GCLogFileSize=<max size> ○ This causes the GC logs to be automatically rotated ○ This will limit the disk space the GC logs occupy (making it easier to have verbose GC logs on in prod) ● -XX:+PrintCommandLineFlags ○ This will show you which GC is being used (as well as other defaulted JVM args) JVM Tuning Technical Talk … JVM Arguments for Production … The following JVM arguments should be utilized in production for most server-side java processes
  • 27. Oracle documentation: https://docs.oracle.com/javase/8/docs/technotes/guides/vm/gctuning/ Plumbr garbage collection handbook: https://plumbr.eu/java-garbage-collection-handbook SE Radio podcast (which contains its own useful links): http://www.se-radio.net/2016/04/se-radio-episode-255-monica-beckwith-on-java-garbage-collection/ G1GC tuning reference: http://www.oracle.com/technetwork/tutorials/tutorials-1876574.html JVM Tuning Technical Talk … Garbage Collection … Links for further study