Download to read offline


![[
{ ... },
{
"name": "Westmalle Tripel",
"brewery": "Brouwerij der Trappisten van Westmalle",
"votes": 17658,
"rating": 4.7
},
{ ... }
]](https://image.slidesharecdn.com/jetbrains2019-exploring-191007140154/75/JetBrains-Australia-2019-Exploring-NET-s-memory-management-a-trip-down-memory-lane-21-2048.jpg)
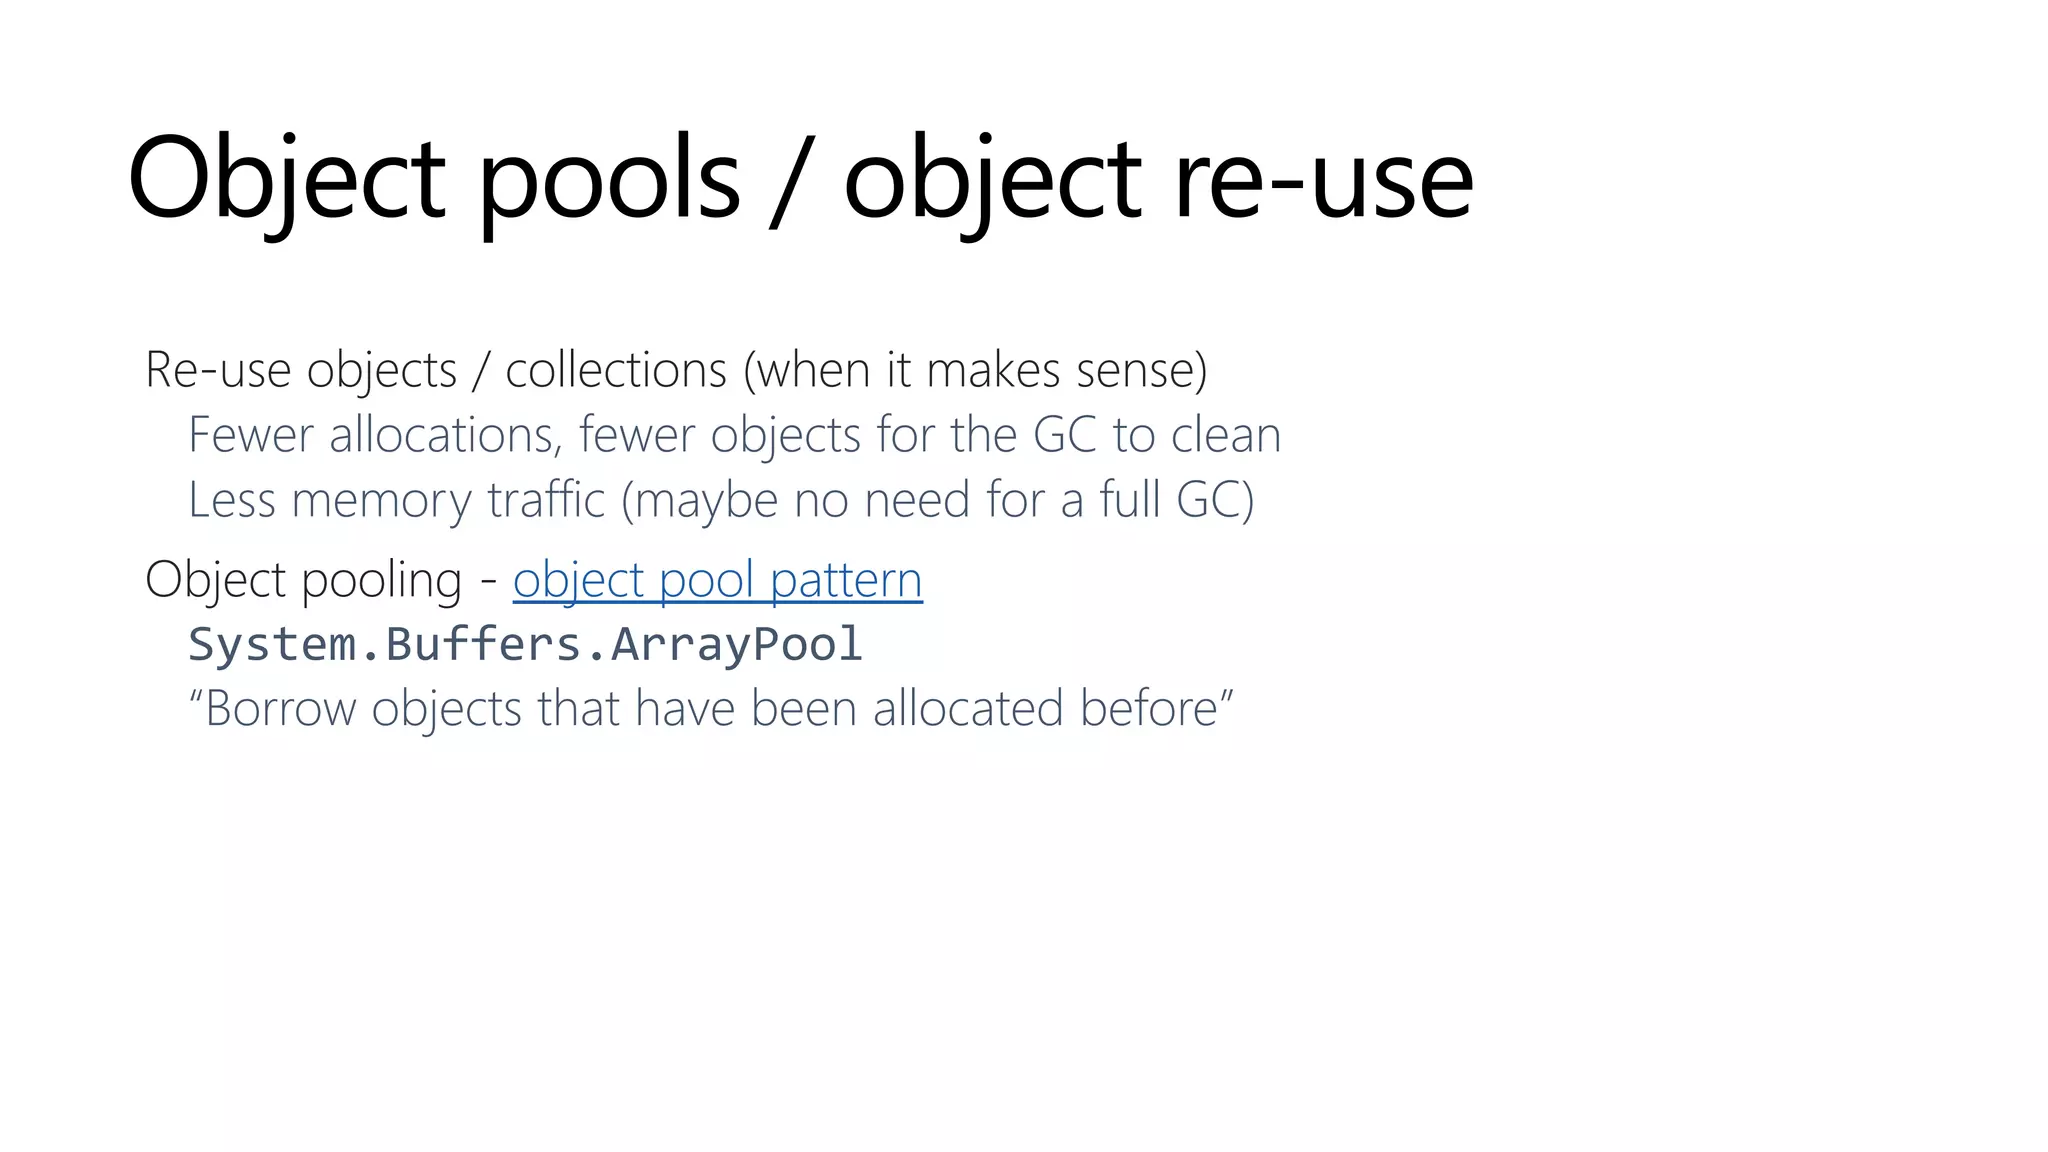
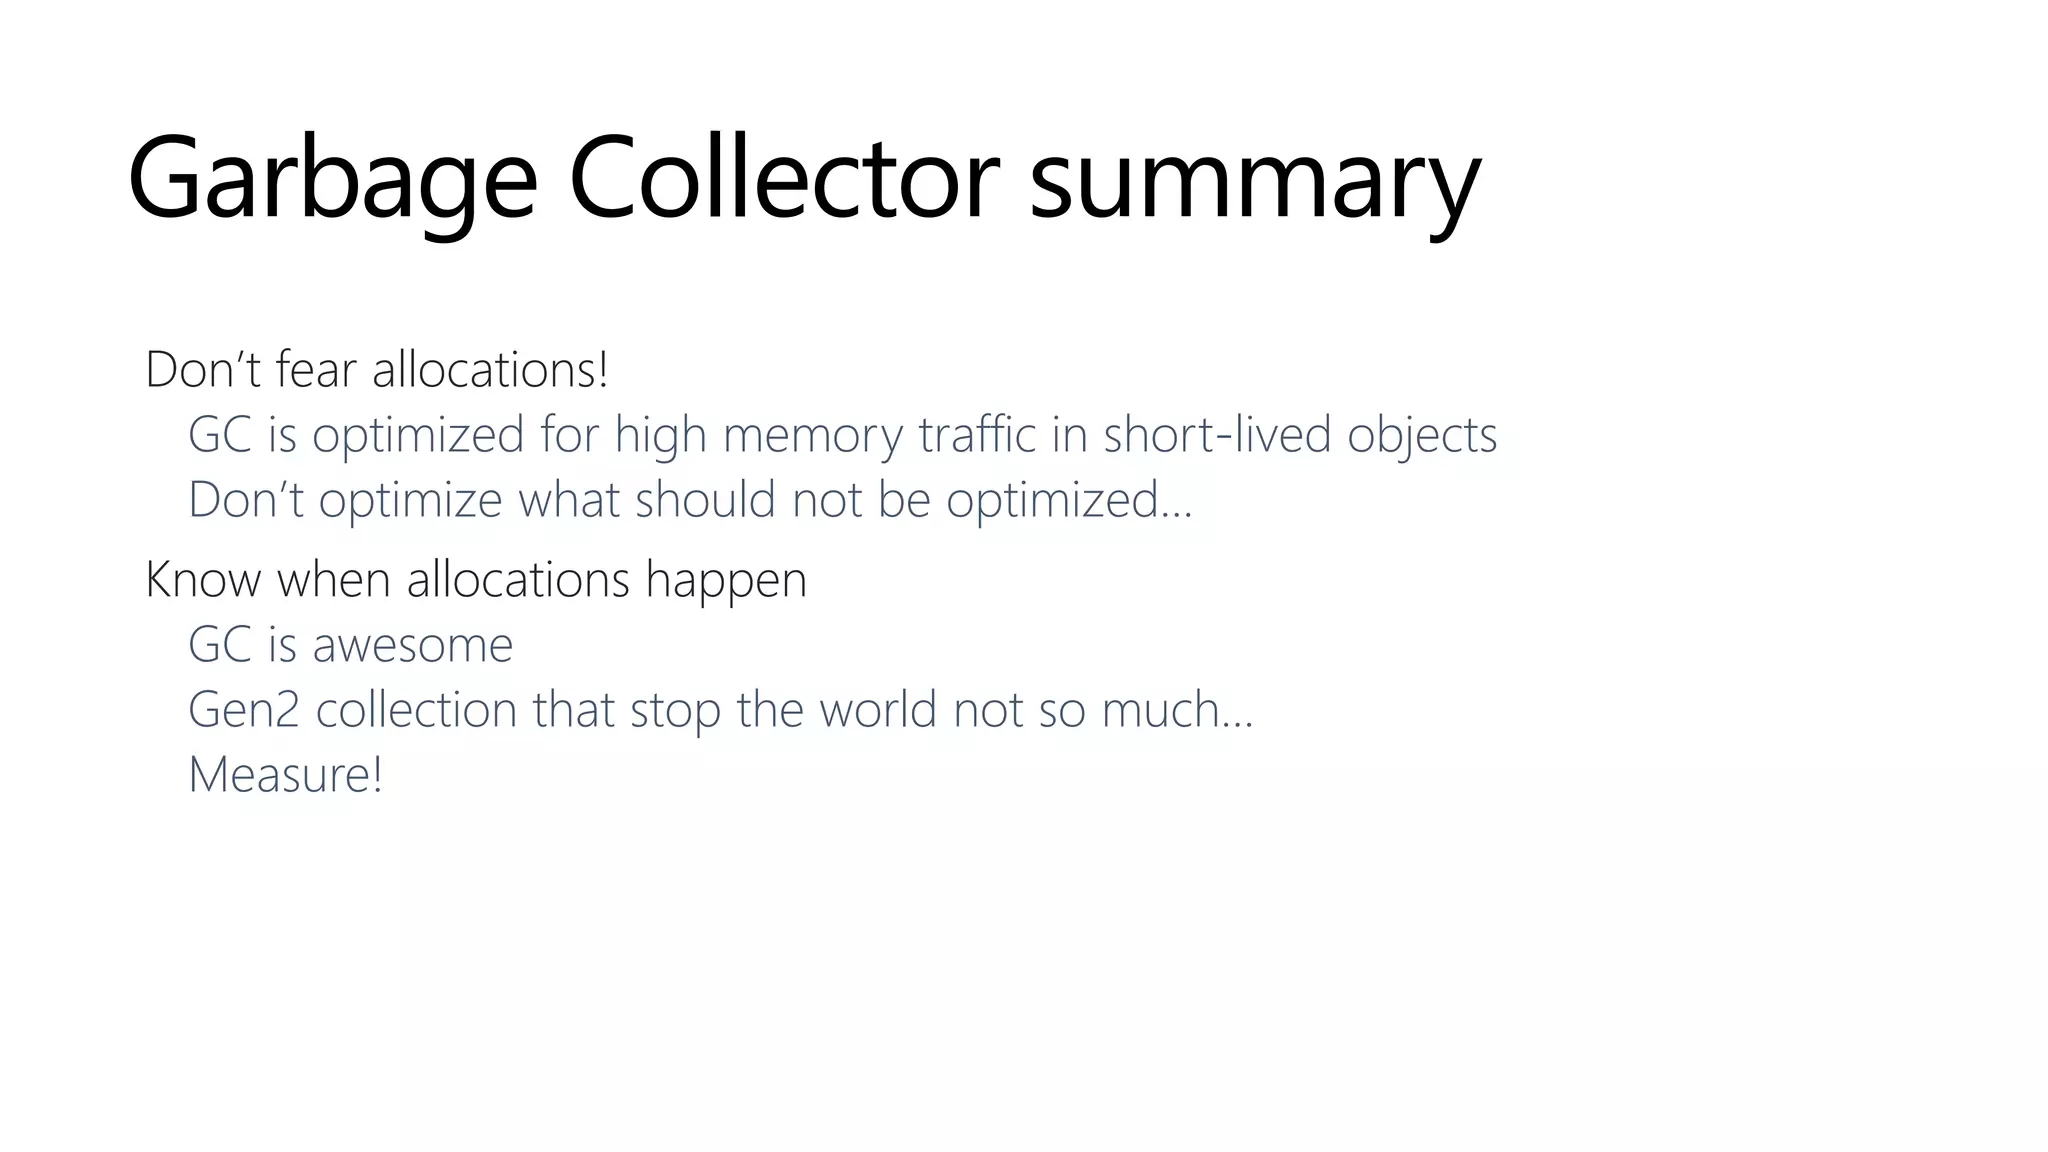

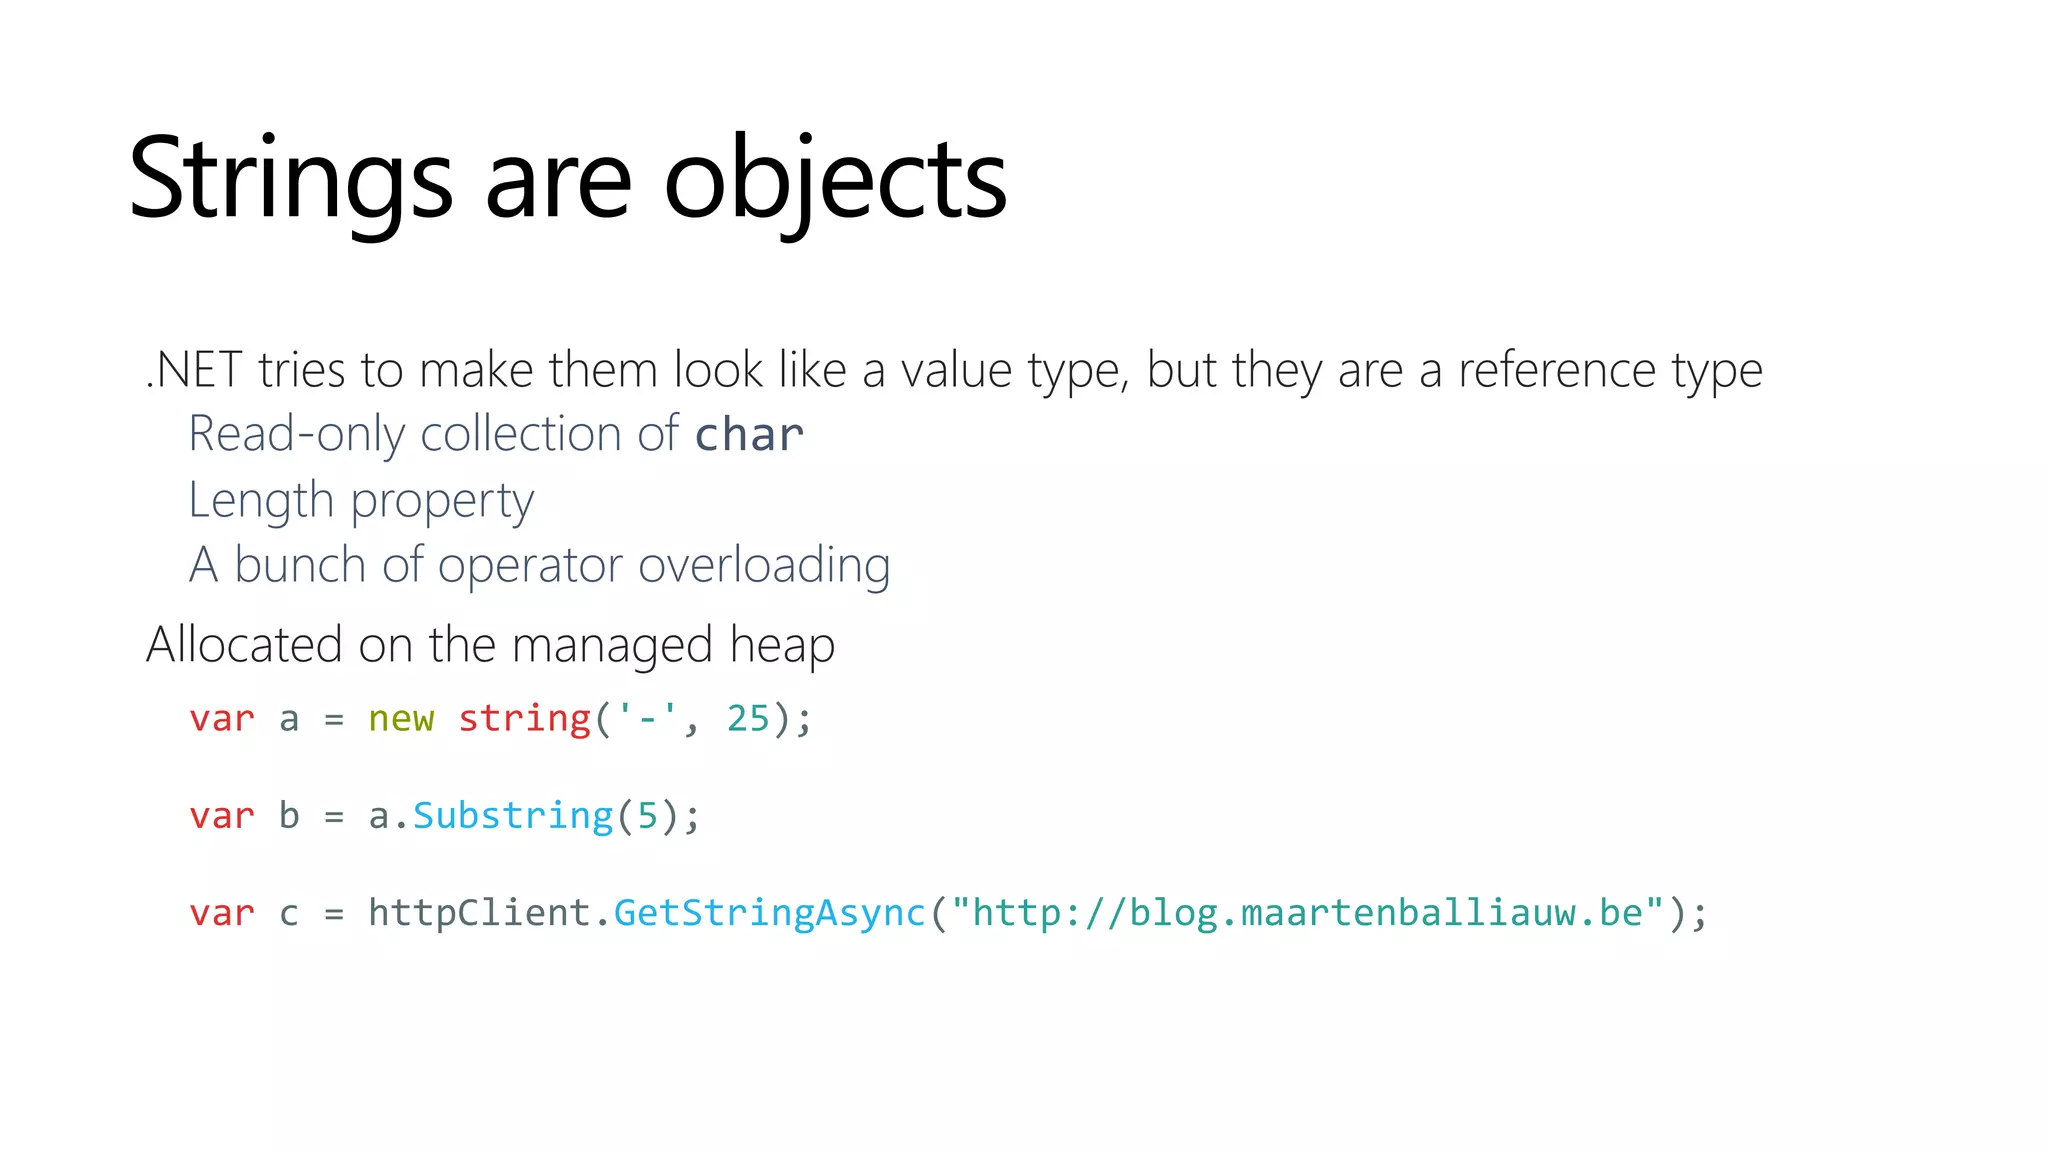
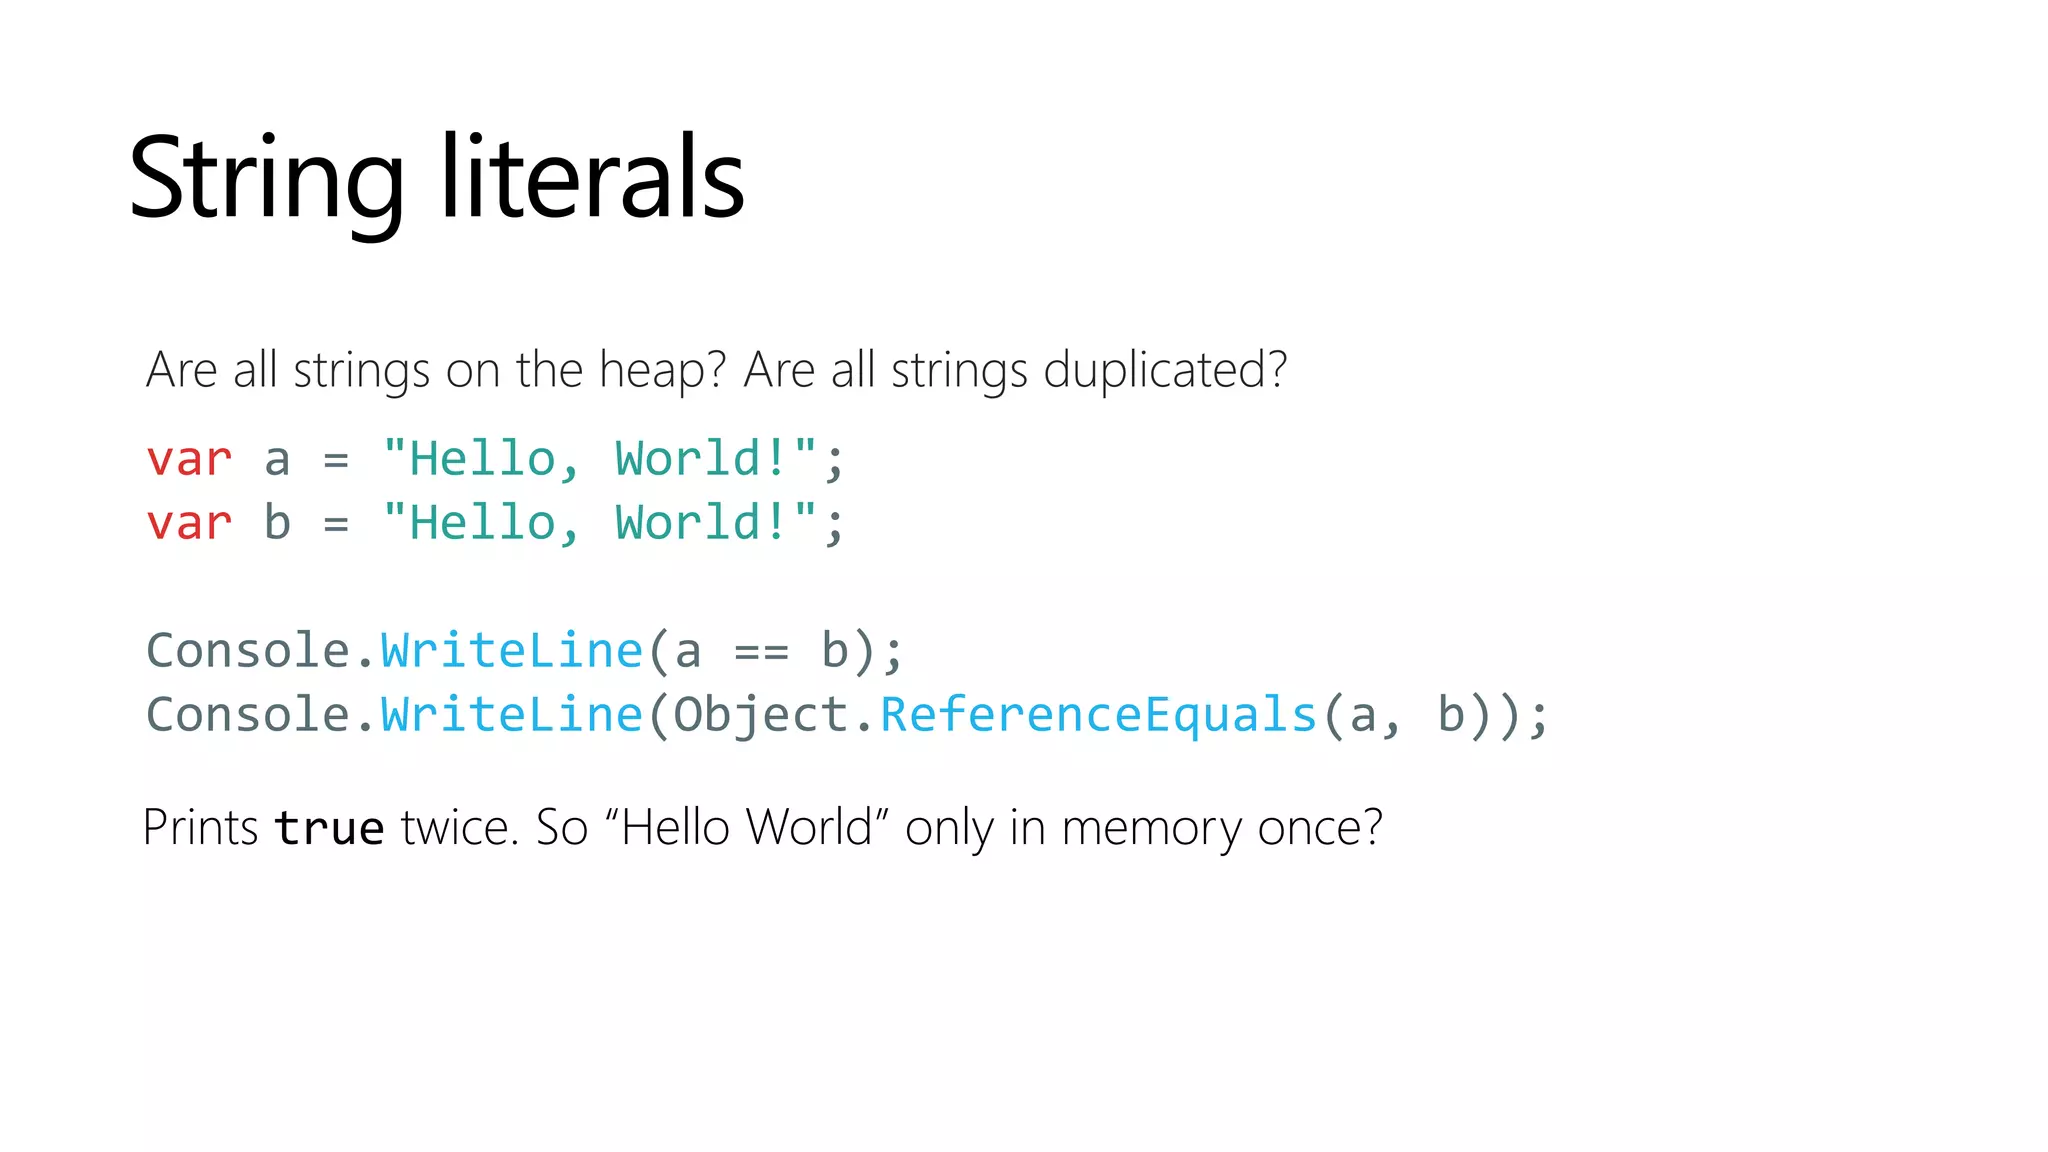


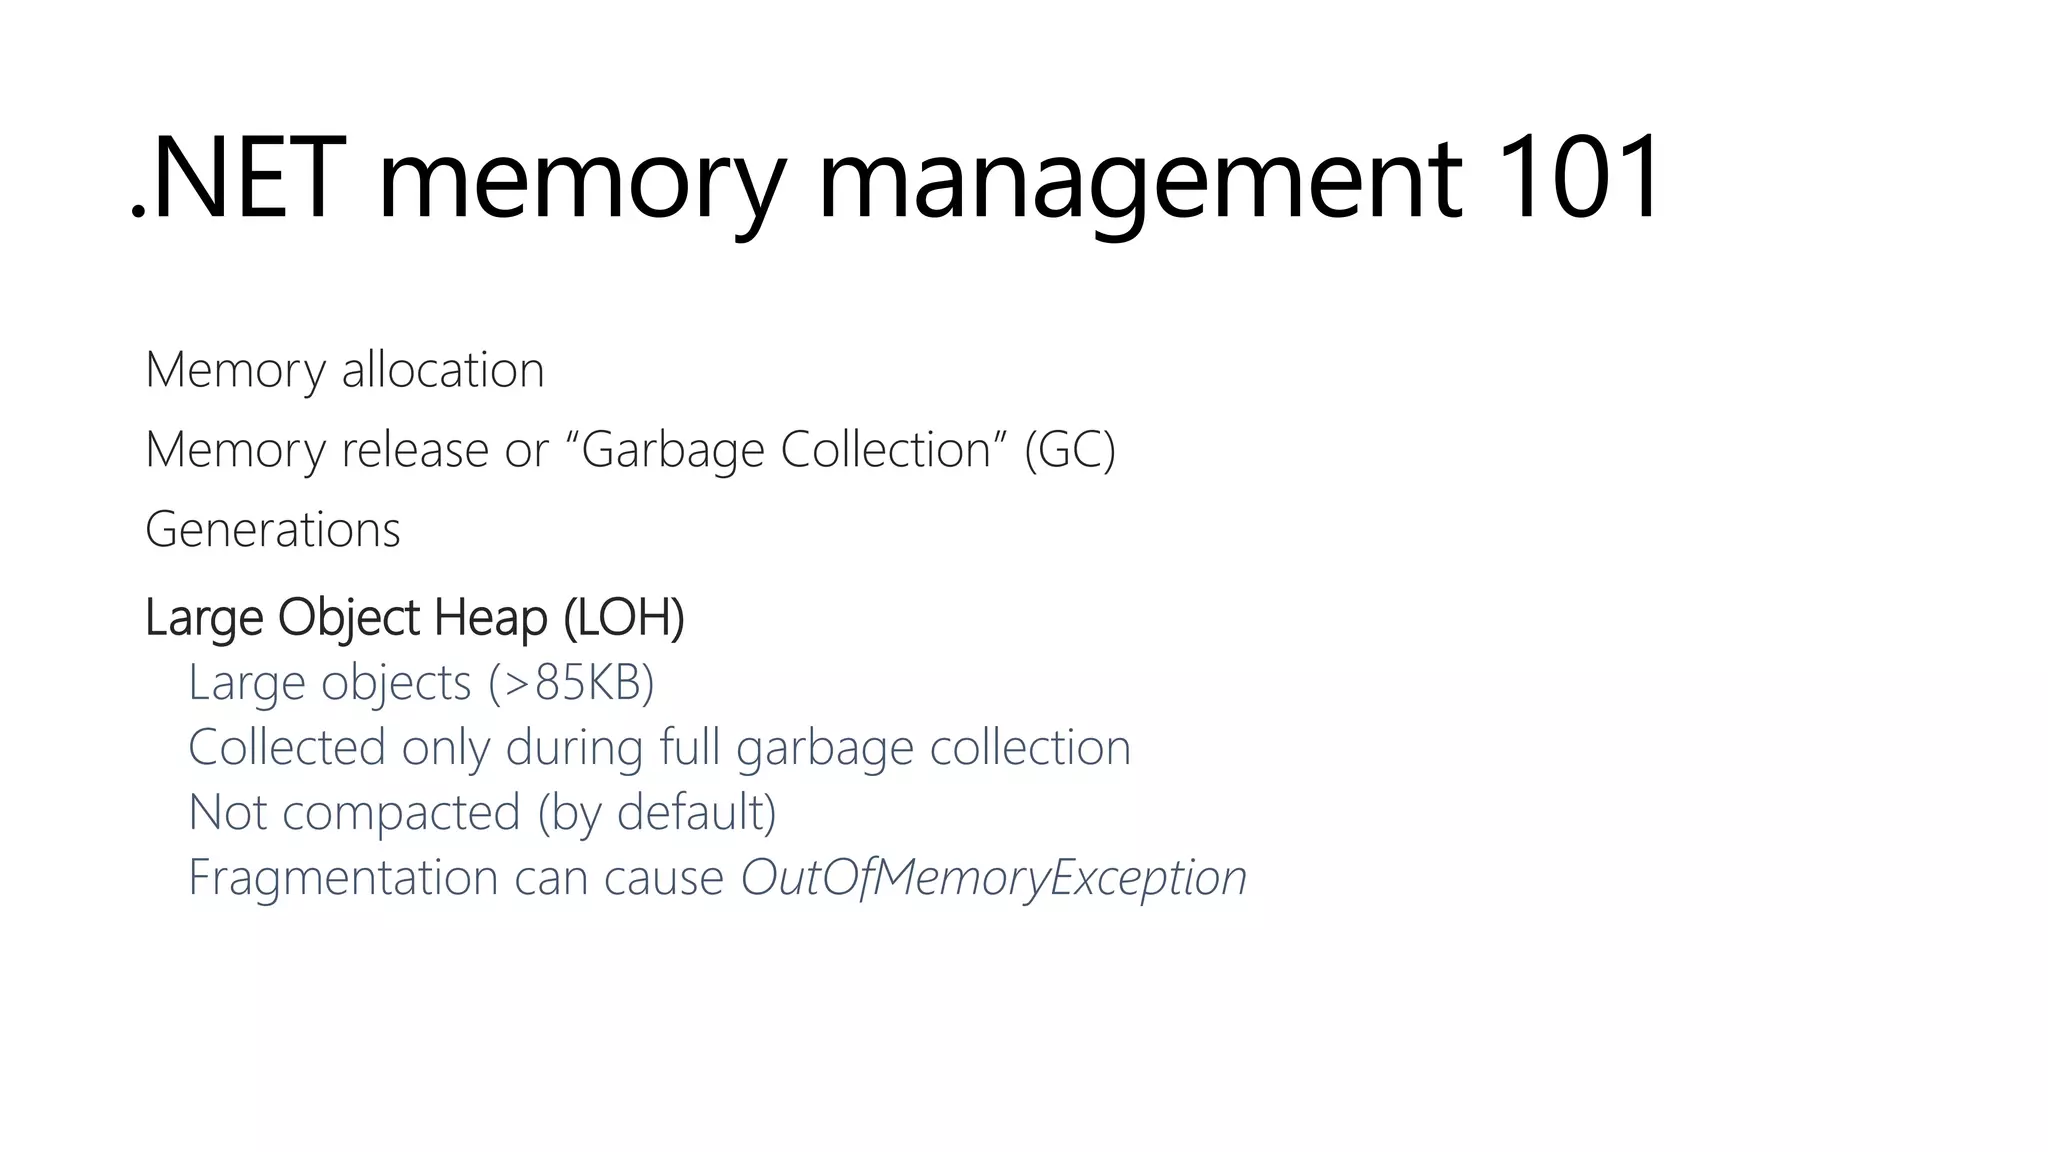
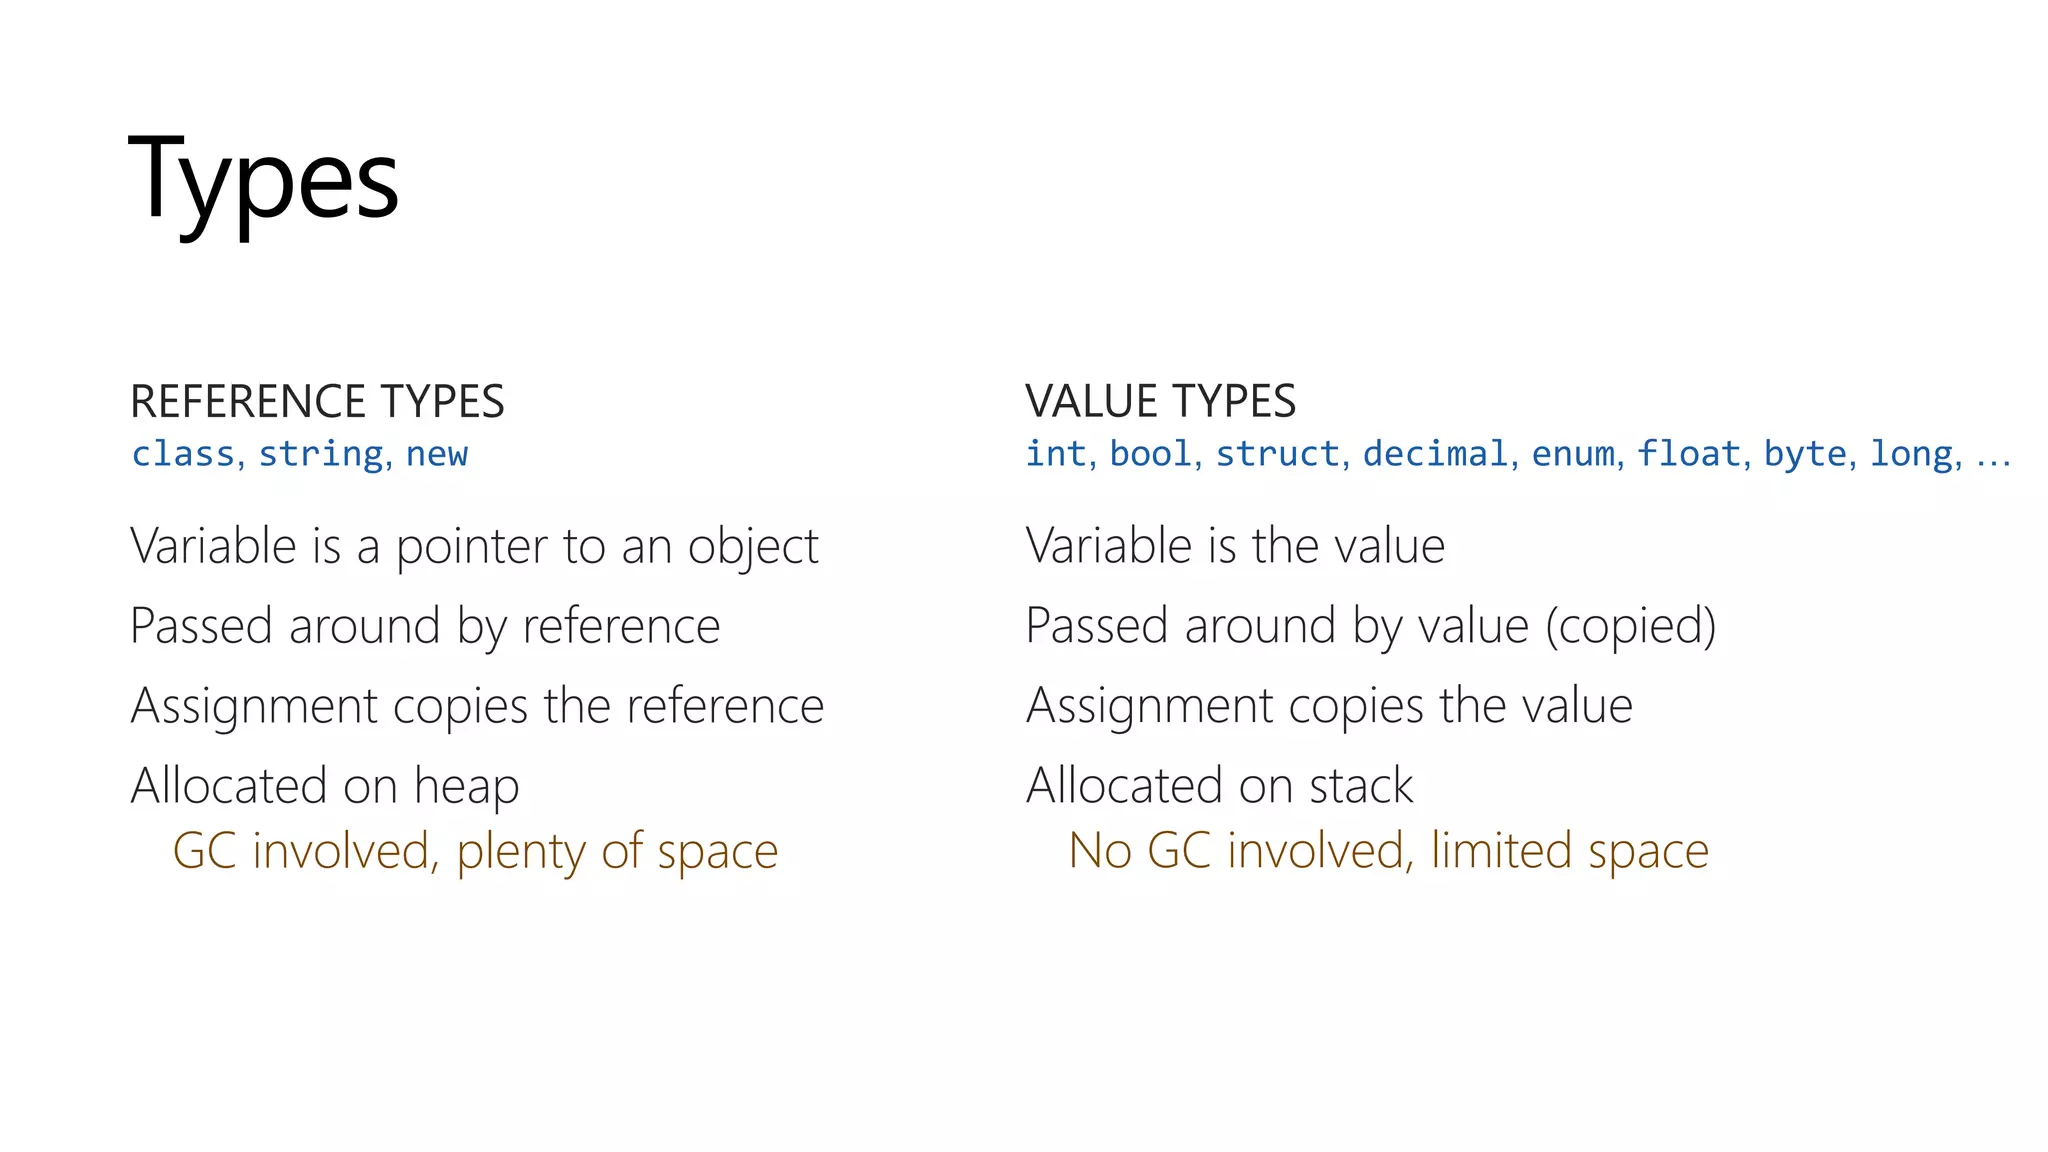
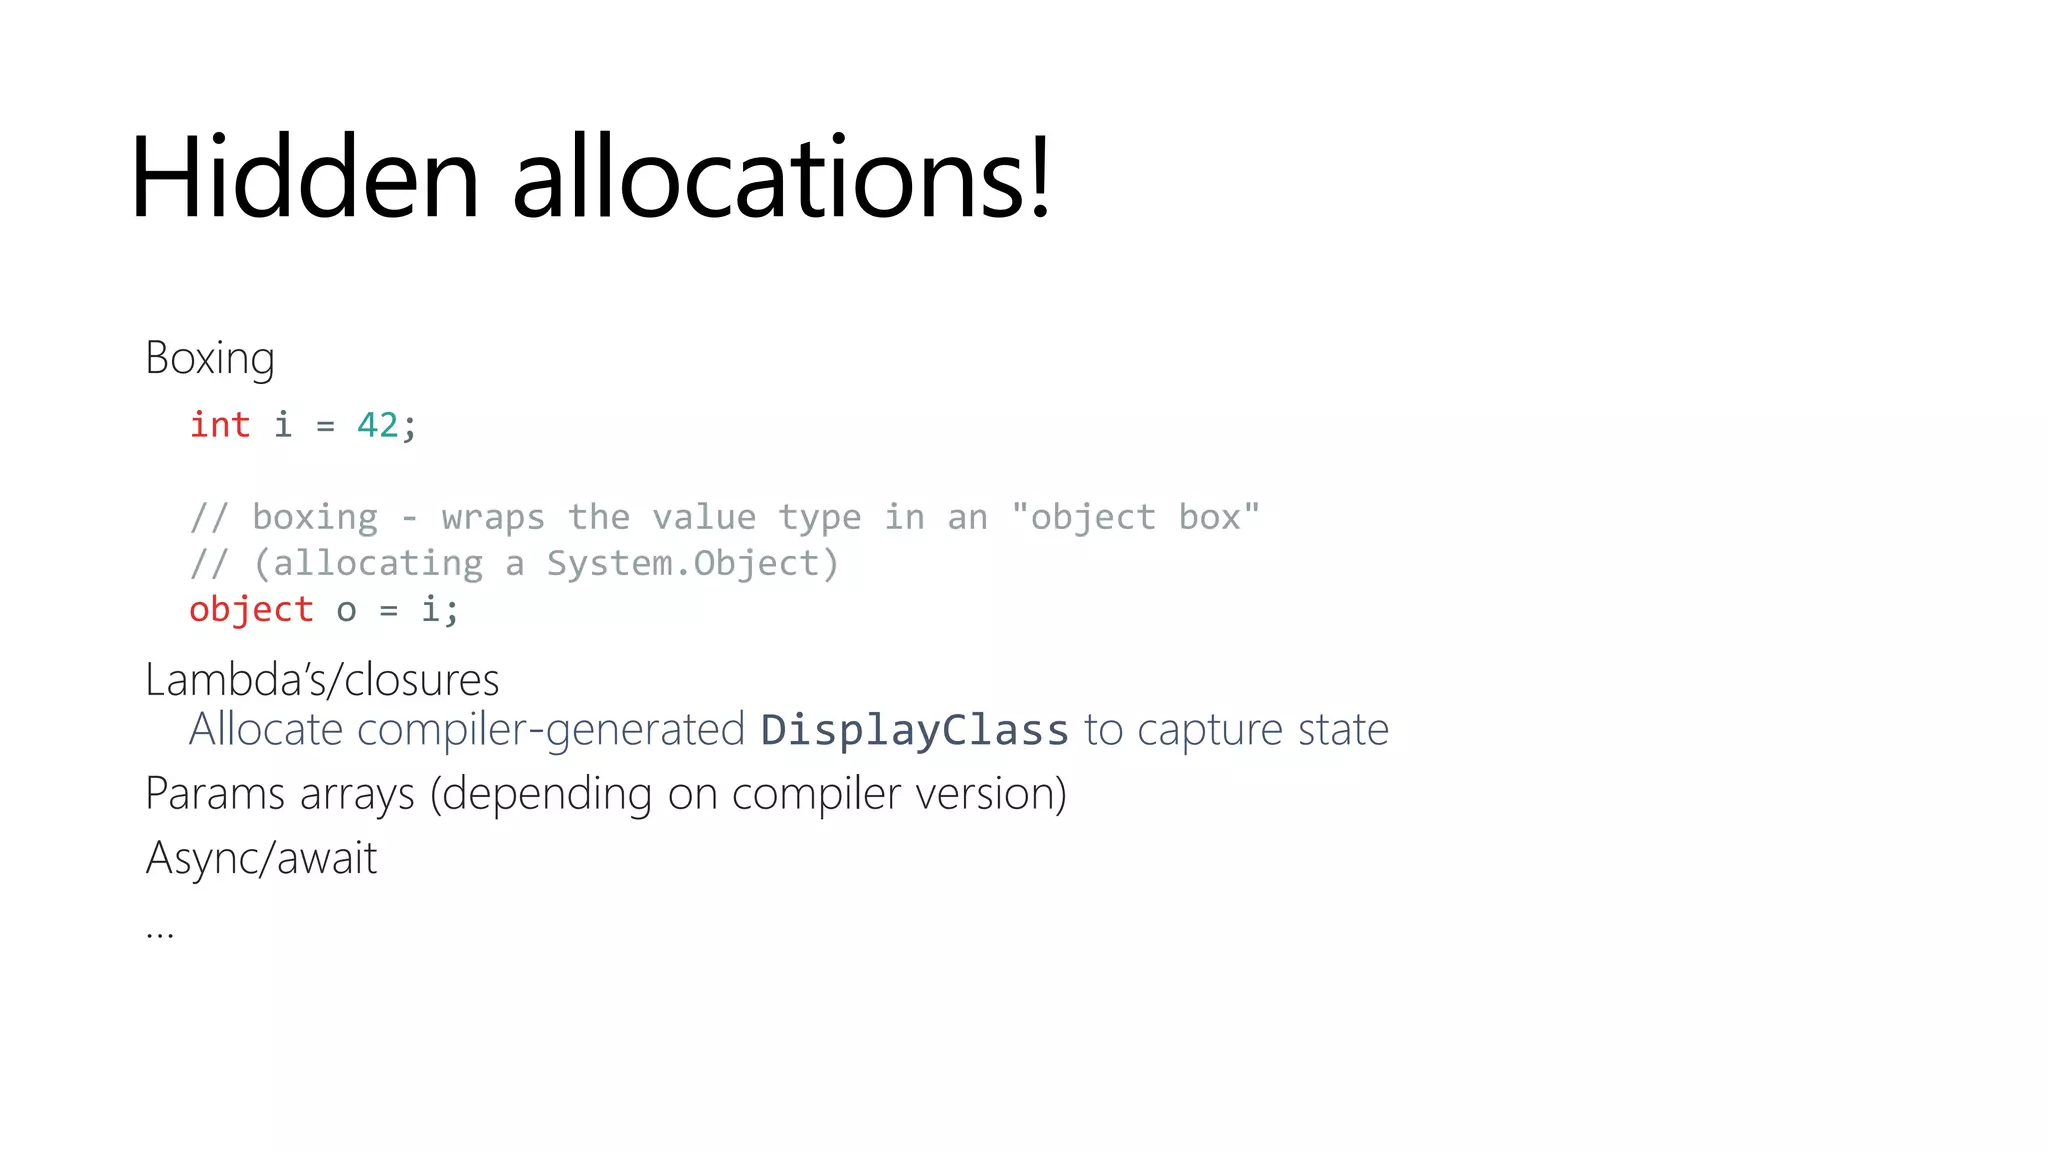
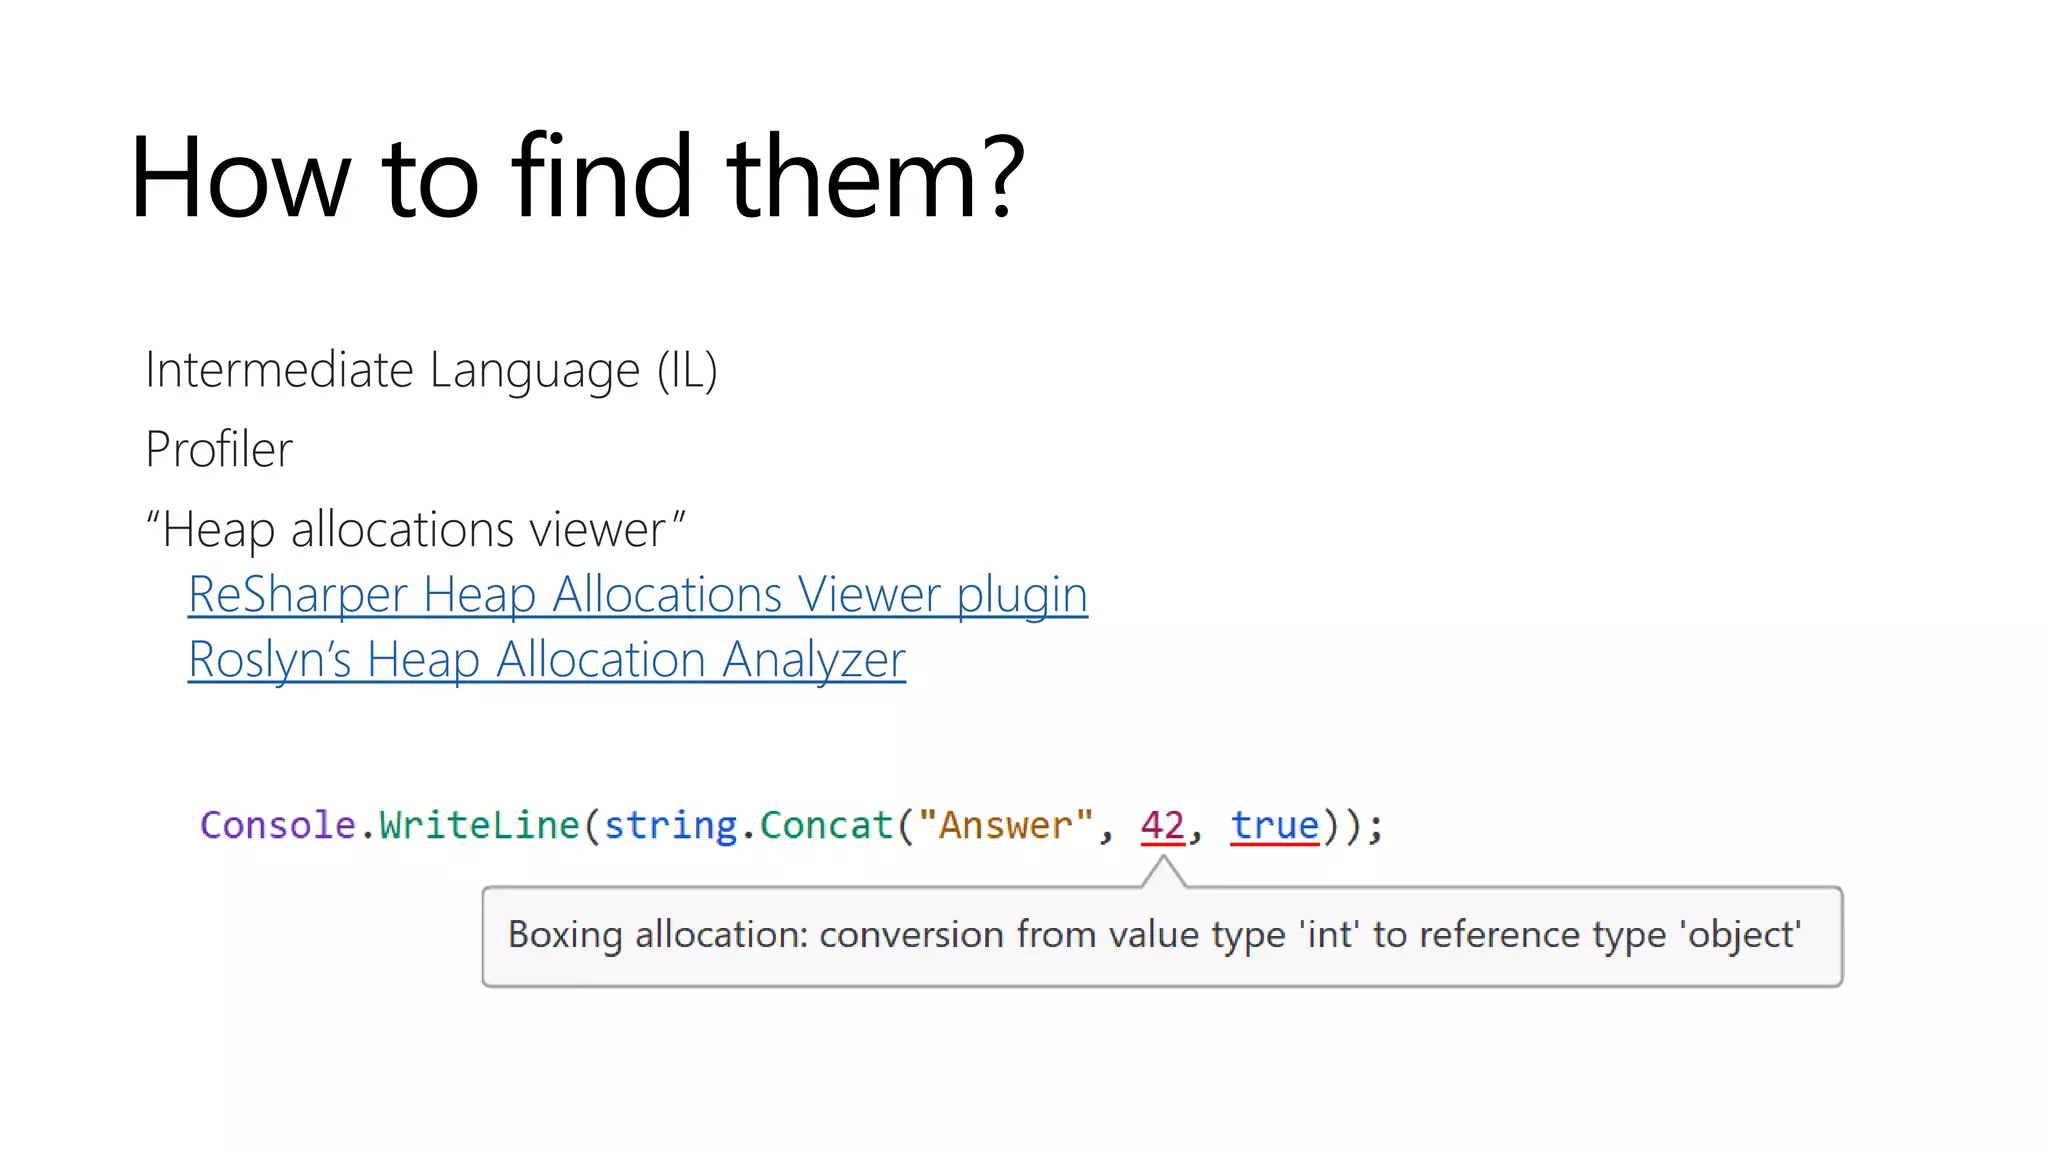
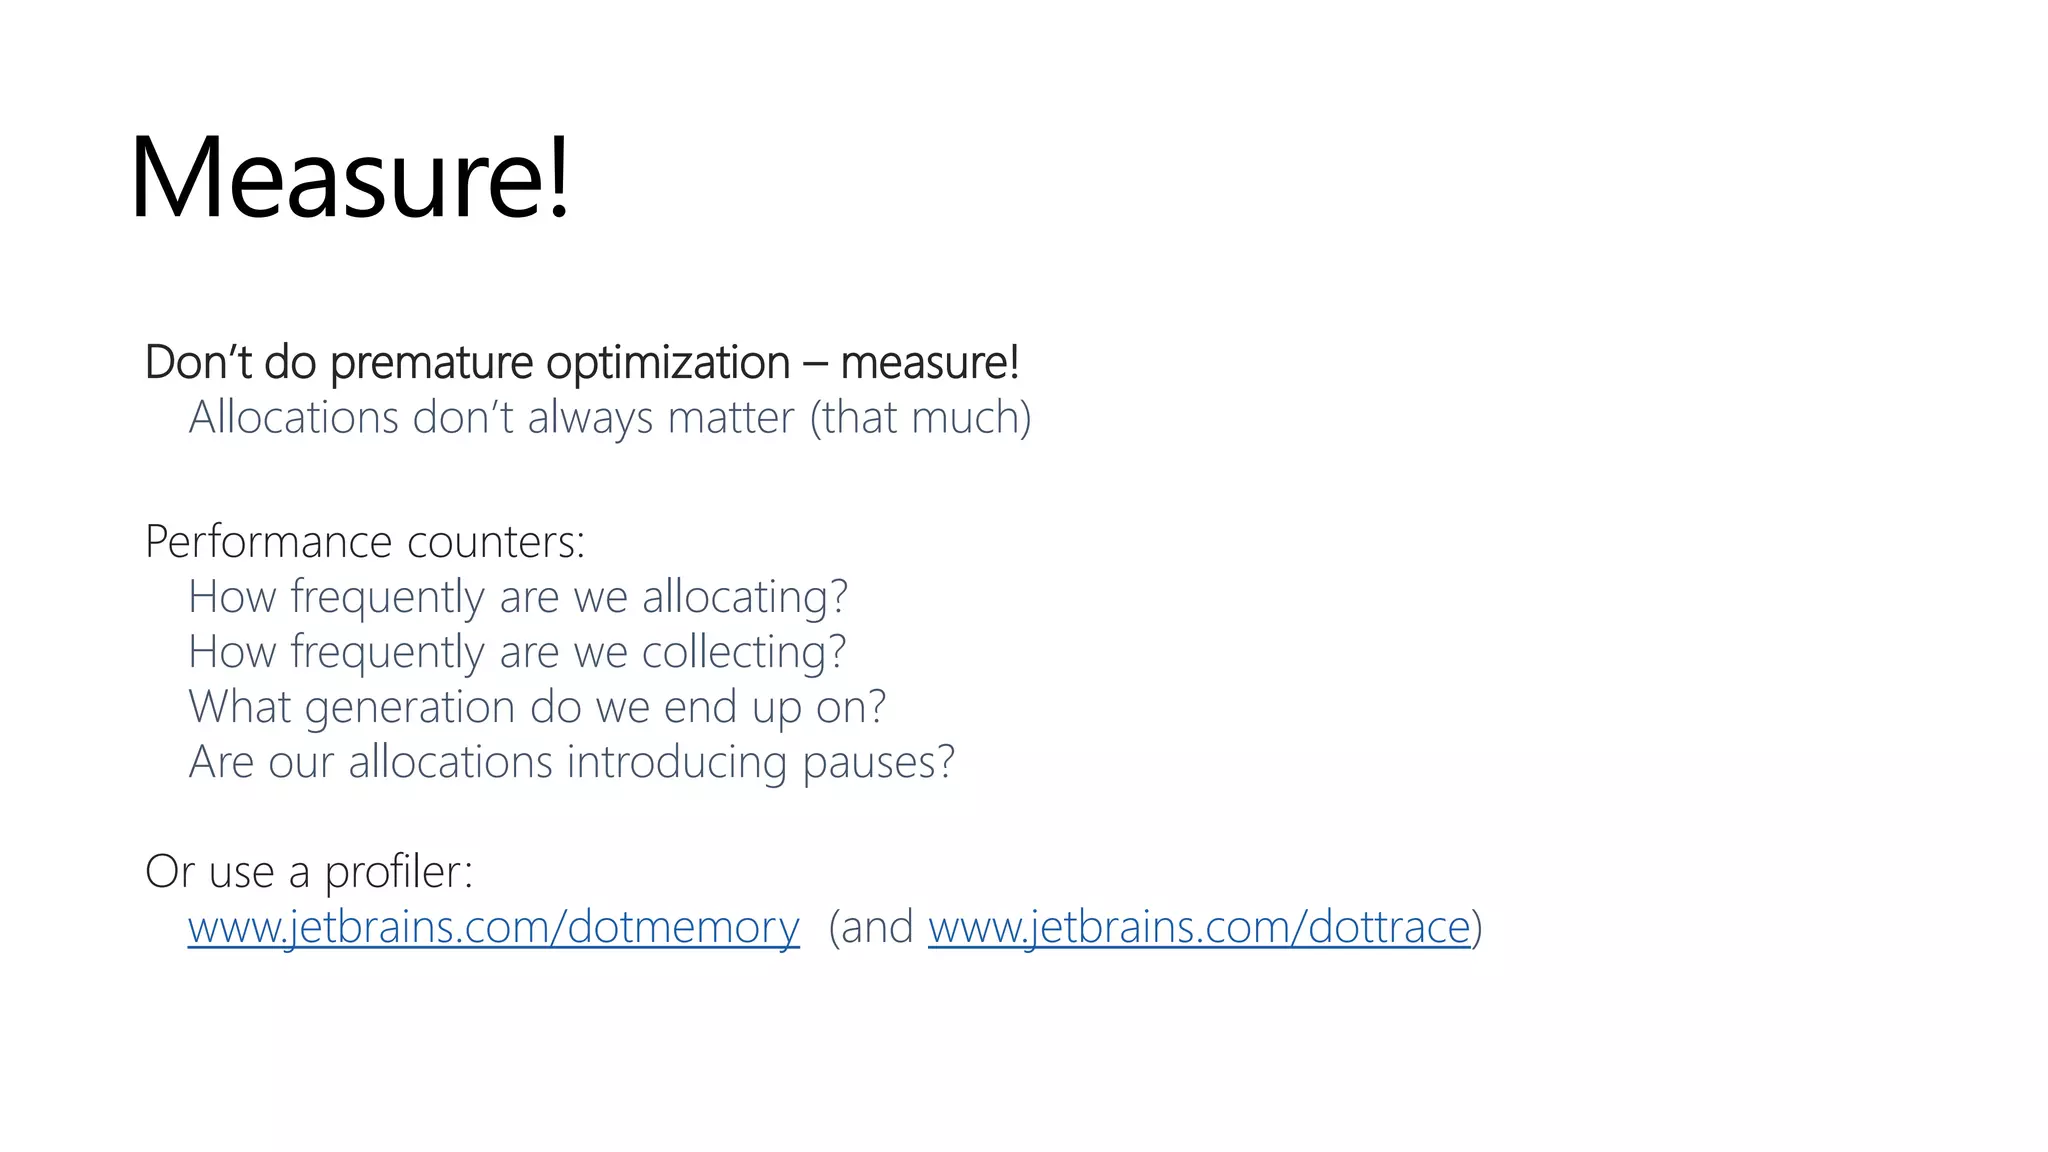
This document discusses .NET memory management and the garbage collector. It explains that the CLR manages memory in a heap and the garbage collector reclaims unused memory. It describes how objects are allocated in generations and discusses how to help the garbage collector perform better by reducing allocations, using value types when possible, and properly disposing of objects. The document also provides examples of hidden allocations and demonstrates tools for analyzing memory usage like ClrMD and dotMemory Unit.


![Vibe Coding vs. Spec-Driven Development [Free Meetup]](https://cdn.slidesharecdn.com/ss_thumbnails/vibecodingvsspecdrivendevelopment-251209105622-43f455e7-thumbnail.jpg?width=640&height=640&fit=bounds)


