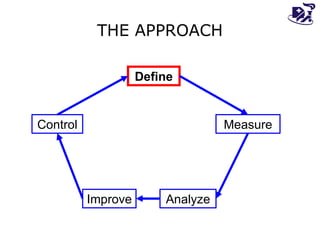
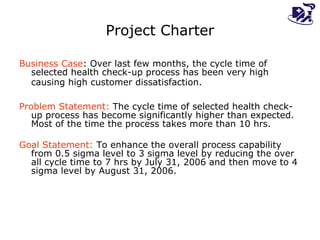
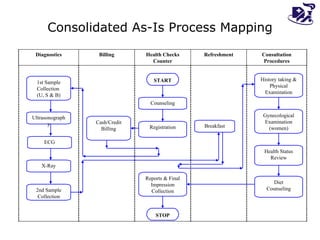
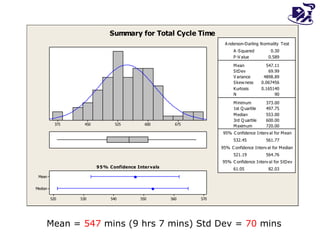
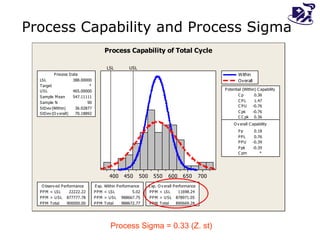
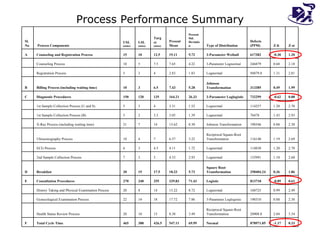
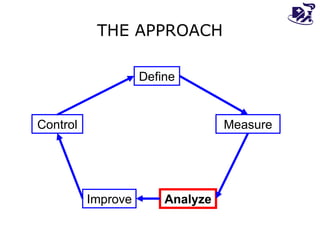
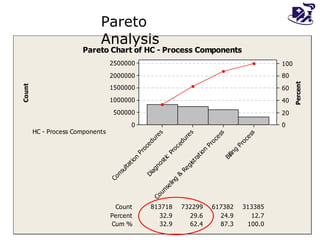
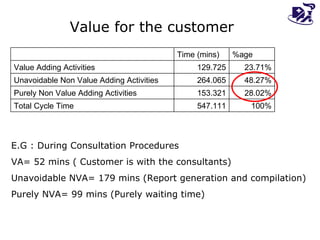
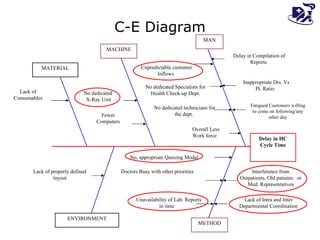
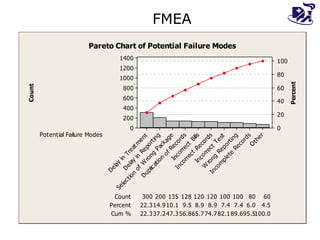
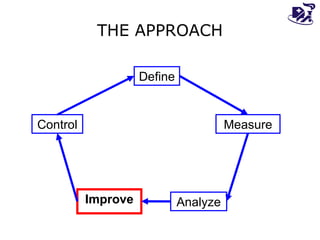
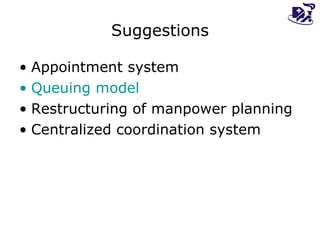
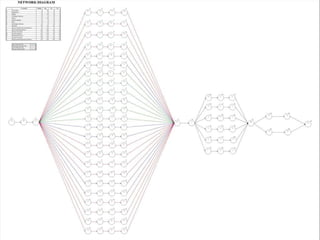
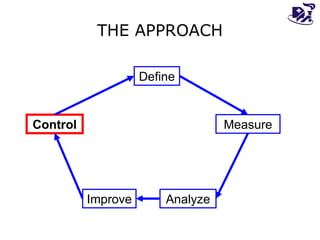
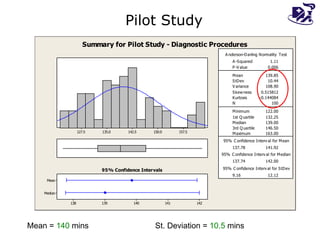
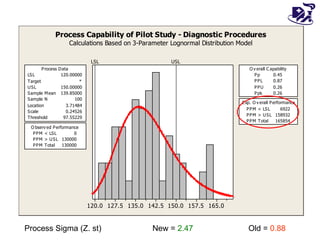
International Conference  on  Statistics, OR and IT 7-9 January 2007,TIRUPATI Dr. J.P Pattanaik MHM, Green Belt Six-Sigma Apollo Institute of Hospital Administration Hyderabad
PROCESS OPTIMIZATION OF A HEALTH CHECK-UP PACKAGE USING SIX-SIGMA APPROACH FOR EFFICIENCY ENHANCEMENT The purpose of Six-Sigma is to reduce variation to achieve very small standard deviations so that almost all products or services meet or exceed customer expectations.
THE APPROACH Define Measure Control Improve Analyze
Project Charter Business Case :  Over last few months, the cycle time of selected health check-up process has been very high causing high customer dissatisfaction.   Problem Statement:   The cycle time of selected health check-up process has become significantly higher than expected. Most of the time the process takes more than 10 hrs. Goal Statement:  To enhance the overall process capability from 0.5 sigma level to 3 sigma level by reducing the over all cycle time to 7 hrs by July 31, 2006 and then move to 4 sigma level by August 31, 2006.
Voice of the Customer (VOC) Techniques Used: Interview Feedback form Analysis Suggestion Book Informal Interaction QFD- House of Quality CTQs: Defined Process Waiting time Cycle time Accuracy of Reports Timeliness of reports Better service in terms of promptness Grievance handling Value for money
 
THE APPROACH Define Measure Control Improve Analyze
Diagnostics Billing Health Checks Counter Refreshment Consultation Procedures START Counseling Registration Cash/Credit Billing 1st Sample Collection  (U, S & B) Ultrasonography ECG 2nd Sample Collection Breakfast History taking & Physical Examination Gynecological Examination (women) Health Status Review Diet Counseling Reports & Final Impression Collection STOP Consolidated As-Is Process Mapping X-Ray
Mean =  547  mins (9 hrs 7 mins) Std Dev =  70  mins
Process Sigma = 0.33 (Z. st) Process Capability and Process Sigma
Process Performance Summary 0.33 -1.17 878971.05 Normal 69.99 547.11 426.5 388 465 Total Cycle Time F 3.54 2.04 20908.8 Reciprocal Square-Root Transformation 3.49 8.38 15 10 20 Health Status Review Process   2.38 0.88 190310 3-Parameter Loglogistic  7.86 17.72 18 14 22 Gynecological Examination Process   2.49 0.99 160725 Lognormal 8.72 13.22 14 8 20 History Taking and Physical Examination Process   0.61 -0.89 813718 Logistic 71.43 329.83 255 240 270 Consultation Procedures E 1.86 0.36 358404.24 Square Root Transformation 5.73 18.33 17.5 15 20 Breakfast D 2.60 1.10 135991 Lognormal 2.93 4.33 5 3 7 2nd Sample Collection Process   2.70 1.20 114830 Lognormal 1.72 4.11 4.5 3 6 ECG Process   2.69 1.19 116140 Reciprocal Square-Root Transformation 3.22 6.57 7 4 10 Ultrasonography Process   2.38 0.88 190346 Johnson Transformation  8.30 13.62 14 7 21 X-Ray Process (including waiting time)   2.93 1.43 76478 Lognormal 1.39 3.05 3.5 2 5 1st Sample Collection Process (B)   2.70 1.20 114257 Lognormal 1.52 3.31 4 3 5 1st Sample Collection Process (U and S)   0.88 -0.62 732299 3-Parameter Loglogistic 26.33 164.21 135 120 150 Diagnostic Procedures C 1.99 0.49 313385 Johnson Transformation  5.28 7.43 6.5 3 10 Billing Process (including waiting time) B 2.81 1.31 94879.8 Lognormal 1.83 2.83 4 3 5 Registration Process   2.18 0.68 246879 3-Parameter Lognormal  4.22 7.65 7.5 5 10 Counseling Process   1.20 -0.30 617382 3-Parameter Weibull 9.72 19.11 12.5 10 15 Counseling and Registration Process A Z-st Z-lt Defects (PPM) Type of Distribution Present Std. Deviation Present Mean Target  (mins) LSL  (mins) USL  (mins) Process Components Sl. No
THE APPROACH Define Measure Control Improve Analyze
Pareto Analysis
E.G : During Consultation Procedures VA= 52 mins ( Customer is with the consultants) Unavoidable NVA= 179 mins (Report generation and compilation) Purely NVA= 99 mins (Purely waiting time) Value for the customer 100% 547.111 Total Cycle Time 28.02% 153.321 Purely Non Value Adding Activities 48.27% 264.065 Unavoidable Non Value Adding Activities 23.71% 129.725 Value Adding Activities %age Time (mins)  
C-E Diagram No, appropriate Queuing Model No dedicated technicians for the dept.  Delay in HC Cycle Time MACHINE MAN METHOD ENVIRONMENT MATERIAL Lack of Consumables Interference from Outpatients, Old patients  or Med. Representatives Unavailability of Lab. Reports in time  Fatigued Customers willing to come on following/any other day No dedicated Specialists for Health Check-up Dept. Doctors Busy with other priorities Delay in Compilation of Reports  No dedicated  X-Ray Unit Lack of Intra and Inter Departmental Coordination Unpredictable customer Inflows  Fewer Computers Lack of properly defined layout Inappropriate Drs. Vs Pt. Ratio  Overall Less Work force
FMEA
THE APPROACH Define Measure Control Improve Analyze
Suggestions Appointment system Queuing model Restructuring of manpower planning Centralized coordination system
 
THE APPROACH Define Measure Control Improve Analyze
Pilot Study Mean =  140  mins  St. Deviation =  10.5  mins
Process Sigma (Z. st) New =  2.47  Old =  0.88
 
CHALLENGES Coordination of the Activities Resources and Infrastructure Cooperation and Training  Unpredictable Customer Flow
FUTURE PLANS Phase wise Implementation Continuous Monitoring Automation Adoption of Learning
THANK YOU [email_address]

ISPS 2007

  • 1.
    International Conference on Statistics, OR and IT 7-9 January 2007,TIRUPATI Dr. J.P Pattanaik MHM, Green Belt Six-Sigma Apollo Institute of Hospital Administration Hyderabad
  • 2.
    PROCESS OPTIMIZATION OFA HEALTH CHECK-UP PACKAGE USING SIX-SIGMA APPROACH FOR EFFICIENCY ENHANCEMENT The purpose of Six-Sigma is to reduce variation to achieve very small standard deviations so that almost all products or services meet or exceed customer expectations.
  • 3.
    THE APPROACH DefineMeasure Control Improve Analyze
  • 4.
    Project Charter BusinessCase : Over last few months, the cycle time of selected health check-up process has been very high causing high customer dissatisfaction. Problem Statement: The cycle time of selected health check-up process has become significantly higher than expected. Most of the time the process takes more than 10 hrs. Goal Statement: To enhance the overall process capability from 0.5 sigma level to 3 sigma level by reducing the over all cycle time to 7 hrs by July 31, 2006 and then move to 4 sigma level by August 31, 2006.
  • 5.
    Voice of theCustomer (VOC) Techniques Used: Interview Feedback form Analysis Suggestion Book Informal Interaction QFD- House of Quality CTQs: Defined Process Waiting time Cycle time Accuracy of Reports Timeliness of reports Better service in terms of promptness Grievance handling Value for money
  • 6.
  • 7.
    THE APPROACH DefineMeasure Control Improve Analyze
  • 8.
    Diagnostics Billing HealthChecks Counter Refreshment Consultation Procedures START Counseling Registration Cash/Credit Billing 1st Sample Collection (U, S & B) Ultrasonography ECG 2nd Sample Collection Breakfast History taking & Physical Examination Gynecological Examination (women) Health Status Review Diet Counseling Reports & Final Impression Collection STOP Consolidated As-Is Process Mapping X-Ray
  • 9.
    Mean = 547 mins (9 hrs 7 mins) Std Dev = 70 mins
  • 10.
    Process Sigma =0.33 (Z. st) Process Capability and Process Sigma
  • 11.
    Process Performance Summary0.33 -1.17 878971.05 Normal 69.99 547.11 426.5 388 465 Total Cycle Time F 3.54 2.04 20908.8 Reciprocal Square-Root Transformation 3.49 8.38 15 10 20 Health Status Review Process   2.38 0.88 190310 3-Parameter Loglogistic 7.86 17.72 18 14 22 Gynecological Examination Process   2.49 0.99 160725 Lognormal 8.72 13.22 14 8 20 History Taking and Physical Examination Process   0.61 -0.89 813718 Logistic 71.43 329.83 255 240 270 Consultation Procedures E 1.86 0.36 358404.24 Square Root Transformation 5.73 18.33 17.5 15 20 Breakfast D 2.60 1.10 135991 Lognormal 2.93 4.33 5 3 7 2nd Sample Collection Process   2.70 1.20 114830 Lognormal 1.72 4.11 4.5 3 6 ECG Process   2.69 1.19 116140 Reciprocal Square-Root Transformation 3.22 6.57 7 4 10 Ultrasonography Process   2.38 0.88 190346 Johnson Transformation 8.30 13.62 14 7 21 X-Ray Process (including waiting time)   2.93 1.43 76478 Lognormal 1.39 3.05 3.5 2 5 1st Sample Collection Process (B)   2.70 1.20 114257 Lognormal 1.52 3.31 4 3 5 1st Sample Collection Process (U and S)   0.88 -0.62 732299 3-Parameter Loglogistic 26.33 164.21 135 120 150 Diagnostic Procedures C 1.99 0.49 313385 Johnson Transformation 5.28 7.43 6.5 3 10 Billing Process (including waiting time) B 2.81 1.31 94879.8 Lognormal 1.83 2.83 4 3 5 Registration Process   2.18 0.68 246879 3-Parameter Lognormal 4.22 7.65 7.5 5 10 Counseling Process   1.20 -0.30 617382 3-Parameter Weibull 9.72 19.11 12.5 10 15 Counseling and Registration Process A Z-st Z-lt Defects (PPM) Type of Distribution Present Std. Deviation Present Mean Target (mins) LSL (mins) USL (mins) Process Components Sl. No
  • 12.
    THE APPROACH DefineMeasure Control Improve Analyze
  • 13.
  • 14.
    E.G : DuringConsultation Procedures VA= 52 mins ( Customer is with the consultants) Unavoidable NVA= 179 mins (Report generation and compilation) Purely NVA= 99 mins (Purely waiting time) Value for the customer 100% 547.111 Total Cycle Time 28.02% 153.321 Purely Non Value Adding Activities 48.27% 264.065 Unavoidable Non Value Adding Activities 23.71% 129.725 Value Adding Activities %age Time (mins)  
  • 15.
    C-E Diagram No,appropriate Queuing Model No dedicated technicians for the dept. Delay in HC Cycle Time MACHINE MAN METHOD ENVIRONMENT MATERIAL Lack of Consumables Interference from Outpatients, Old patients or Med. Representatives Unavailability of Lab. Reports in time Fatigued Customers willing to come on following/any other day No dedicated Specialists for Health Check-up Dept. Doctors Busy with other priorities Delay in Compilation of Reports No dedicated X-Ray Unit Lack of Intra and Inter Departmental Coordination Unpredictable customer Inflows Fewer Computers Lack of properly defined layout Inappropriate Drs. Vs Pt. Ratio Overall Less Work force
  • 16.
  • 17.
    THE APPROACH DefineMeasure Control Improve Analyze
  • 18.
    Suggestions Appointment systemQueuing model Restructuring of manpower planning Centralized coordination system
  • 19.
  • 20.
    THE APPROACH DefineMeasure Control Improve Analyze
  • 21.
    Pilot Study Mean= 140 mins St. Deviation = 10.5 mins
  • 22.
    Process Sigma (Z.st) New = 2.47 Old = 0.88
  • 23.
  • 24.
    CHALLENGES Coordination ofthe Activities Resources and Infrastructure Cooperation and Training Unpredictable Customer Flow
  • 25.
    FUTURE PLANS Phasewise Implementation Continuous Monitoring Automation Adoption of Learning
  • 26.