Download to read offline


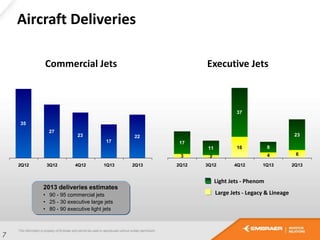
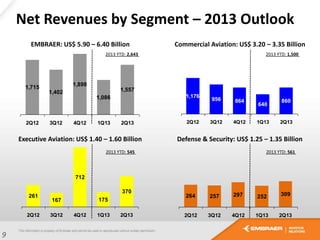
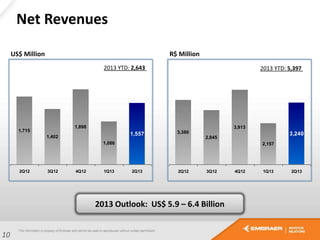
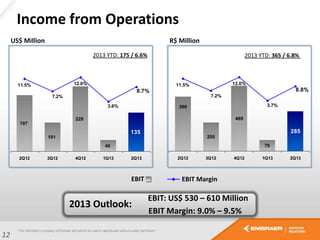

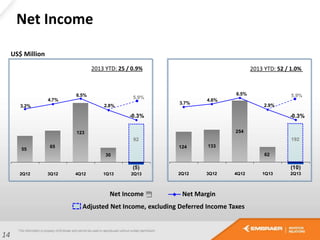


- Embraer delivered 22 commercial jets in the second quarter of 2013, bringing total deliveries to 947 since entering service. Firm orders were placed for E-Jets by Air Costa, JAL, Venezuela's Conviasa, and SkyWest. - In executive aviation, 29 jets were delivered in the second quarter, including the 400th Phenom jet. NetJets took delivery of its first Phenom 300 from a potential order of 125 aircraft. - Financial results were in line with projections, with net revenues of $2.64 billion and a net income of $25 million for the first half of 2013. Embraer expects full year revenues between $5.9-6.4 billion and a


