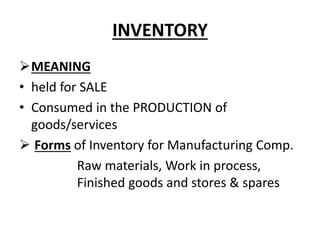
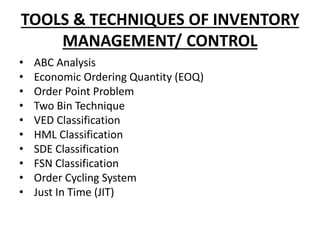
INVENTORY MANAGEMENT
INVENTORY
MEANING
• held for SALE
• Consumed in the PRODUCTION of
goods/services
 Forms of Inventory for Manufacturing Comp.
Raw materials, Work in process,
Finished goods and stores & spares
Inventory Management- objectives
• minimize investments in inventory
• meet the demand for products by
efficiently organizing the production &
sales operations
COSTS OF HOLDING INVENTORIES
• Ordering costs
• Inventory Carrying costs
• Opportunity costs of funds blocked
• Shortage
RISK OF HOLDING INVENTORY
• Price decline
• Product Deterioration
• Product Obsolescence
TOOLS & TECHNIQUES OF INVENTORY
MANAGEMENT/ CONTROL
• ABC Analysis
• Economic Ordering Quantity (EOQ)
• Order Point Problem
• Two Bin Technique
• VED Classification
• HML Classification
• SDE Classification
• FSN Classification
• Order Cycling System
• Just In Time (JIT)
ABC Analysis
CATEGORY NO. OF ITEMS(%) ITEM VALUE(%) MANAGEMENT
CONTROL
A 15 70 (HIGHEST) MAXIMUM
B 30 20(MODERATE) MODERATE
C 55 10(LEAST) MINIMUM
TOTAL 100 100
Economic Ordering Quantity (EOQ)
• Level of Inventory at which
• Total Cost* of Inventory is MINIMUM
*(Ordering and Carrying Cost)
EOQ MODEL
2UP
Q =
S
Q = Economic Order Quantity
U = Annual usage/demand
P = Cost of Placing an order
S = Storage cost per unit per order
* Where Storage cost is given in % , it is always calculated by
multiplying the % with the purchase price of raw material
per unit, i.e Storage cost = % X Purchase price of raw
material
BEHAVIOUR OF INVENTORY RELATED COSTS
Costs
Total costs
Carrying costs
Ordering costs
Quantity ordered
EOQ- Example
• A firm’s annual inventory is 1,600 units. The cost of placing
an order is Rs 50, purchase price of raw material/unit is
Rs.10 and the carrying costs is expected to be 10% per unit
p.a. Calculate EOQ?
U=1600, P= Rs. 50, S= .10 x Rs.10=Rs.1
EOQ = 2 x 1600 x 50
1
= 400 units
Order Point Problem
• The re-order point is that level of inventory when a fresh
order should be placed with suppliers. It is that inventory
level which is equal to the consumption during the lead
time or procurement time.
• Re-order level = (Daily usage × Lead time) + Safety stock.
• Minimum level = Re-order level – (Normal usage × Average
delivery time).
• Maximum level = Reorder level – (Minimum usage ×
Maximum delivery time) + Re-order quantity.
• Average stock level = Minimum level + (Re-order
quantity)/2.
• Danger level = (Average consumption per day × Lead time
in days for emergency purchases).
Two Bin Technique
• Control of Category ‘C’ inventories
• Two Bins/Groups
First Bin- just enough to last from the date a
new order is placed until it is received
for inventory.
Second Bin- enough to meet current demand
over the period of replenishment.
VED Classification
• Specifically used for Classification of SPARE PARTS
V- part is VITAL( high stock level)
E- part is ESSENTIAL (moderate stock level )
D- part is DESIRABLE (minimum stock level )
HML Classification
• Material classified on the basis of UNIT VALUE
 H- HIGH VALUE
 M- MEDIUM VALUE
 L – LOW VALUE
FSN Classification
• Inventory is classified based on the
MOVEMENT OF INVENTORIES from stores
• Inventory technique used to AVOID
OBSOLESCENCE
 F- Fast moving
 S- Slow moving
 N- Non moving
ORDERING CYCLING SYSTEM
• Periodic reviews are made
• of each item of inventory
• & orders are placed
• to restore stock
• to a prescribed stock level
JUST-IN-TIME (JIT) INVENTORY CONTROL
• The JIT control system implies that the firm should
maintain a minimal level of inventory and rely on
suppliers to provide parts and components ‘just-in-time’
to meet its assembly requirements.
• JIT also known as Zero Inventory Production Systems(ZIPS),
Zero Inventories(ZIN), Materials as Needed(MAN), or Neck of
Time(N0T)
JIT Vs. JIC
• This may be contrasted with the traditional
inventory management system which calls for
maintaining a healthy level of safety stock to
provide a reasonable protection against
uncertainties of consumption and supply – the
traditional system may be referred to as a
“just-in-case” system.
• The most commonly used tools of inventory
management in India are: ABC analysis, FSN
analysis and inventory turnover analysis.

Inventory management ABC Analysis, EOQ formula

  • 1.
  • 2.
    INVENTORY MEANING • held forSALE • Consumed in the PRODUCTION of goods/services  Forms of Inventory for Manufacturing Comp. Raw materials, Work in process, Finished goods and stores & spares
  • 3.
    Inventory Management- objectives •minimize investments in inventory • meet the demand for products by efficiently organizing the production & sales operations
  • 4.
    COSTS OF HOLDINGINVENTORIES • Ordering costs • Inventory Carrying costs • Opportunity costs of funds blocked • Shortage
  • 5.
    RISK OF HOLDINGINVENTORY • Price decline • Product Deterioration • Product Obsolescence
  • 6.
    TOOLS & TECHNIQUESOF INVENTORY MANAGEMENT/ CONTROL • ABC Analysis • Economic Ordering Quantity (EOQ) • Order Point Problem • Two Bin Technique • VED Classification • HML Classification • SDE Classification • FSN Classification • Order Cycling System • Just In Time (JIT)
  • 7.
    ABC Analysis CATEGORY NO.OF ITEMS(%) ITEM VALUE(%) MANAGEMENT CONTROL A 15 70 (HIGHEST) MAXIMUM B 30 20(MODERATE) MODERATE C 55 10(LEAST) MINIMUM TOTAL 100 100
  • 8.
    Economic Ordering Quantity(EOQ) • Level of Inventory at which • Total Cost* of Inventory is MINIMUM *(Ordering and Carrying Cost)
  • 9.
    EOQ MODEL 2UP Q = S Q= Economic Order Quantity U = Annual usage/demand P = Cost of Placing an order S = Storage cost per unit per order * Where Storage cost is given in % , it is always calculated by multiplying the % with the purchase price of raw material per unit, i.e Storage cost = % X Purchase price of raw material
  • 10.
    BEHAVIOUR OF INVENTORYRELATED COSTS Costs Total costs Carrying costs Ordering costs Quantity ordered
  • 11.
    EOQ- Example • Afirm’s annual inventory is 1,600 units. The cost of placing an order is Rs 50, purchase price of raw material/unit is Rs.10 and the carrying costs is expected to be 10% per unit p.a. Calculate EOQ? U=1600, P= Rs. 50, S= .10 x Rs.10=Rs.1 EOQ = 2 x 1600 x 50 1 = 400 units
  • 12.
    Order Point Problem •The re-order point is that level of inventory when a fresh order should be placed with suppliers. It is that inventory level which is equal to the consumption during the lead time or procurement time. • Re-order level = (Daily usage × Lead time) + Safety stock. • Minimum level = Re-order level – (Normal usage × Average delivery time). • Maximum level = Reorder level – (Minimum usage × Maximum delivery time) + Re-order quantity. • Average stock level = Minimum level + (Re-order quantity)/2. • Danger level = (Average consumption per day × Lead time in days for emergency purchases).
  • 13.
    Two Bin Technique •Control of Category ‘C’ inventories • Two Bins/Groups First Bin- just enough to last from the date a new order is placed until it is received for inventory. Second Bin- enough to meet current demand over the period of replenishment.
  • 14.
    VED Classification • Specificallyused for Classification of SPARE PARTS V- part is VITAL( high stock level) E- part is ESSENTIAL (moderate stock level ) D- part is DESIRABLE (minimum stock level )
  • 15.
    HML Classification • Materialclassified on the basis of UNIT VALUE  H- HIGH VALUE  M- MEDIUM VALUE  L – LOW VALUE
  • 16.
    FSN Classification • Inventoryis classified based on the MOVEMENT OF INVENTORIES from stores • Inventory technique used to AVOID OBSOLESCENCE  F- Fast moving  S- Slow moving  N- Non moving
  • 17.
    ORDERING CYCLING SYSTEM •Periodic reviews are made • of each item of inventory • & orders are placed • to restore stock • to a prescribed stock level
  • 18.
    JUST-IN-TIME (JIT) INVENTORYCONTROL • The JIT control system implies that the firm should maintain a minimal level of inventory and rely on suppliers to provide parts and components ‘just-in-time’ to meet its assembly requirements. • JIT also known as Zero Inventory Production Systems(ZIPS), Zero Inventories(ZIN), Materials as Needed(MAN), or Neck of Time(N0T)
  • 19.
    JIT Vs. JIC •This may be contrasted with the traditional inventory management system which calls for maintaining a healthy level of safety stock to provide a reasonable protection against uncertainties of consumption and supply – the traditional system may be referred to as a “just-in-case” system. • The most commonly used tools of inventory management in India are: ABC analysis, FSN analysis and inventory turnover analysis.