Downloaded 525 times


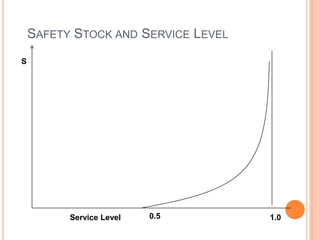


This document discusses safety stock, which is inventory kept on hand to reduce the risk of temporary shortages due to variations in demand or delays in supply. It provides three key points: 1) Safety stock helps absorb variability in customer demand forecasts and lead times to improve customer service levels and prevent stockouts. 2) The right level of safety stock is important - too much wastes money in holding costs but too little can lead to lost sales from stockouts. 3) Safety stock is calculated based on the expected demand during the lead time and the variability or uncertainty in demand and lead times, using methods like percentage of lead time demand or number of days supply.